• No results found

Separation of Biomass Pyrolysis Oil by Supercritical CO2 Extraction

N/A
N/A
Protected

Academic year: 2020

Share "Separation of Biomass Pyrolysis Oil by Supercritical CO2 Extraction"

Copied!
10
0
0

Loading.... (view fulltext now)

Full text

(1)

Separation of Biomass Pyrolysis Oil by

Supercritical CO

2

Extraction

Jinghua Wang1, Hongyou Cui1*, Shuqin Wei1, Shuping Zhuo1, Lihong Wang2, Zhihe Li2, Weiming Yi2

1School of Chemical Engineering, Shandong University of Technology, Zibo, China; 2Shandong Research Center of Engineering and

Technology for Clean Energy, Shandong University of Technology, Zibo, China. Email: [email protected]

Received May 17th 2010; revised June 18th 2010; accepted June 23rd 2010.

ABSTRACT

Supercritical CO2 extraction was employed to separate simulated and real bio-oils. Effects of extraction pressure, tem-perature and adsorbents on distribution coefficient (or enrichment coefficient) of five representative compounds were investigated using a simulated bio-oil, which was composed of acetic acid (AC), propanoic acid (PA), furfural (FR), acetylacetone (AA) and 2-methoxyphenol (MP). The distribution coefficients of AA, FR and MP between supercritical CO2 phase and liquid phase were bigger than 1.5, while those of AC and PA characteristic of relatively strong polarity were less than 1. Temperature and pressure also had impacts on the distribution coefficients of AA, FR and MP, espe-cially remarkable for AA. The extraction of simulated bio-oil spiked on three adsorbents shows that adsorbents influ-ence extraction efficiency and selectivity by changing intermolecular forces. High extraction pressure and relative low temperature are beneficial to reduce the water content in the extract. In addition, the feasibility of supercritical CO2 extraction of real bio-oil was examined. After extraction in the extraction fraction total ketones increased from 14.1% to 21.15~25.40%, phenols from 10.74% to 31.32~41.25%, and aldehydes from 1.92% to 3.95~8.46%, while the acids significantly dropped from 28.15% to 6.92~12.32%, and water from 35.90% to 6.64~4.90%. In view of extraction effi-ciency, the optimal extraction temperature was determined to be 55℃. Extraction efficiency of the real bio-oil in-creased with rising pressure. The maximal extraction efficiency of real bio-oil on water-free basis could reach to 88.6%. After scCO2 extraction, the calorific value and stability of the extract fraction evidently increased and the acidity slight decreased with nearly 100% volatility below 140℃, suggesting potentially applicable as substitute for engine fuel.

Keywords: Supercritical, Extraction, Simulated Bio-Oil, Adsorbent, Carbon Dioxide

1. Introduction

Facing upcoming depletion of fossil fuels and increasing environmental concerns, great effort has been devoted in exploration of biomass energy in the past few decades all over the world, not only because it is recognized as one of the most attractive alternative energy resources in the current century but also it is available in abundance, re-newable and environmentally friendly [1]. Biomass as an energy source is considered sustainable since it is CO2

neutral in the life cycle, causing almost zero net emis-sions of CO2. Moreover, it contains negligible contents

of sulfur, nitrogen, and ash, and gives much lower emis-sion of SO2, NOx, and soot, by combustion, than the

conventional fossil fuels [2]. Among the various biomass utilization technologies, conversion of biomass into bio-oil by fast pyrolysis has been shown promising for internal combustion engine fuels and high value added chemicals from the viewpoint of efficiency and

econom-ics [3-5].

(2)

technologies have some shortcomings due to the com-plexity and thermal instability of bio-oil.

Separation and refining of bio-oil possess advantages in keeping original components, simple operation, low investment, and probably obtaining valuable chemicals. Several conventional separation techniques, like distilla-tion, molecular distilladistilla-tion, solvent extraction and ad-sorption, have been attempted, but they seemed not to be very satisfying [14,15]. Recently, supercritical technol-ogy was also introduced into this field, but mainly fo-cused on the bio-oil upgrading by esterification and py-rolysis in supercritical alcohols [16], as well as hydrode-oxygenation of phenols in supercritical n-hexane [17]. Supercritical CO2 extraction has been demonstrated a

powerful tool in separation of thermal sensitive chemi-cals in the past few decades because of the relatively low critical pressure (73.8 atm) and critical temperature (31.1

℃) of CO2. Compared with organic solvents, carbon

dioxide is nontoxic, nonflammable, noncorrosive, cheap, and readily available in abundance with high purity. Su-percritical CO2 extraction has been extensively used in

extracting natural products. Very recently, scCO2

extrac-tion of bio-oil was attempted by Rout et al. [18]. Their

research results clearly showed that most of the valuable compounds such as furanoids, pyranoids and benzenoids could be enriched into the extract fraction, while water could be removed effectively after extraction. As a result, the calorific value of the bio-oil was improved.

In this work, supercritical CO2 extraction of bio-oil

was systemically studied. Based on the experimental estimation of two-phase distribution coefficient (or en-richment coefficient) of a simulated bio-oil, effects of extraction pressure, temperature and adsorbents on su-percritical CO2 extraction of real bio-oil were

investi-gated and the quality of the bio-oil after extraction was evaluated in comparison with the original oil.

2. Experimental

2.1 Experimental Materials

The bio-oil used in the extraction experiment was made by flash pyrolysis of pulverized corn stalk with size of 0.1 mm~0.25 mm in the temperature range of 477~480℃. 5A molecular sieve, activated carbon, silica and Karl- Fischer reagent were purchased from Kermel chemical Reagent Co. (Tianjin, China). 1-methoxy-2-propanol was obtained from Acros Organics Co. with purity no less than 98.5%. All other chemicals were analytic reagents with purities more than 98% and used as received. For preparation of a simulated bio-oil, five compounds were chosen to be representative compounds and directly mixed in approximate connection with the composition in the real bio-oil. Namely, it was composed of 14.24% acetylacetone, 24.87% acetic acid, 5.87% 2-methoxyphenol, 6.39% propanoic acid, 12.37% furfural and 36.25%

de-ionized water respectively.

2.2 Supercritical Fluid Extraction Setup

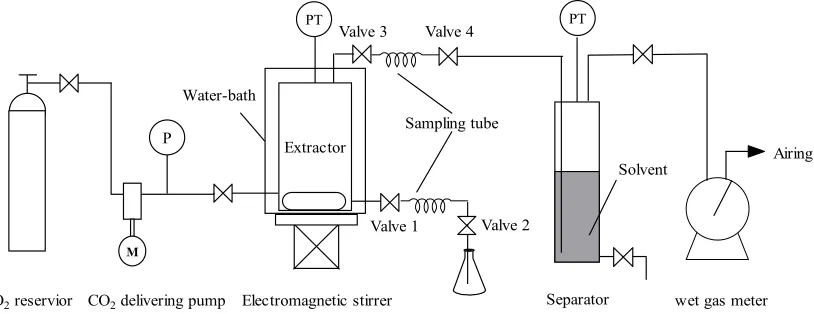
All supercritical extraction experiments were conducted on a supercritical CO2 extraction setup as shown in

Fig-ure 1, which mainly consists of a CO2 reservior, a CO2

delivering pump, an autoclave extractor (150 mL, 316 stainless steel) equipped with electromagnetic agitation and water-bath heating system, a separator (100 mL, 316 stainless steel) and a wet gas flow meter. The tempera-tures both for the extractor and the separator were meas-ured by thermal couples and the pressures were gauged by manometers. When performing extraction experiment, bio-oil or adsorbed bio-oil was firstly charged to the ex-tractor, followed by introduction of CO2 using the CO2

delivering pump, and then heated up to the desired ex-traction temperature and pressure. The temperature and the pressure were controlled in accuracies of  1℃ and 0.1 MPa respectively.

In the case of adsorbed bio-oil equilibration experi-ment, 12 g bio-oil was spiked on 30 g absorbent (silica, molecular sieve or active carbon) in advance and allowed to store in a closed vessel for 24 h at room temperature. Before extraction, they were wrapped up with a piece of nylon filtration fiber and then put into the extractor. For the phase behavior experiments without absorbents, elec-tromagnetic agitator was used to enhance transportation between scCO2 phase and liquid phase kept at constant

temperature and pressure for at least 1.0 h to approaching equilibrium, while in the experiments for absorbed bio-oil where agitator couldn’t be used, the equilibration time extended to at least 3.0 h.

The sampling method is similar to that in the literature [19]. Briefly, In phase equilibration experiments when sampling from liquid phase (or scCO2 phase), as shown

in Figure 1, valve 2 (or valve 4) was first turned off, and

then valve 1 (or valve 3) was opened until a pressure balance between the sampling tube and the extractor was reached. Afterward, valve 1 (or valve 3) was turned off and valve 2 (or valve 4) slowly opened to depressurize and collect the sample in a flask. The sampling tubes are made of a stainless steel tube with an inner diameter of 4 mm and a length of 50 mm.

The scCO2 extraction experiments were carried in an

intermittent mode. After static extraction at the required temperature and pressure for 30 min or 1.0 h, depending on the cases with or without the absorbents, CO2 effluent

was depressurized into the separator. Then the releasing valve was closed and CO2 was recharged up to the

origi-nal pressure. In this way, the operation ran several times. The CO2 volume was measured by a wet gas meter and

(3)

P Extractor

CO2 reservior CO2 delivering pump Electromagnetic stirrer

PT

Airing

wet gas meter

PT

M

Separator Solvent Water-bath

Sampling tube

[image:3.595.99.506.89.246.2]

Valve 1 Valve 2 Valve 3 Valve 4

Figure 1. Schematic diagram of the experimental setup for supercritical CO2 extraction of simulated/real bio-oil

2.3 Methods of Analysis

The quantitative analysis of simulated bio-oil was ac-quired on a gas chromatography (Varian CP-3800), which was equipped with a 50 m × 0.25 mm × 0.33 μm PEG capillary column. Both the inlet temperature and the detector temperature were fixed at 250℃. Column tem-perature was controlled by a temtem-perature program, which is: starting at 80 ℃ for 1 min, heating to 130℃ at a ramp rate of 10℃/min, followed by heating to 200℃ at a ramp rate of 30℃/min, and finally holding at 200℃

for 8 min. 1-Methoxy-2-propanol was used as an internal standard compound.

For the real bio-oil analysis, both qualitative and quan-titative analyses were carried on a GC-MS system. (GC6890-MS5973N, Agilent Co.)equipped with 60 m × 0.25 mm × 0.25 μm Innowax 19091N-136 capillary col-umn. He was used as carrier gas with a flow rate of 1mL/min and split ratio was 80. Inlet temperature was fixed at 250℃. A ramp temperature program was adopted, which started at 10℃/min from 60℃ to 120℃, then heated at 5℃/min to 200℃, and held at 200℃ for 8 min. All the acquired component compositions were based on area normalization. Water content is determined by Karl-Fischer method [20]. The calorific value was de-termined in a static bomb calorimeter [21].

Distribution coefficient (Di), enrichment coefficient

(Ri) and percentage extraction (Ei) were calculated

ac-cording to the following equation.

i i

i Y D

X

100% i i

i m R

M

 

100% i

m E

M

 

where Yi and Xi depict the mass percentage of

compo-nent i in the extract and in the liquid faffinate after

re-moval of CO2, %; mi and Mi represent the mass of

com-ponent i in the extract and the total mass of component i

in the simulated bio-oil respectively, g; i indicates acetic

acid (AC), propanoic acid (PA), furfural (FR), acety-lacetone (AA) or 2-methoxyphenol (MP); m and M de-scribe the mass of extract and the total mass of bio-oil, g.

3. Results and Discussion

3.1 Two-Phase Distribution of Simulated Bio-Oil Extraction

The effects of CO2 pressure on the components

distribu-tion coefficients between supercritical CO2 phase and

liquid phase was investigated at 45℃ in a pressure range of 7~17 MPa (Figure 2). 24.0 g simulated bio-oil was

used in each experiment.

6 8 10 12 14 16 18

0 1 2 3 4 5 6

Di

P, MPa

Acetylacetone Guaiacol Furfural Acetic acid Propanoic acid

Figure 2. Distribution coefficients of various components in

simulated bio-oil between supercritical CO2 phase and liquid

[image:3.595.310.529.495.667.2]
(4)

Figure 2 shows that the distribution coefficients of

various components were very close to each other at low pressure (low CO2 density). Such a phenomenon might

be caused by the combined effects of vaporization and scCO2 solvating power. Except for MP (b. p. 205℃), the

boiling points at atmosphere of AC (118℃), PA (140.7

℃), FR (162℃) and AA (140.5℃) are relatively close, suggesting they have relatively approximative partial vapor pressures. MP is weak in polarity and readily ex-tracted by nonpolar CO2, where as AC, PA, FR and AA

relatively difficult to be extracted as they are polar com-pounds. As the pressure rising, DAA increased remarkably

from 1.5 to 4, DFR and DMP increased gradually, while

DAC and DPA varied very little. Strong intermolecular

interactions between homogeneous species and hetero-geneous species of acetic, propanoic acid and water, ca-pable of forming hydrogen bonds, might be a good ex-planation. Even under high pressure the polarity of CO2

is still very weak and hard to break up these hydrogen bonds, resulting in difficulty in extraction of AC and PA into supercritical CO2 phase. In contrast, in spite of polar

compounds and capable of forming intermolecular hy-drogen bonds with water, AA and FR cannot form ho-mogeneous intermolecular hydrogen bonds. Conse-quently, they exhibited higher distribution coefficient under high CO2 density than under low CO2 density.

[image:4.595.59.288.509.680.2]

Considering the fact bio-oil typically contains 20~40% water, therefore, hydrogen bonding effect might be bene-ficial to selective isolation or enrichment of some chemicals in supercritical CO2 extraction.

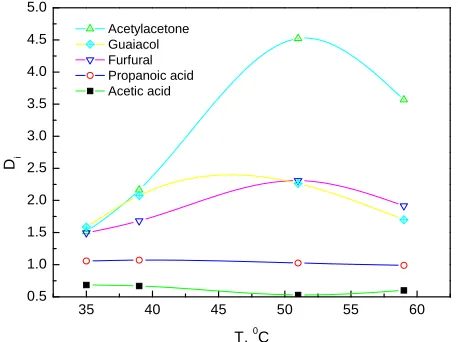
Figure 3 depicts the effect of temperature on the

dis-tribution coefficients in simulated bio-oil at constant pressure of 15.0 MPa. Likewise, 24.0 g simulated bio-oil was used in each experiment.

35 40 45 50 55 60

0.5 1.0 1.5 2.0 2.5 3.0 3.5 4.0 4.5 5.0

Di

T, 0C

Acetylacetone Guaiacol Furfural Propanoic acid Acetic acid

Figure 3. Effect of temperature on distribution coefficients of various components in simulated bio-oil Experimental conditions: 15.0 MPa, 24.0 g simulated bio-oil

In the experimental temperature range of 35~60℃, temperature had very weak effect on DAC and DPA,

around 0.6 and 1.0 respectively. DPA is always bigger

than DAC, indicating polarity played a much more

impor-tant role than partial vapor pressure as the partial vapor pressure of AC is bigger than that of PA at same tem-perature. Low distribution coefficients both for AC and PA are attributed to the formation of hydrogen bond with water. DAA, DFR and DMP increased at the beginning and

then decreased with elevating the temperature. Such an interesting tendency might be related to the CO2 density

because at constant pressure CO2 density decreased and

resulted in a drop in its dissolving powder when raising the temperature. On the other hand, the vapor pressures increased with temperature. As a result, the contents of low boiling point compounds in the extract tend to rise. Acetylacetone has a relative low boiling point and cannot form hydrogen bond with water. For this reason, it is not surprise that DAA showed the most evident temperature

dependence.

Adding absorbents might have also effect on scCO2

extraction, in theory, because it can influence the inter-molecular forces of various species. 5A inter-molecular sieve, activated carbon and silica were chosen as the absorbents. In each experiment, 5.0 g simulated bio-oil was spiked on 20.0 g absorbent. Due to the difficulties in knowing the exact amount of the various components in the ab-sorbents after extraction, enrichment coefficient was used instead of distribution coefficient. Figure 4 shows the

enrichment coefficients at 45℃ and 18.3  0.1 MPa in the presence of various absorbents.

In the presence of absorbent, the interaction force be-tween the component and the absorbent depends on not only the component but also the type and internal texture of the absorbent [22,23]. Competitive adsorption be-tween species occurred on the surface of the absorbent after spiking. For this reason, the intermolecular forces between different components could be changed and thus influence their extractability by supercritical CO2. In

contrast to the case in absence of absorbent, the enrich-ment coefficients of FR, AA and PA declined, whereas those for MP and AC rose. Among all of the five com-pounds, AC is the strongest and MP is the weakest in polarity. All of the other three compounds whose en-richment coefficients declined in the presence of absor-bents are moderate in polarity. Therefore, extraction se-lectivity might be linked to the surface polarity of the absorbents. AA, FR and MP are high value chemicals. Thus it is reasonable to expect much more of these com-pounds could be preferentially extracted into the scCO2

phase. In this context, except for MP, all three adsorbents seemed not to be very satisfying. Therefore, functional-ized adsorbents should be taken into consideration in the future research work.

(5)

AA AC FR PA MP 0.0

0.4 0.8 1.2 1.6 2.0 2.4 2.8 3.2

Ri

without adsorbent 5A molecular sieve Silica

[image:5.595.65.281.82.239.2]

Active carbon

Figure 4. Enrichment coefficients of various components in simulated bio-oil in the presence of adsorbents

Experimen-tal conditions: 45 and 18.3 0.1 MPa, 5.0 g simulated

bio-oil, 20.0 g absorbents

influences both the heat value and combustibility in the internal combustion engines. Effects of extraction pres-sure and temperature on the water content in the extract were also surveyed (Figure 5 and Figure 6).

It can be seen in Figure 5, water content in the extract

decreased with raising the pressure. For example it was 13.28% at 9.4 MPa and dropped drastically to only 5.52% at 18.4 MPa. This was in accordance with the ex-planation in the section of pressure effect on distribution coefficients. The volatility of a compound at low pres-sure is a dominant factor while the dissolving capacity of CO2 becomes dominant at high pressure. High water

content in the extract is attributed to the lowest boiling point and strongest polarity of water among all of the components in the simulated bio-oil.

According to the above explanation, it is expectable to see in Figure 6 that water content in the extract gradually

8 10 12 14 16 18 20

4 6 8 10 12 14

Wa

te

r,

wt

%

P, MPa

Simulated bio-oil

Figure 5. Effect of extraction pressure on the water content

in the extract at 45 Experimental conditions: 45, 5.0 g

simulated bio-oil

30 40 50 60 70 80

5 10 15 20 25 30

W

a

te

r,

wt

%

T, oC

Figure 6. Variation of water content in the extract as a function of extraction temperature under 12.0 MPa pres-sure Experimental conditions: 12.0 MPa, 5.0 g simulated bio-oil

increased with elevating the temperature at 12.0 MPa. At 75℃, the water content could go up to as high as 28.3%. Elevating temperature creates two effects on the extrac-tion: 1) reducing the density of CO2 and thus its

dissolv-ing power, resultdissolv-ing in poorer extraction efficiency when rising the temperature; 2) increasing the saturated vapor pressure of extractable compounds, as a result, leading to higher extraction efficiency. As a compromise, dissolv-ing power of CO2 plays a dominant role at low

tempera-ture, while vapor pressure turns to be a dominant factor at high temperature. Given a fact that the polarity of wa-ter is very strong, its solubility is still very low in CO2

phase even though at low temperature. Therefore, the tendency that the water content increased with tempera-ture is understandable.

3.2 Supercritical CO2 Extraction of a Real Bio-Oil

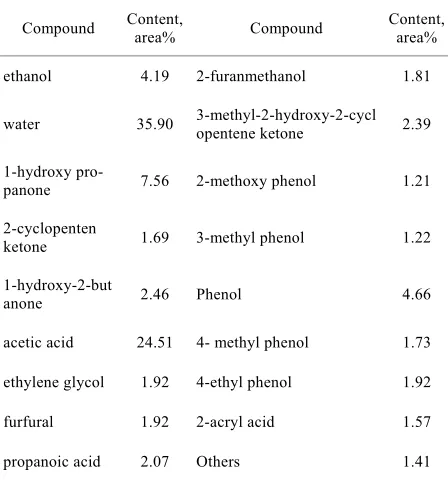
For the extraction of real bio-oil, pyrolysis bio-oil of corn stalk powder was selected and subjected to extraction by supercritical CO2, whose composition acquired by GC-

MS was summarized in Table 1. It could be clearly seen

[image:5.595.308.535.86.259.2]

that large amount of water (35.9%) and organic acids (24.51% acetic acid, 2.07% propanoic acid, 1.57% acryl acid) were contained in the original bio-oil, which were dominantly responsible for the corrosiveness of bio-oils. Phenols which resulted from the pyrolysis of the lignin in corn stalk occupied about 10% in bio-oil, mainly existing in the form of phenol, methyl phenol, methoxy phenol and ethyl phenol. Except for the compounds listed in

Table 1, other kinds of compounds, like saccharides and

[image:5.595.59.285.510.682.2]
(6)
[image:6.595.60.284.102.342.2]

Table 1. Composition of the pyrolysis bio-oil of corn stalk

Compound Content, area% Compound Content, area%

ethanol 4.19 2-furanmethanol 1.81

water 35.90 3-methyl-2-hydroxy-2-cyclopentene ketone 2.39

1-hydroxy

pro-panone 7.56 2-methoxy phenol 1.21

2-cyclopenten

ketone 1.69 3-methyl phenol 1.22

1-hydroxy-2-but

anone 2.46 Phenol 4.66

acetic acid 24.51 4- methyl phenol 1.73

ethylene glycol 1.92 4-ethyl phenol 1.92

furfural 1.92 2-acryl acid 1.57

propanoic acid 2.07 Others 1.41

3.2.1 Changes of Various Categories of Compounds in the Extracts after scCO2 Extraction

For scCO2 extraction of the real bio-oil, 12.0 g bio-oil

was spiked on 30.0 g adsorbents (5A molecular sieve or silica) and then subjected to extraction at 45℃ and 26.0 MPa. Typical profiles for various compound categories were given in Table 2 when the CO2 volume was 50NL

and extraction efficiency was 20%.

Given a fact that the composition of bio-oil varies with the biomass resources, pyrolysis processes, and the op-eration conditions, and most of the compounds in the bio-oil are in very low concentration, our experiments focused on the extractability of various categories of compounds rather than individual compound. Similar to the extraction of simulated bio-oil, intermittent operation mode was used for the extraction of the real bio-oil. The extraction pressure swing range was between 26.0 MPa and 10.0 MPa. All of compounds identified by GC-MS were classified into 8 groups. They are: 1) alcohols in-cluding ethanol, methanol, ethanediol, isobutyl alcohol

furfuryl alcohol, etc; 2) ketones including 2-propanone- 1-hydroxy, 2-cyclopentanone, 1-hydroxy-2-butanone, 2- hydroxy-cyclopentanone, 3-hydroxy-2-butanone, 4-me- thyl-cycloheptanone, acetyl-acetone, furan acetophenone, 2,2-dimethyl-1-propeneketo-1-cyclohexenyl, etc; 3) acids including acetic acid, propanoic acid, butyric acid, vinyl acid, crotonic acid, 9,10-diene stearic acid, etc; 4) phe-nols including 4-ethyl-2-methoxyphenol, 2,5-dimethyl- phenol, 4-methyl phenol, 3-methoxy-phenol, 3-methyl- phenol, 3-methyl-4-ethyl phenol, 4-ethyl phenol, 2,5-di- methyl-phenol, 2,4-dimethyl-3-dimethyl-etherbase-4-me- thoxy-phenol, 2,6-dimethyloxy-phenol, 2-me-thoxy-phe-nol, 2-ethoxy-phe2-me-thoxy-phe-nol, phe2-me-thoxy-phe-nol, etc; 5) aldehydes including furfural, 2-furyl glyoxal, 4-ethoxy-benzaldehyde, 3-hy- droxy-4-methoxybenzaldehyde, etc; 6) esters including methyl acetate, 4-methyl-amyl methyl ester, 1-propylene glycol acetate, 2-methyl ethylene, etc; 7) water, and 8) the others which refer to all compounds which were de-tectable by GC but unidentified by MS.

It has been reported that hundreds of compounds might be contained in bio-oils. However, for our original bio-oil only 17 compounds could be identified by GC- MS analysis. Besides the nonvolatile compounds, there were still a variety of compounds whose contents were so low that they couldn’t be detected out by the GC-MS. After scCO2 extraction the compound species detected in

the extract rose up to 80, suggesting that scCO2

extrac-tion can be used as a useful pretreatment tool for qualita-tive and quantitaqualita-tive analysis of bio-oils. Table 2 shows

the enrichment of all categories of compounds when the extraction efficiencies on water-free basis were about 20%.

Compared with the original bio-oil, there was only a little change of alcohols in the extract fraction after ex-traction which might be attributed to the low content al-cohols in original bio-oil. Water content decreased sig-nificantly, about one fifth of that in the original bio-oil (35.90%) suggesting that scCO2 extraction was very

[image:6.595.59.538.620.720.2]

ef-fective in reducing the water content and thus boosting up the heat value of bio-oil. The total ketones in bio-oil increased from 14.1% to 21.15~25.40%, phenols from 10.74% to 31.32~41.25%, aldehydes from 1.92% to 3.95~8.46%, while the acids were significantly reduced from 28.15% to 6.92~12.32%. These tendencies are in

Table 2. Typical profiles for various categories of compounds in the extracts after scCO2 extraction

Treatment condition Alcohols Water Ketones Acids Phenols Aldehydes Esters Others

Original bio-oil 7.92 35.90 14.1 28.15 10.74 1.92 0 1.41

Without adsorbent 2.55 6.64 21.15 11.98 35.22 3.95 1.84 18.41

5A molecular 7.03 5.28 25.40 12.32 31.32 3.99 1.76 12.91

Silica gel 4.81 4.91 21.99 6.95 41.25 8.46 1.35 8.55

(7)

accordance with the experimental results of the simulated bio-oil.

In summary, although the selectivity differed from one compound to another, depending on the types of absor-bents, water and acids can be greatly reduced after scCO2

extraction, indicating significant heat value increment and corrosiveness reduction (lower pH) from the view-point of upgrading bio-oil. In addition, selective extrac-tion or enrichment of high value-added chemicals might be probable by selecting appropriate adsorbent.

3.2.2 Effect of Pressure on Extraction Efficiency

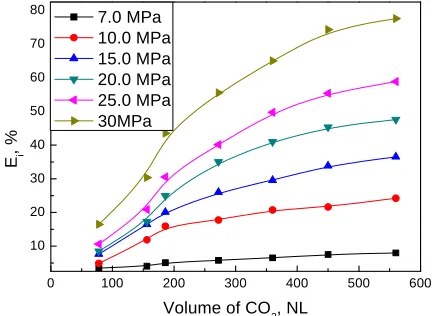
Effect of pressure on extraction of real bio-oil was stud-ied at fixed temperature of 45℃. Figure 7 shows the

pressure dependence as a function of CO2 consumption in

standard volume, NL. In each experiment, 30.0 g original bio-oil was used.

As shown in Figure 7, extraction pressure had

strongly positive influence on the extraction efficiency of real bio-oil. The higher the extraction pressure at same CO2 volume, the higher extraction efficiency was. When

the CO2 volume was 560 NL, for example, extraction

efficiencies of the bio-oil were respectively 8.00% at 7.0 MPa, 24.20% at 10.0 MPa, 36.53% at 15.0 MPa, 47.59% at 20.0 MPa, 58.85% at 25.0 MPa and 77.58% at 30.0 MPa. Since the dissolving power of CO2 mainly

de-pended on by its density and was tunable by modifying the pressure, it is easy to understand the pressure effect on extraction efficiency. In addition, pressure also affects the polarity of CO2. The polarity of scCO2 has been

firmed to be increased with elevating the pressure at con-stant temperature. Therefore, the composition of various compounds in the extraction fraction varied with the pressure. It is reasonable to expect that the compounds with weak polarity are preferentially extracted at low pressure since CO2 is a nonpolar compound, while the

compounds with strong polarity can be extractable at

0 100 200 300 400 500 600 10

20 30 40 50 60 70 80

Ei

, %

Volume of CO2, NL 7.0 MPa

10.0 MPa 15.0 MPa 20.0 MPa 25.0 MPa 30MPa

Figure 7. Extraction efficiency of bio-oil as a function of

CO2 volume under different pressure Experimental

condi-tions: 45℃, 30.0 g bio-oil

high pressure although their solubility in scCO2 might

still be very low. According to this, the solubility of wa-ter in scCO2 phase should also be increased. However,

the experimental results showed that the water content in the extract decreased with elevating the pressure at con-stant temperature. To explain this, the competitive ex-traction between various compounds and the phase be-havior in such a complicated system need to be taken into account.

3.2.3. Effect of Temperature

The effect of extraction temperature on extraction effi-ciency of bio-oil was surveyed at 30.0 MPa using 30.0 g bio-oil. Figure 8 shows the variation of extraction

effi-ciency at different temperature as a function of CO2

volume.

Extraction temperature didn’t show remarkable impact on the extraction efficiency in the experimental tempera-ture range of 45~65℃. As discussed in Subsection 3.1, temperature in scCO2 extraction has two adverse effects.

Therefore, it is not surprised to see that the extraction conducted at 55℃ afforded the highest extraction effi-ciency, which might be a compromise of these two ef-fects.

It is well known that modified CO2 using low

molecu-lar weight organic compounds like methanol or acetic acid, has been shown to be more powerful in extracting polar substances than pure CO2. Considering that ethanol

and methanol are available from conversion of biomass and can be used directly as engine fuels, they were em-ployed in the investigation of the impacts of modifiers on the extraction. When performing the experiment, certain amount of methanol or ethanol was directly poured into 30.0 g bio-oil. The experimental results at constant con-sumption of CO2, 156NL, showed that extraction

effi-ciency could be increased about 20% and 10% respec tively compared to the case without modifiers when 3.0 g

0 100 200 300 400 500 600 10

20 30 40 50 60 70 80 90

Ei

,%

Volume of CO2,NL 45oC

[image:7.595.62.280.522.680.2]

55oC 65oC

Figure 8. Temperature dependence of bio-oil extraction

efficiency as a function of CO2 volume at 30MPa

[image:7.595.314.529.522.680.2]
(8)

modifier was used in 30.0 g bio-oil. Evidently, methanol is more eligible as a modifier than ethanol in enhancing the dissolving power of scCO2. It should be cautious that,

however, the water content in the extract was significant higher when excess methanol was used than that in the case of pure CO2 extraction.

3.2.4 Property Comparison between Original Bio-Oil and Extracted Oil

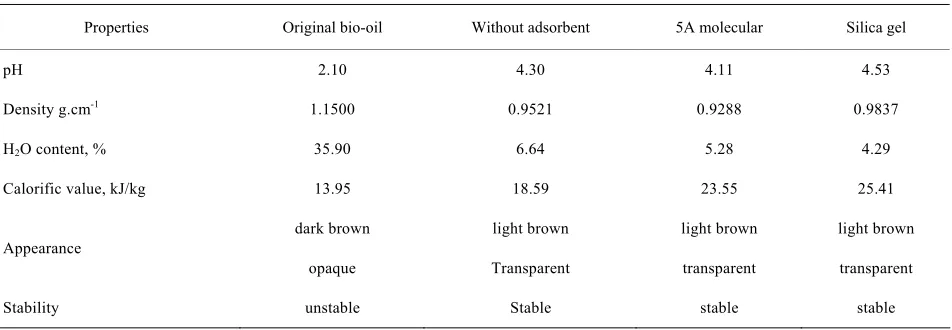
One can see that in Table 3, pH value increased from

2.10 to 4.1~4.5 and the calorific value from 13.95 to 18.59~25.41 kJ/kg in different treatment cases, while the density decreased from 1.15 to 0.92~0.98 and the mois-ture from 35.9% to 4.29~6.64%. The stability of the bio-oils was judged by after 6 month storage under room temperature to observe whether phase splitting or no-ticeable change in viscosity occurred. The original bio- oil was dark brown opaque liquid with high viscosity, increased noticeably in viscosity, and phase splitting happened after storage, while the extracts from scCO2

extraction were light brown transparent liquids with rela-tively low viscosities and hadn’t noticeable changes in viscosity and phase splitting, implying relatively high stability.

3.2.5 Bio-oil Volatility

Volatility is vital in evaluating transport fuels since it relates to the atomization and combustion performance. To estimate the volatility of bio-oil, 2.0 g bio-oil was accurately weighed and allowed to temperature pro-grammed evaporating in an open dish in air drying oven. The mass variation was determined by analytical balance. The extract and the faffinate used were obtained from the scCO2 extraction under 35℃ and 30.0 MPa with

extrac-tion efficiency of 88.6% (water-free basis). Figure 9

shows temperature dependence of bio-oil volatility as a function of evaporation time.

As shown in Figure 9, the extract fraction showed

evi-dently higher in volatility than the original bio-oil, while

the faffinate showed significantly lower. For example, at 60℃ for 15 min, the volatility percentages of original bio-oil, extract and faffinate were 50.32%, 68.98% and 45.34%, respectively. When elevating temperature to 140

℃, more than 97.69% of extract became volatile, whe- reas only 89.56% and 83.92% for original bio-oil and faffinate. If taking the fact that most of water was left in the faffinate into account, the volatility experiments strongly suggested that the quality upgrading of the ex-tract faction in view of potential application in combus-tion engine since the nonvolatile compounds were mainly left in the faffinate after extraction.

4. Conclusions

Supercritical CO2 extraction was an effectively powerful

tool in separation and upgrading of bio-oil. By adjust-ment of operation temperature, pressure, and using ab-sorbents, weakly polar compounds are capable of selec-tive separation and enrichment into scCO2 phase. The

0.0 0.5 1.0 1.5 2.0 2.5 3.0 0

20 40 60 80 100

Volatility per

cen

tag

e, %

Time, h

Original bio-oil Extract Faffinate

140oC 120o

C 100o

C 80o

C 60oC

[image:8.595.309.537.330.495.2]

Figure 9. Variation of volatile as a function of time at dif-ferent temperatures

Table 3. Properties of bio-oil and extracts at different conditions

Properties Original bio-oil Without adsorbent 5A molecular Silica gel

pH 2.10 4.30 4.11 4.53

Density g.cm-1 1.1500 0.9521 0.9288 0.9837

H2O content, % 35.90 6.64 5.28 4.29

Calorific value, kJ/kg 13.95 18.59 23.55 25.41

dark brown light brown light brown light brown Appearance

opaque Transparent transparent transparent

Stability unstable Stable stable stable

[image:8.595.62.538.555.720.2]
(9)

adsorbent can affects the intermolecular forces between different components. Therefore, valuable chemicals might be expected to be isolated from bio-oil by selecting appropriate adsorbent. High extraction pressure and rela-tive low extraction temperature favor in effecrela-tively re-ducing the water content in extracted bio-oil. Extraction efficiency of real bio-oil increased with raising the pres-sure. The maximum extraction efficiency of supercritical CO2 extract bio-oil reached to 88.6% on water-free basis

at 30.0 MPa and 35℃. After scCO2 extraction,thequality

of bio-oil can be improved significantly from the view-point of water content reduction, acidity, calorific value, stability and appearance. Water content could be reduced to one fifth of that of original bio-oils. Calorific value could increase to be doubled. pH value went up from 2.1 to above 4.1. The extract fraction showed nearly 100% volatility below 140℃ since most of the nonvolatile compounds was left in the faffinate.

5. Acknowledgements

This research is financial supported by Natural Science Foundation of Shandong Province (Grant No. ZR2009 BL023) and National High Technology Plan (863) Pro-ject No. 2009AA05Z401 Granted by the Ministry of Science and Technology of the People’s Republic of China.

REFERENCES

[1] M. Baratieri, P. Baggio, L. Fiori and M. Grigiante, “Bio-mass as an Energy Source: Thermodynamic Constraints on the Performance of the Conversion Process,”

Biore-source Technology, Vol. 99, No. 15, 2008, pp. 7063-

7073.

[2] J. L. Zheng and W. M. Yi, N. N. Wang, “Bio-Oil Produc-tion From Cotton Stalk,” Energy Conversion and

Man-agement, Vol. 49, No. 6, 2008, pp. 1724-1730.

[3] A. V. Bridgwater and G. V. C. Peacocke, “Fast Pyrolysis Processes for Biomass,” Renewable and Sustainable

En-ergy Reviews, Vol. 4, No. 1, 2000, pp. 1-73.

[4] C. David, O. Anja and S. Yrjö, “Power Generation Using Fast Pyrolysis Liquids from Biomass,” Renewable and

Sustainable Energy Reviews, Vol. 11, No. 6, 2007, pp.

1056-1086.

[5] A. V. Bridgwater, D. Meier and D. Radlein, “An Over-view of Fast Pyrolysis of Biomass,” Organic Geochemis-try, Vol. 30, No. 12, 1999, pp. 1479-1493.

[6] M. Peter, “Energy Production from Biomass (Part 2): Conversion Technologies,” Bioresource Technology, Vol.

83, No. 1, 2002, pp. 47-54.

[7] Q. Lu, W. Z. Li and X. F. Zhu, “Overview of Fuel Prop-erties of Biomass Fast Pyrolysis Oils,” Energy

Conver-sion and Management, Vol. 50, No. 5, 2009, pp. 1376-

1383.

[8] T. A. Milne, F. Agblevor, M. Davis, et al., “A Review of

Chemical Composition of Fast Pyrolysis Oils,” In: A. V. Bridgwater, Ed., Developments in Thermochemical

Bio-mass Conversion, London, Blackie Academic &

Profes-sional, 1997, pp. 409-424.

[9] V. A. Yakovlev, S. A. Khromova, O. V. Sherstyuk, et al., “Development of New Catalytic Systems for Upgraded Bio-Fuels Production from Bio-Crude-Oil and Biodiesel,”

Catalysis Today, Vol. 144, No. 3-4, 2009, pp. 362-366.

[10] Y. Xu, T. J. Wang, L. L. Ma, et al., “Upgrading of Liquid

Fuel from the Vacuum Pyrolysis Of Biomass over the Mo–Ni/γ-Al2O3 Catalysts,” Biomass and Bioenergy, Vol.

33, No. 8, 2009, pp. 1030-1036.

[11] L. Garcia, R. French, S. Czernik, et al., “Catalytic Steam Reforming of Bio-Oils for the Production of Hydrogen: Effects of Catalyst Composition,” Applied Catalysis A:

General, Vol. 201, No. 2, 2000, pp. 225-239.

[12] I. Michio, S. Maria and H. Ed, “Emulsification of Pyroly-sis Derived Bio-Oil in Diesel Fuel,” Biomass and

Bio-energy, 2003, Vol. 24, No. 3, pp. 221-232.

[13] Y. Xu, J. Chang, Q. Zhang, et al., “Upgrading of Bio-Oil

by Esterification over Solid Base Catalyst,”

Petrochemi-cal Technology, Vol. 35, No. 1, 2006, pp. 615-618.

[14] F. Mahfud, H. Melia′n-Cabrera, I. R. Manurung and H. J. Heeres, “Upgrading of Flash Pyrolysis Oil by Reactive Distillation Using a High Boiling Alcohol and Acid,”

Trans IChemE, Part B, Process Safety and Environmental

Protection, Vol. 85, No. B5, 2007, pp. 466-472.

[15] B. Tuya, M. Chaala, C. R. Garcia-Perez, et al., “Colloidal

Properties of Bio-Oils Obtained by Vacuum Pyrolysis of Softwood Bar Characterization of Water-Soluble and Water-Insoluble Fraction,” Energy Fuels, Vol. 18, No. 3,

2004, pp. 704-712.

[16] J. Peng, P. Chen, H. Lou and X. M. Zheng, “Catalytic Upgrading of Bio-Oil by HZSM-5 in Sub- and Su-per-Critical Ethanol,” Bioresource Technology, Vol. 100,

No. 13, 2009, pp. 3415-3418.

[17] H. H. A. Hussain, “Supercritical Hexane Extraction: a New Solvent System for Extracting Bio-Oil,” Division of

Fuel Chemistry, Vol. 53, No. 2, 2008, pp. 862-864.

[18] P. K. Rout, M. K. Naik, S. N. Naik, et al.,“Supercritical

CO2 Fractionation of oil Produced from Mixed Bio-mass of Wheat and Wood Sawdust,” Energy & Fuels, Vol.

23, No. 12, 2009, pp. 6181-6188.

[19] H. Y. Cui, T. Wang, F. J. Wang, et al., “Kinetic Study on

One-pot Synthesis of Dimethyl Carbonate in Supercritical CO2 Conditions,” Industrial & Engineering Chemistry

Research, Vol. 43, No. 24, 2004, pp. 7732-7739.

[20] H. Wang, R. H. Liu, C. M. Zhang and J. D. Luan, “An Experimental Study on Determination of the Water Con-tent in Bio-Oil by Karl-Fischer Titration,” Renewable

Energy, Vol. 3, No. 1, 2005, pp. 17-20.

[21] C. M. Jiao and F. He, “Heating Value Determination of Liquid Product from Corn Stalk Pyrolysis,” Journal of

Shandong University of Technology, Vol. 20, No. 2, 2006,

pp. 11-13.

(10)

Natural Organic Matter on Powdered Activated Carbon Adsorption of Trace Contaminants: Characteristics and Mechanism of Competitive Adsorption,” Water Research,

Vol. 37, No. 18, 2003, pp. 4413-4424.

[23] C. Pelekani and V. L. Snoeyink, “Competitive Adsorption between Atrazine and Methylene Blue on Activated Car-bon: The Importance of Pore Size Distribution,” Carbon,

Figure

Figure 1. Schematic diagram of the experimental setup for supercritical CO2 extraction of simulated/real bio-oil
Figure 3 depicts the effect of temperature on the dis-tribution coefficients in simulated bio-oil at constant pressure of 15.0 MPa
Figure 4. Enrichment coefficients of various components in simulated bio-oil in the presence of adsorbents Experimen-
Table 1. Composition of the pyrolysis bio-oil of corn stalk
+3

References

Related documents

Remark 5.1: Setting c¯ ≡ c† the representations given in Theorem 5.1 delineate the asymptotic local power functions for nominal 100 α % level tests of the pseudo-GLS detrended

Biological Sciences is commended for the work that has been undertaken to audit and embed graduate attributes within the curriculum and for the clear mapping of graduate attributes

At the conclusion of this initial evaluation, the patient complaining of constipation can be tentatively diagnosed as having (1) IBS, when pain and the other features of IBS

coli strains; the influence of several parameters of river water quality on potentially effective UV treatments and AOPs; the potential of laboratory-scale (LP)

1) Verify that all operators and maintenance personnel have read and understand all operating and safety information. 2) Verify that equipment has been assembled and installed

The study puts forth the definition of liveability at the level of residential streets in Shanghai through six liveability qualities: ‘the Local Humanized Environment’,

Past access-based innovations can serve as models that should make us optimistic about the feasibility of this article’s proposals. We should develop a framework for a system

During this portion of the study, we examine the effect that lowering the threshold number of flow contributing cells required to distinguish between channel and overland flows has