https://www.scirp.org/journal/ojf ISSN Online: 2163-0437
ISSN Print: 2163-0429
DOI: 10.4236/ojf.2019.94017 Sep. 29, 2019 296 Open Journal of Forestry
Soil Trafficability Forecasting
Marie-France Jones, Paul Arp
*Faculty of Forestry and Environmental Management, University of New Brunswick, Fredericton, Canada
Abstract
This article introduces and evaluates a Soil Trafficability Model (STRAM) de-signed to estimate and forecast potential rutting depth on forest soils due to heavy machine traffic. This approach was developed within the wood-forwarding context of four harvest blocks in Northern and Central New Brunswick. Field measurements used for model calibration involved determining soil rut depths, volumetric moisture content, bulk density, soil resistance to cone pe-netration (referred to as cone index, or CI), and the dimensionless nominal soil cone index (NCI) defined by the ratio of CI over wheel foot print pres-sure. With STRAM, rut depth is inferred from: 1) machine dimensions per-taining to estimating foot print area and pressure; 2) pore-filled soil moisture content and related CI projections guided by year-round daily weather records using the Forest Hydrology Model (ForHyM); 3) accounting for within-block soil property variations using multiple and Random Forest re-gression techniques. Subsequent evaluations of projected soil moisture, CI and rut-depth values accounted for about 40 (multiple regression) and 80 (Random Forest) percent of the corresponding field measured values.
Keywords
Soil Trafficability, Wood Forwarding, Plot Surveys, Regression Comparisons, Cartographic Depth-to-Water
1. Introduction
With the wide-spread use of modern mechanized harvest machinery, forest and agricultural planners have to deal with the effects of heavy machine loads on soil rutting, compaction, erosion, and subsequent reductions in crop yields (Brady & Weil, 2008). Increased soil compaction reduces soil porosity, increases soil ru-noff, damages and crushes roots, and leads to reduced root growth due to de-creased soil oxygen levels (Grigal, 2000; Horn et al., 2004; Bassett et al., 2005;
How to cite this paper: Jones, M.-F., & Arp, P. (2019). Soil Trafficability Forecast-ing. Open Journal of Forestry, 9, 296-322.
https://doi.org/10.4236/ojf.2019.94017
Received: July 12, 2019 Accepted: September 26, 2019 Published: September 29, 2019
Copyright © 2019 by author(s) and Scientific Research Publishing Inc. This work is licensed under the Creative Commons Attribution International License (CC BY 4.0).
DOI: 10.4236/ojf.2019.94017 297 Open Journal of Forestry Singer & Munns, 2006; Chen & Weil, 2011). Rutting results from combined soil compaction and soil displacement. Soil displacement occurs when soils within depressions and along slopes are moist to wet at or above field capacity (Raper, 2005; Naghdi et al., 2009). Depending on their slope orientations, ruts increase, decrease, or collect run-off (Sutherland, 2003; Antille & Godwin, 2013; Poltorak et al., 2018).
A measure of soil resistance to penetration, known as cone index (CI), is used to assess soil compaction and rutting. This measure varies from weak to strong as soil moisture content decreases, and this is particularly so in fine-textured soils. In contrast, sandy soils remain friable from wet to dry (Earl, 1997; Vaz, 2003; Dexter et al., 2007; Tekeste et al., 2008; Vaz et al., 2011; Kumar et al., 2012; Jones & Arp, 2017).
To comply with best forest management practices, various jurisdictions have established criteria as to what constitutes a rut. For example, the Province of British Columbia (Canada) classifies ruts > 15 cm deep to be a hazardous dis-turbance. The Pacific Northwest region of the USA defines ruts to be >15 cm deep as well (Page-Dumroese et al., 2000). The Province of Alberta considers any soil disturbance tracking deeper than 10 cm as ruts (Alberta Forest Prod-ucts Association, 1994; Van Rees, 2002). A visual representation of minor to severe soil disturbance classes including rut depths is provided in Figure A1.
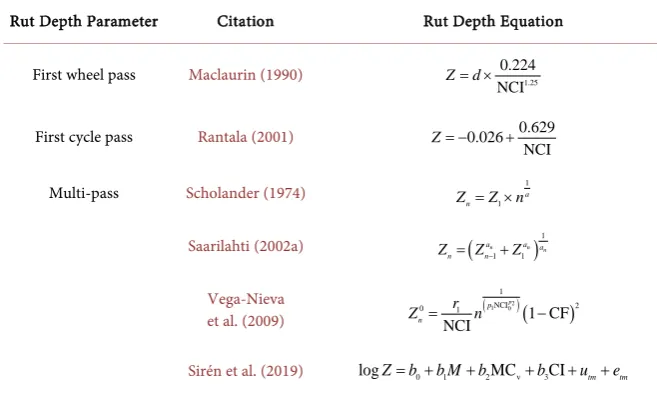
[image:2.595.208.537.492.689.2]Earlier rut-depth prediction models by Maclaurin (1990) and Rantala (2001) related rut depth as caused by single wheel and single machine passes to the ratio of tire footprint pressure over soil resistance to penetration, also referred to as nominal cone index, or NCI (Table 1). Scholander (1974) and Saarilahti (2002a) extended this approach towards multiple passes. Vega-Nieva et al. (2009) mod-ified the NCI-based multi-pass regression model by examining the experimental
Table 1. Select rut depth models.
Rut Depth Parameter Citation Rut Depth Equation
First wheel pass Maclaurin (1990) 1.25
0.224 NCI
Z= ×d
First cycle pass Rantala (2001) 0.026 0.629
NCI
Z= − +
Multi-pass Scholander (1974) 1
1
a n
Z =Z×n
Saarilahti (2002a)
(
)
11 1
n n n
a a a
n n
Z = Z− +Z
Vega-Nieva
et al. (2009) ( )
(
)
2
1 0
1
NCI 2
0 1 1 CF
NCI
p p n
r
Z = n −
Sirén et al. (2019) logZ= +b0 b M1 +b2MCv+b3CI+utm+etm
D = wheel diameter; CI = cone index; n = number of passes; NCI = nominal cone index; CF = coarse frag-ment; M = pass-cumulative machine mass; a, an, b1, b2, b3, p1, p2 = multi-pass coefficients; r1 = site specific
DOI: 10.4236/ojf.2019.94017 298 Open Journal of Forestry data for a sandy soil and a clay loam soil at varying moisture contents, and with a wood-forwarding rut-depth data by Meek (1996) suggestion to correct for coarse fragment content. A recent study by Sirén et al. (2019) related rut depth to number of machine passes, volumetric soil moisture content, and CI. All these studies, however, captured only a small portion of field-determined rut depth variations whether based on fixed or fixed plus random effects regression mod-els.
This article reports on the extent of improving wood-forwarding rut-depth modelling based on:
1) Using field-determined data for soil density, texture, organic matter, coarse fragment and weather-inferred ridge-to-valley soil moisture, CI, and machine-specific NCI variations for the rut-depth projection purpose.
2) Employing fixed and random forest regression techniques for optimizing these projections.
3) Selecting four of the eleven harvest blocks described in Jones and Arp (2019) for detailed analysis; this involved assessing wood-forwarding tracks across two shelterwood cutting blocks and across two commercial thinning blocks in Northern and Central New Brunswick, Canada.
2. Study Locations, Materials and Methods
2.1. Block Descriptions
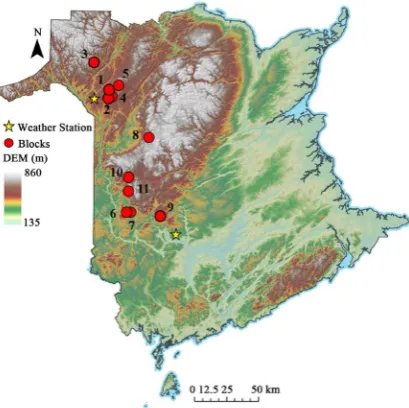
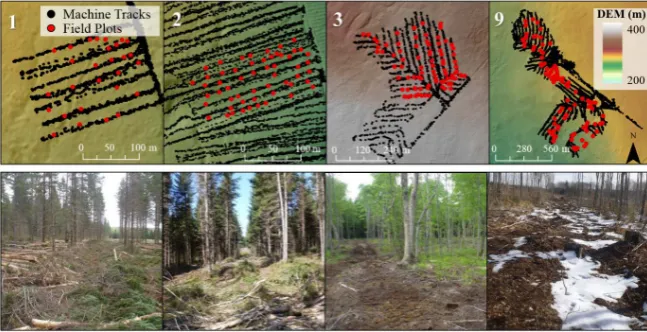
[image:3.595.271.476.475.679.2]Details regarding the wood-forwarding operations within the four harvest blocks chosen for this study are presented in Figure 1 & Figure 2 by location, and in Table 2 by block-specific attributes. These blocks are a subset of the 11 blocks used by Jones and Arp (2019) for their on- and off-track soil moisture and CI study.
DOI: 10.4236/ojf.2019.94017 299 Open Journal of Forestry Figure 2. Plot-specific machine tracks (top) and photos (bottom) for Blocks 1, 2, 3, and 9.
Table 2. Block descriptions: geographical location, forest type, elevation, slope, aspect, soil association, and plot determination counts for MC, CI, and rut depths.
Block Lat/Long Coord. Operation Date Sample MC/CI Date
Rut Sample
Date
Forest
Type1 SpeciesTree 2 Operation3Association Soil Elevation (m) Slope (˚) Aspect (˚) MC/CI Plots Plots Rut
1 67˚37'27.102''W 5/2014 27/5/2014 21/10/2014 SWPL 47˚15'4.071''N WS CT Victoria 267 2.5 158 56 29
2 47˚14'21.825''N 67˚37'26.918''W 6/2014 21/10/2014 21/10/2014 SWPL WS CT Victoria 265 3.4 112 28 40
3 47˚32'23.622''N 67˚47'46.291''W 6/2014 11/6/2014 20/10/2014 IntHW BI/RM SHW Glassville 351 4.6 189 80 75
4 47˚14'59.254''N 67˚37'18.822''W 5/2014 12/6/2014 - SWPL BS CC McGee 280 3.1 127 46 -
5 47˚18'20.725''N 67˚31'42.636''W 7/2014 15/7/2014 - SWPL WS CT Glassville 388 9.1 149 33 -
6 47˚12'15.037''N 67˚14'17.548''W 6/2014 4/6/2014 - MW EH/YB/M SC Jacquet River 210 4.6 148 26 -
7 46˚12'24.987''N 67˚15'55.072''W 6/2014 4/6/2014 - MW EH/YB/M SC Jacquet River 203 5.5 158 43 -
8 46˚42'51.411''N 67˚3'38.865''W 6/2014 19/6/2014 - TolHW SM/YB SHW Juniper 418 4.5 140 54 -
9 46˚10'42.560''N 66˚56'30.534''W 10/2014 20/8/2014 19/11/2014 TolHW SM/YB CC Long Lake 277 2 182 24 63
10 46˚26'23.956''N 67˚15'24.656''W 9/2012 19/6/2013 - TolHW SM/YB SHW Popple Depot 422 8.9 185 147 -
11 46˚20'44.440''N 67˚15'1.278''W 10/2012 25/6/2013 - TolHW SM/YB SHW Kingston 319 9.6 214 159 -
1SWPL: softwood plantation, IntHW: intolerant hardwood, MW: mixedwood, TolHW: tolerant hardwood. 2BS: black spruce; WS: white spruce, BI: birch,
[image:4.595.62.535.303.701.2]DOI: 10.4236/ojf.2019.94017 300 Open Journal of Forestry Blocks 1 and 2 are within 1 km of each other, and share similar site characte-ristics. They are located within the Western reach of the Chaleur uplands. Both blocks are white spruce (Picea glauca (Moench) Voss) plantations. Block 1 cov-ers a two hectare area. Block 2 covcov-ers 20.8 ha, but was sampled acrossa 3.5 ha area. The region has a mean annual temperature of 3.8˚C, with mean January and July temperatures at −11.5˚C and 18.2˚C, respectively. Mean annual preci-pitation amounts to 1110 mm, with 300 mm as snow (Department of Environ-ment and Climate Change Canada, 2016a). Surficial deposits vary from morainal sediments to loamy lodgment tills, underlain by late Ordovician marine clastics.
Block 3 is a 20.9 ha shelterwood cut located in the southern reach of Notre Dame Mountains, within the Appalachians Mountain range. The area has a mean air temperature of 3.5˚C, with mean January and July temperatures at −12.9˚C to 17.6˚C, respectively. It has a mean precipitation of 1140 mm, with 310 mm as snow (Department of Environment and Climate Change Canada, 2016a). This block supports moderate to intolerant hardwood/mixedwood vege-tation, mostly composed of red maple (Acer rubrum L.), yellow birch (Betula al-leghaniensis Britt.) and balsam fir (Abies balsamea L.). Bedrock formations in-volve late Ordovician deep-water marine clastics, with topography ranging from gentle, rolling plateaus to steep valleys of hummocky ablation moraines.
Block 9 is a 25.5 ha shelterwood cut located in the Southern tip of the Mira-michi highlands, roughly 50 km northwest from the Fredericton, the provincial capital for New Brunswick. The area has a mean air temperature of 5.5˚C, with mean January and July temperatures at −9.4˚C and 19.4˚C, respectively. Mean annual precipitation amounts to 1100 mm, with 250 mm as snow (Department of Environment and Climate Change Canada, 2016a). This block supports natu-ral mixedwood and tolerant hardwoods, including Eastern hemlock (Tsuga ca-nadensis L. Carrire), yellow birch, sugar maple (Acer Saccharum Marsh.), beech (Fagus grandifolia Ehrh.), balsam fir, Eastern white cedar (Thuja occidentalis L.), and black spruce (Picea mariana Mill). Surficial deposits vary from morainal sediments to ablation and boulder tills, underlain by early Devonian mafic vol-canic rock and late Ordovician marine clastics.
2.2. Wood Forwarding
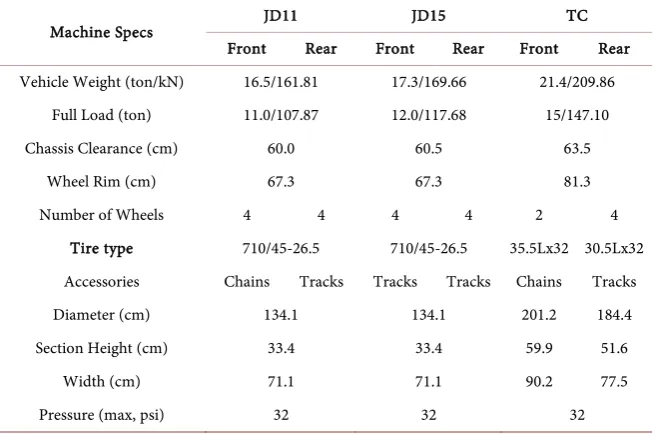
DOI: 10.4236/ojf.2019.94017 301 Open Journal of Forestry Table 3. Machine specifications(Jones et al., 2018).
Machine Specs JD11 JD15 TC
Front Rear Front Rear Front Rear
Vehicle Weight (ton/kN) 16.5/161.81 17.3/169.66 21.4/209.86
Full Load (ton) 11.0/107.87 12.0/117.68 15/147.10
Chassis Clearance (cm) 60.0 60.5 63.5
Wheel Rim (cm) 67.3 67.3 81.3
Number of Wheels 4 4 4 4 2 4
Tire type 710/45-26.5 710/45-26.5 35.5Lx32 30.5Lx32
Accessories Chains Tracks Tracks Tracks Chains Tracks
Diameter (cm) 134.1 134.1 201.2 184.4
Section Height (cm) 33.4 33.4 59.9 51.6
Width (cm) 71.1 71.1 90.2 77.5
Pressure (max, psi) 32 32 32
lower tire footprint areas due to increasing tire pressure increases rutting (Raper et al., 1995; Saarilahti & Antilla, 1999; Saarilahti, 2002b; Jun et al., 2004; Affleck, 2005; Sakai et al., 2008).
2.3. Data Sources
The data needed to process the temporal and spatial modelling of MC, CI, and soil rutting refer to:
1) Daily precipitation (snow and rain) and mean air temperature data, needed for the hydrological soil moisture calculations for Blocks 1-3 and Block 9. These data were obtained from the airport weather station records at Saint Leonard and Fredericton, respectively (Department of Environment and Climate Change Canada, 2016a).
2) Hydrometric stream discharge data, needed to calibrate ForHyM. These data were obtained for Blocks 1 - 3 from the nearby Black Brook Watershed Re-search Site (2014), and for Block 4 from the Nashwaaksis stream data (Depart-ment of Environ(Depart-ment and Climate Change Canada, 2016b).
3) LiDAR-generated bare-earth elevation data. These were downloaded from geoNB’s website at 1 m resolution (GeoNB, 2015).
4) Digital soil maps (DSM layers) for soil texture (sand, silt and clay content), bulk density, coarse fragments, and soil organic matter for top 30 cm of soil, at 10 m resolution (Furze, 2019).
5) GPS-recorded machine-clearance pattern, spaced at 10 sec intervals along each wood-forwarding track. The generation of these data was described by Jones et al. (2018).
2.4. Field Measurements
read-DOI: 10.4236/ojf.2019.94017 302 Open Journal of Forestry ings were obtained from the top 15 cm layer of undisturbed mineral soil across Blocks 1 to 11 after wood forwarding (Table 2) in the fall of 2014, as described in Jones and Arp (2019). The samples were analyzed for texture (sand, silt and clay %), coarse fragments (%), organic matter content (%), and bulk density (g/cm3). Wood-forwarding rut depths were determined at GPS-recorded
inter-vals along the tracks. The number of passes along the tracks were obtained from the GPS-tracked wood-forwarding machine-clearance records (Jones et al., 2018) through counting the number of passes per same track using digital point buffering and overlapping tools (Buja, 2012).
2.5. Soil Moisture Modelling
The Forest Hydrology Model ForHyM was used to estimate daily variations in pore-filled soil moisture content (MCPS) on the well-drained soils in each block
(Appendix). The MCPS output so generated served to determine how MCPS
would have varied at the time of wood forwarding across the terrain of each block by way of season- and weather-adjusted cartographic depth-to-water (DTW) modelling (Murphy et al., 2009, 2011; White et al., 2012).
The cross-terrain MCPS projections were originally based on (Vega-Nieva et
al., 2009; Jones & Arp, 2019):
(
)
(
)
PS,DTW PS,top
top
1 exp DTW
MC 100 100 MC
1 exp DTW
mc p mc mc k k − − = − − × − −
(1)
where MCPS,top refers to the pore-filled soil moisture content, DTWtop refers to at
the highest elevation in each block, kmc and pmc are block-specific calibration
pa-rameters, with MCPS,DTW = 100% along water-filled flow channels where DTW =
0 m. The MCPS,DTW projections inside and outside wood-forwarding tracks were
augmented via multiple regression analysis to account for changes in elevation, forest cover type (hardwoods, softwood, open areas), and soil organic matter content (OMDSM), as follows:
PS PS,DTW 10 FIA DSM
2
MC 70.88 0.26MC 2.76 log DTW 0.98OM
0.10DEM 10.22HW 4.09Track; R 0.46
= + − −
− + + = (2)
with log10DTWFIA referring to the logarithm of the rasterized depth-to-water
in-dex adjusted to the upslope flow initiation area (FIA) at the time of wood for-warding. In addition, OMDSM is the digitally derived soil organic matter raster
(Furze, 2018; in %), DEM is elevation in meters, Track = 1 for ruts and 0 other-wise, and HW = 1 refers to locations dominated by hardwood, otherwise HW = 0. The values of model parameters required for Equations (1) and (2) are listed in Table 4.
2.6. Cone Index and Rut Depth Modelling
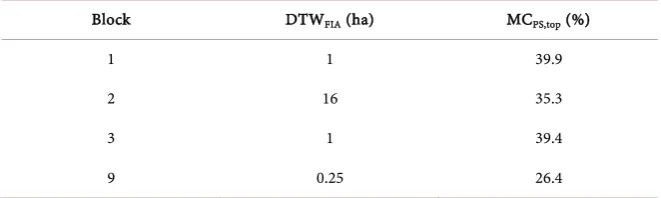
DOI: 10.4236/ojf.2019.94017 303 Open Journal of Forestry Table 4. DTWFIA and MCPS,top specifications for Blocks 1, 2, 3, and 9 at the time of wood
forwarding.
Block DTWFIA (ha) MCPS,top (%)
1 1 39.9
2 16 35.3
3 1 39.4
9 0.25 26.4
immediately after wood forwarding, as listed in Table 2. Volumetric soil mois-ture, bulk density (Db) and cone penetration measurements were obtained prior
to these operations (Jones & Arp, 2019). Once MCPS was rasterized via Equations
(2), CI (in MPa) and NCI were emulated using the following expressions (Jones & Arp, 2019):
2 PS
CI=1.60 0.01MC− +0.03Depth+0.76Track+0.40SW; R =0.41 (3) where Depth is soil depth (cm), Track = 1 signifies presence of track with Track = 0, is undisturbed soil, and SW = 1 signifies where softwoods are dominant, otherwise SW = 0. The normalized cone index NCI (dimensionless) was derived from:
1000CI 1
NCI
1 2
db
W h b d
δ =
+ (4)
with d as tire diameter (m), b as tire width (m), W as total wheel load (kN) given by (machine weight + load)/number of tires, h as section height of the tire (m), and
δ
=0.001 0.365 170(
+ p W)
as tire deflection, with p is tire inflationpres-sure (in kPa).
Relating rut depth to NCI and number of passes along the same track pro-duced the following regression equation:
adj
0.071NCI 2 adj
40.8
Passes
NCI ; R 0.32
z= × × = (5)
where z is best-fitted field-measured rut depth, and where NCIadj = (NCI + 0.48
DTWFIA) incorporates a further numerically derived block-by-block DTW
ad-justments.
2.7. Statistical Analyses
All analyses were performed in R (R Core Team, 2015) after combining the ras-terized data layers into a covariate stack. A correlation matrix was created to show the general association pattern between the covariates, and the covariate association pattern so revealed was factor analysed. This was followed modelling MCPS, CI, and zn using multiple and Random Forest regression formulations
DOI: 10.4236/ojf.2019.94017 304 Open Journal of Forestry The dataset for modelling MCPS (n = 394) and CI (n = 372) included all top 15
cm soil sampling locations inside and outside the tracks in Blocks 1 to 11. The dataset for modelling rut depth (n = 207) applied to Blocks 1, 2, 3, and 9 only. The multivariate regression (MR) formulation via Equations (2) to (5) served to explore the extent of functional dependence of MCPS, CI, and zn on weather,
season, machine type, and digital soil mapping layers. The required input for modelling MCPS via Equation (2) refers to MCPS,DTW (Equations (1)), log10DTW,
OMDSM, DEM, HW = 1 or 0, and Track = 0 or 1. The required input for
model-ling CI via Equation (3) refers to modelled MCPS, Depth, SW = 1 or 0, and Track
= 0 or 1. The required input for rut depth modelling via Equation (5) refers to modelled NCI and number of passes.
MR and RF inputs comprised NCI (Equation (4)), CFDSM, OMDSM, depth to C
horizon (CDSM), and number of passes (“Passes”). The training process was set to
generate and test 15 regression trees using 3 variables to split each tree node, followed by a 10-fold cross-validation process with 10 replicates (Kohavi, 1995). The resulting model output produced field-determined versus Random-Forest fitted MCPS, CI, and zn scatter plots, and informed about the most MCPS-, CI-,
and zn-predictive data layers. RF model performance was determined by
eva-luating the mean decreased accuracy and variable importance.
Both MR and RF techniques were used to determine which combination of variables would produced the best-fitting MCPS, CI, NCI and rut depth
projec-tions. With best-fitted results reported by listing the number of variables used, the root mean square error (RMSE), and the coefficient of determination R2.
2.8. Soil Trafficability Model (STRAM)
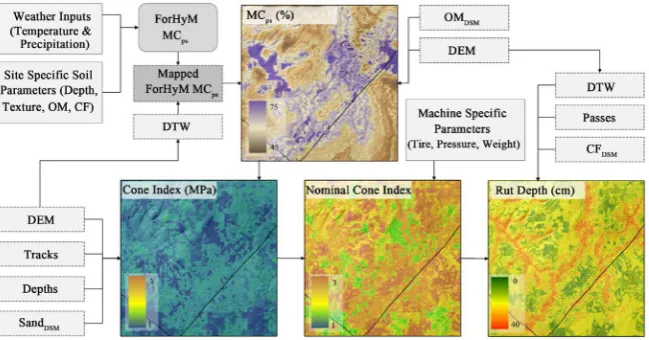
The information flow generated from modelling soil moisture, CI and rut depth was organized in the form of a Soil Trafficability Model framework (STRAM), as shown in Figure 3. Applying STRAM involved:
1) Initializing and calibrating ForHyM to determine MCPS for specific weather
[image:9.595.213.538.536.706.2]conditions, by block and stand type.
DOI: 10.4236/ojf.2019.94017 305 Open Journal of Forestry 2) Projecting MCPS across the terrain based on digital elevation, DTW, and
soil mapping techniques, by block, using Equations (2).
3) Combining the weather-specific MCPS projections with digitally generated
soil properties to generate the CI, NCI and rut-depth data layers, by block, using Equations (3) to (5).
4) Optimizing these data layers through R-tool regression techniques (fixed effects, Random Forest) based on actual field observations where available.
3. Results
3.1. MC
PS, CI, and Rut-Depth Analysis
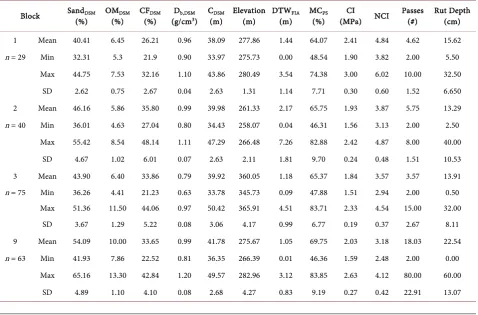
The basic statistics of the plot-centered rut depth, MCPS, CFDSM, SandDSM, OMDSM,
Db,DSM, CDSM, elevation, DTW, CI, and NCI values are listed in Table 5. The
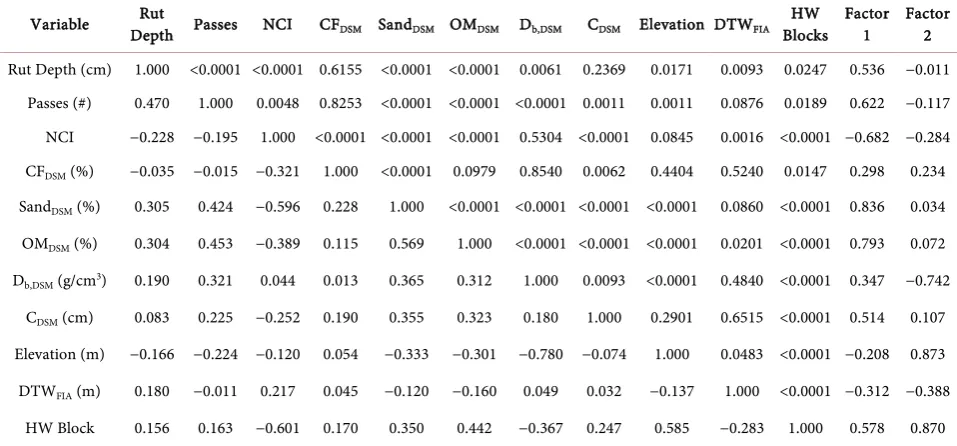
cor-relation coefficients and their non-zero significance levels between these varia-tions in association with block location are compiled in Table 6, along with the corresponding factor analysis. Factor 1 indicates that the rut-depth determina-tions related positively to number of wood-forwarding passes, to sand and or-ganic matter content, and to soil depth (CDSM), but negatively to NCI, as to be
[image:10.595.60.539.424.739.2]expected. In addition, rut depth was generally deeper in hardwood blocks (Blocks 3 and 9). Factor 2 reflects that the hardwood blocks at higher elevation and DTW locations had lower soil density and hence and lower soil resistance to penetration than the softwood blocks located at lower elevations.
Table 5. Soil physical properties and rut measurements.
Block SandDSM
(%) OM(%) DSM CF(%) DSM (g/cmDb,DSM3) C(m) DSM Elevation (m) DTW(m) FIA MC(%) PS (MPa) NCI CI Passes (#) Rut Depth (cm)
1 Mean 40.41 6.45 26.21 0.96 38.09 277.86 1.44 64.07 2.41 4.84 4.62 15.62
n = 29 Min 32.31 5.3 21.9 0.90 33.97 275.73 0.00 48.54 1.90 3.82 2.00 5.50
Max 44.75 7.53 32.16 1.10 43.86 280.49 3.54 74.38 3.00 6.02 10.00 32.50
SD 2.62 0.75 2.67 0.04 2.63 1.31 1.14 7.71 0.30 0.60 1.52 6.650
2 Mean 46.16 5.86 35.80 0.99 39.98 261.33 2.17 65.75 1.93 3.87 5.75 13.29
n = 40 Min 36.01 4.63 27.04 0.80 34.43 258.07 0.04 46.31 1.56 3.13 2.00 2.50
Max 55.42 8.54 48.14 1.11 47.29 266.48 7.26 82.88 2.42 4.87 8.00 40.00
SD 4.67 1.02 6.01 0.07 2.63 2.11 1.81 9.70 0.24 0.48 1.51 10.53
3 Mean 43.90 6.40 33.86 0.79 39.92 360.05 1.18 65.37 1.84 3.57 3.57 13.91
n = 75 Min 36.26 4.41 21.23 0.63 33.78 345.73 0.09 47.88 1.51 2.94 2.00 0.50
Max 51.36 11.50 44.06 0.97 50.42 365.91 4.51 83.71 2.33 4.54 15.00 32.00
SD 3.67 1.29 5.22 0.08 3.06 4.17 0.99 6.77 0.19 0.37 2.67 8.11
9 Mean 54.09 10.00 33.65 0.99 41.78 275.67 1.05 69.75 2.03 3.18 18.03 22.54
n = 63 Min 41.93 7.86 22.52 0.81 36.35 266.39 0.01 46.36 1.59 2.48 2.00 0.00
Max 65.16 13.30 42.84 1.20 49.57 282.96 3.12 83.85 2.63 4.12 80.00 60.00
DOI: 10.4236/ojf.2019.94017 306 Open Journal of Forestry Table 6. Pearson’s correlation matrix (below diagonal) with significance levels (above diagonal) for each variable pair, and Factor analysis loadings for Factor 1 and 2 following oblique factor rotation.
Variable Depth Passes NCI Rut CFDSM SandDSM OMDSM Db,DSM CDSM Elevation DTWFIA HW Blocks Factor 1 Factor 2
Rut Depth (cm) 1.000 <0.0001 <0.0001 0.6155 <0.0001 <0.0001 0.0061 0.2369 0.0171 0.0093 0.0247 0.536 −0.011 Passes (#) 0.470 1.000 0.0048 0.8253 <0.0001 <0.0001 <0.0001 0.0011 0.0011 0.0876 0.0189 0.622 −0.117 NCI −0.228 −0.195 1.000 <0.0001 <0.0001 <0.0001 0.5304 <0.0001 0.0845 0.0016 <0.0001 −0.682 −0.284 CFDSM (%) −0.035 −0.015 −0.321 1.000 <0.0001 0.0979 0.8540 0.0062 0.4404 0.5240 0.0147 0.298 0.234 SandDSM (%) 0.305 0.424 −0.596 0.228 1.000 <0.0001 <0.0001 <0.0001 <0.0001 0.0860 <0.0001 0.836 0.034 OMDSM (%) 0.304 0.453 −0.389 0.115 0.569 1.000 <0.0001 <0.0001 <0.0001 0.0201 <0.0001 0.793 0.072 Db,DSM (g/cm3) 0.190 0.321 0.044 0.013 0.365 0.312 1.000 0.0093 <0.0001 0.4840 <0.0001 0.347 −0.742
CDSM (cm) 0.083 0.225 −0.252 0.190 0.355 0.323 0.180 1.000 0.2901 0.6515 <0.0001 0.514 0.107 Elevation (m) −0.166 −0.224 −0.120 0.054 −0.333 −0.301 −0.780 −0.074 1.000 0.0483 <0.0001 −0.208 0.873 DTWFIA (m) 0.180 −0.011 0.217 0.045 −0.120 −0.160 0.049 0.032 −0.137 1.000 <0.0001 −0.312 −0.388
HW Block 0.156 0.163 −0.601 0.170 0.350 0.442 −0.367 0.247 0.585 −0.283 1.000 0.578 0.870
The MR-generated results in Table 7 revealed that MCPS increased
signifi-cantly with MCPS,DTW as influenced by wet weather and by decreasing DTW from
ridge tops to low-lying areas next to water-filled flow channels. In addition, MCPS was higher inside than outside the tracks, and higher under hardwood
ve-getation but decreased towards the higher elevation blocks (Table 7). CI de-creased with increasing pore-filled soil moisture content, but was noticeably higher within softwood blocks and tracks due to cumulative wheel-induced compaction. As per Equation (5), rut depth increased significantly with number of forwarding passes (log10Passes) and decreased significantly with increasing
log10NCI. The non-linear DTW-adjustment for Equation (5) improved the MR
regression results and related best-fitted scatterplots, but only to a small ex-tent.
The RF results, also listed in Table 7, identified MCPS, DTW, elevation (DEM)
and OMDSM as dominant MCPS influencing predictors. For CI, RF selected
ele-vation, MCPS, SandDSM, Depth, and track location served as dominant predictors.
For rut depth, the RF process selected number of passes, NCI, DTW and CF as best predictors.
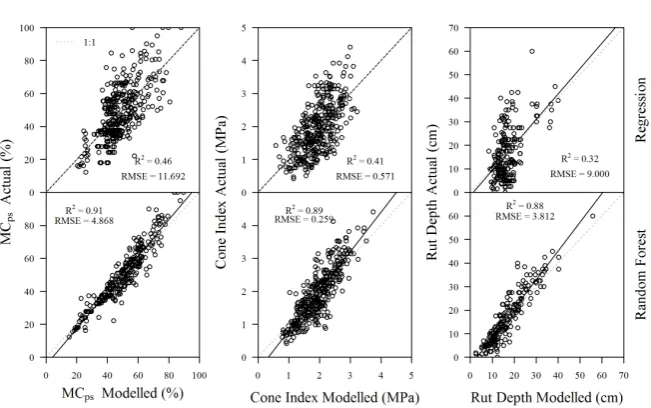
Compared to MR, the best-fitted RF-generated R2 values for MC
PS, CI and rut
depth in Table 7 were considerably higher. The corresponding scatter plots in Figure 4 demonstrate the extent of the MR-versus RF-generated goodness-of-fit for each of these variables. In detail, the eight-times-out-of-ten conformance levels for MCPS, CI and rut depth respectively amounted to: ±14%, ±0.7 MPA
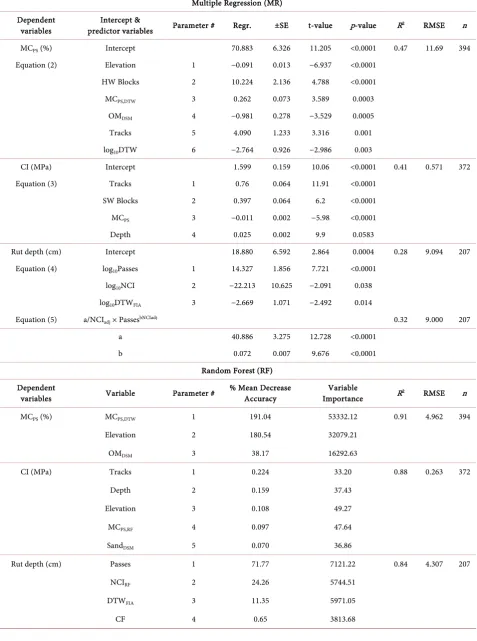
DOI: 10.4236/ojf.2019.94017 307 Open Journal of Forestry Table 7. Multiple and random Forest regression results for MCPS, CI and rut depth.
Multiple Regression (MR) Dependent
variables predictor variables Intercept & Parameter # Regr. ±SE t-value p-value R2 RMSE n
MCPS (%) Intercept 70.883 6.326 11.205 <0.0001 0.47 11.69 394
Equation (2) Elevation 1 −0.091 0.013 −6.937 <0.0001
HW Blocks 2 10.224 2.136 4.788 <0.0001
MCPS,DTW 3 0.262 0.073 3.589 0.0003
OMDSM 4 −0.981 0.278 −3.529 0.0005
Tracks 5 4.090 1.233 3.316 0.001
log10DTW 6 −2.764 0.926 −2.986 0.003
CI (MPa) Intercept 1.599 0.159 10.06 <0.0001 0.41 0.571 372
Equation (3) Tracks 1 0.76 0.064 11.91 <0.0001
SW Blocks 2 0.397 0.064 6.2 <0.0001
MCPS 3 −0.011 0.002 −5.98 <0.0001
Depth 4 0.025 0.002 9.9 0.0583
Rut depth (cm) Intercept 18.880 6.592 2.864 0.0004 0.28 9.094 207
Equation (4) log10Passes 1 14.327 1.856 7.721 <0.0001
log10NCI 2 −22.213 10.625 −2.091 0.038
log10DTWFIA 3 −2.669 1.071 −2.492 0.014
Equation (5) a/NCIadj × PassesbNCIadj 0.32 9.000 207
a 40.886 3.275 12.728 <0.0001
b 0.072 0.007 9.676 <0.0001
Random Forest (RF) Dependent
variables Variable Parameter # % Mean Decrease Accuracy Importance Variable R2 RMSE n
MCPS (%) MCPS,DTW 1 191.04 53332.12 0.91 4.962 394
Elevation 2 180.54 32079.21
OMDSM 3 38.17 16292.63
CI (MPa) Tracks 1 0.224 33.20 0.88 0.263 372
Depth 2 0.159 37.43
Elevation 3 0.108 49.27
MCPS,RF 4 0.097 47.64
SandDSM 5 0.070 36.86
Rut depth (cm) Passes 1 71.77 7121.22 0.84 4.307 207
NCIRF 2 24.26 5744.51
DTWFIA 3 11.35 5971.05
DOI: 10.4236/ojf.2019.94017 308 Open Journal of Forestry Figure 4. Comparison between modelled linear regression and random forest for MCPS,
[image:13.595.224.527.310.437.2]CI and rut depth.
Figure 5. Cumulative conformance probability for differences in MCPS, CI, and rut depth
for RF and RM.
Figure 6. Best-fitted RF- and MR-R2 and RSME values achieved using predictor variables
[image:13.595.218.530.483.693.2]DOI: 10.4236/ojf.2019.94017 309 Open Journal of Forestry RF-R2 gain of about 0.80, while the corresponding MR-R2 gain was limited to
0.2. For CI and rut depth, MR and FR had similar low initial R2 values using,
re-spectively, the binary 0, 1 Track and the grouped number of passes (“Passes”) variables. Having these variables as initial predictor variables was essential to address the otherwise unresolvable scatter that would otherwise be incurred by using continuous predictor variables only.
Figure 7 shows the GPS-tracked wood forwarding tracks across Blocks 1, 2, 3, and 9 are overlaid on the delineated DTW < 1 m and hill-shaded DEM back-ground, also shown are the number of passes (top) and field-measured rut depths (bottom) at each location (Figure 7). Among these blocks, Block 3 revealed a close association between deep rut depths and DTW, followed by Block 9 and Block 2. Block 1 had no association between rut-depth and pass number. Rutting was deepest in Blocks 3 and 9 along multi-pass tracks across streams and wet-areas.
Figure 8 provides a closer look regarding the extent of track rutting in Block 9 through the overlays of the DTW < 0.5 m delineated patterns on the hill shaded-DEM (top) and the surface-image (bottom) backgrounds. The surface image was generated a year after the wood-forwarding operations. At that time, rutting appearances had faded but remained prominent in the lower left corner of Block 9. Rutting > 40 cm deep occurred along multiple pass tracks where DTW < 0.5 m.
[image:14.595.211.538.448.680.2]3.2. MC
PS, CI, and Rut-Depth Projections
Figure 9 presents the MR-and RF-generated projections and data points for MCPS (top) and CI (bottom) for Blocks 1, 2, 3, and 9, with RF projections more
DOI: 10.4236/ojf.2019.94017 310 Open Journal of Forestry Figure 8. Close-ups from Figure 7 showing rut-depth measurement locations in Block 9 in relation to the extent of DTW < 0.5 m outline overlaid on a hill-shaded DEM (top, 10 cm resolution) obtained from DJI Phantom 4 Pro high-resolution surface scanning, im-aging and processing (bottom) one year after field operations.
Figure 9. Measured MCPS and CI values at 15 cm soil depth overlaid on the
[image:15.595.234.513.442.685.2]DOI: 10.4236/ojf.2019.94017 311 Open Journal of Forestry detailed in appearance and conformance than the MR projections, as to be ex-pected from the scatter plots in Figure 4, and the results listed in Table 7. Among the blocks, Block 9 proved to be the wettest, on account of 70 mm rain event two days before prior to the day of wood forwarding, and as reflected by the a consequential use of the DTWFIA = 0.25 ha data layer as dominant MCPS
predic-tor via Equation (4). In contrast, Block 1 was found to be excessively dry, such that the DTWFIA = 16 ha projection was best to represent the field-determined MCPS
values for this block outside the tracks. For Blocks 2 and 3, the MCPS was best
presented using the DTWFIA = 1 ha assignment to reflect the May and June soil
moisture conditions at the time of wood forwarding. Although both blocks had the same DTWFIA = 1 ha assignment, they differed in terms of CI-measured soil
[image:16.595.261.488.409.686.2]strength which was determined to be weaker for the hardwood block (Block 3) than for the softwood block (Block 2). Typically, shallow-rooting softwood fo-rests grow on coarser and stonier soils with lower soil organic matter accumula-tions than deeper-rooted hardwood forests.
Figure 10 presents an overlay of rut depth points on the corresponding MR (top) and RF (bottom) projections for Blocks 1, 2, 3, and 9 after 1, 10 and 50 passes, with better and more resolved RF than MR data-to-projection confor-mances. These plots confirm that number of passes and spatial variations in soil moisture are important rut-depth predictor variables. Actual rut depth, however, also depends on machine weight/load and soil physical properties, as quantified by way CI, NCI, and the variables listed in Table 7.
DOI: 10.4236/ojf.2019.94017 312 Open Journal of Forestry
4. Discussion
While RF emulates field-measured values for MCPS, CI and rut depth
considera-bly better than best-fitted MR values, it can only do so by systematically tracking those variables that best account for the overall data variations, including out-liers. To be of general value, more testing is required to capture more of the MCPS, CI and rut depth variations across a wide range of soil and vegetation
conditions. In this regard, the above regression results are at least consistent with general expectations. For example, moist to wet soils have low physical strength due to low particle cohesion (Kumar et al., 2012), and are therefore prone to traffic-induced compaction, displacement and rutting (Sutherland, 2003; Børgesen et al., 2006; Nikooy et al., 2016; Jones & Arp, 2017). To illustrate, Block 3 shows deeper ruts within the wetter DTWFIA = 1 ha marked area next to
a stream. Block 1 with no significant rut-depth observations was cut following dry weather conditions during mid-June of 2014, with overall soil moisture le-vels best conforming to a DTWFIA = 16 ha flow-channel pattern. In contrast,
deep ruts were encountered across Block 9 due to field operations in October 2014 following a 70 mm heavy rain event.
In terms of other physical soil properties, studies have shown that measured rut depth correlates positively with increased levels of OM in the soil (Suther-land, 2003; McFero Grace et al., 2006). In this study, rut depth also correlated positively with OM in Block 9 as revealed by the factor analysis results shown in Table 6.
Increased sand content generally contributes to low CI, NCI and therefore to increased rut depth, mainly due to low particle-to-particle cohesion (Balland et al., 2008; Brady & Weil, 2008; Kumar et al., 2012). In contrast, high coarse frag-ment content would increase CI, thereby decreasing rut depths. However, the overall CF variations within and across the blocks did not register this effect by way of MR, and only weakly so by RF. Typically, soils with high soil strength (high CI and NCI values) minimize soil disturbance (Antille & Godwin, 2013).
Significant and influential on the MR and RF results was the dependence of rut depth on the number of passes (p < 0.0001). In detail, this effect decreased non-linearly with increasing pass number due to gradually increasing soil com-paction, as quantified above via Equation (5) and in conformance with Eliasson (2005), Eliasson and Wästerlund (2007), Botta et al. (2009) and Jones et al. (2018). This is especially so for high traffic areas such as wood landing sites, and along tracks involving a hundred passes or more (Carter et al., 2007; Taghavifar & Mardani, 2014; Jones et al., 2018).
DOI: 10.4236/ojf.2019.94017 313 Open Journal of Forestry Figure 11. Historical weather for Block 1 from 2000 to 2015 showing cumulative precipi-tation (bottom left), historical snowpack and modelled frost depth (top left), mean Janu-ary, July, and annual air temperatures (top right), and mean ForHyM-modelled MCPS per
week (bottom right).
years. Generally, soil trafficability within this block would be best on solidly fro-zen ground, but worst during snowmelt periods when soils tend to be equally wet and partially thawed across the land. In detail, April and November would be the wettest months (Figure 11). During spring, summer and fall, soil traffica-bility would vary by monthly variations in soil moisture, and by the reduction thereof through evapotranspiration, as primarily affected by precipitation, air temperatures and canopy leaf area. According to Figure 11, the driest summer occurred in 2005 followed by wettest fall. The wettest summers occurred in 2003 and 2011. Soil trafficability would also have been very poor in April 2005. In contrast, soil trafficability would have been best during the winters of 2004, 2011, 2013 and 2014 due to deep and prolonged snowpack and soil frost conditions.
For the spatial component of the soil trafficability projections, it is important to determine the likely upslope flow-channel initiation area for each block, as listed in Table 8. To some extent, these estimates would need to be modified by soil texture and coarse fragment content: FIA numbers should be higher for well drained and rocky soils, and lower for loamy and clayey soils. Extended droughts and frost periods would also increase FIA, therefore increasing the areas availa-ble for off-road traffic. However, even during winter, care needs to be given to not drive along or across flow channels with high upslope flow-accumulation areas. This care is needed because: 1) channels may not totally be frozen on ac-count of upwelling seepage water, and 2) soil compaction and rutting along and across the channels would not only aggravate subsequent flooding but also soil and stream bank erosion. An example of year-round soil trafficability forecasting by month and related weather-imposed DTWFIA assignments is provided in
DOI: 10.4236/ojf.2019.94017 314 Open Journal of Forestry Figure 12. Year-round RF-generated soil trafficability projections by month forBlock 1, with focus on 2 passes and 2014 weather-affected DTWFIA assignments.
Table 8. Monthly region-specific DTWFIA choices useful for forecasting soil trafficability
across Blocks 1, 2, 3, and 9 and northwestern New Brunswick in general.
Month FIA
8 ha 4 ha 1 ha 0.25 ha
January Frozen - - Partial Thaw
February Frozen - - Partial Thaw
March Frozen - - Partial Thaw
April Frozen - - Very Wet
May Very Dry Dry - Very Wet
June Very Dry Dry Moist Wet
July Very Dry Dry Moist Wet
August Very Dry Dry Moist Wet
September Very Dry Dry Moist Wet
October - Dry Moist Wet
November - Dry Moist Wet
December Frozen Dry Moist Wet
Perhaps the greatest impediment for correct soil trafficability forecasting is the lack of proper coarse fragment specifications, which should—ideally—represent total CF changes within and across soils. The CF data and data layers used for this purpose were, however, not revealed to be significant within- and across-block predictor variables for MCPS, CI and rut depth. In part, this was due to not
[image:19.595.210.541.360.605.2]DOI: 10.4236/ojf.2019.94017 315 Open Journal of Forestry may serve as general non-block specific CI predictor (Jones & Arp, 2017):
10
2 PS
log CI=0.26 0.29 PS 0.41 MC− × − × +1.04 CF;× R =0.54 (6) where data for total coarse fragment content per soil volume are available, rut projections need to be forced towards zero when CF approaches 1. This can be done by, e.g. adjusting Equations (5) to
(
)
adj 2
0.071 NCI
adj
40.8
Passes 1 CF
NCI
z= × × × − (7)
5. Concluding Remarks
While this research demonstrates that the STRAM approach can be used to assess and project soil trafficability through coupling block-based soil surveys with tem-poral and spatial modelling techniques, there is a need for further data layer im-provements using MR and RF modeling techniques. To this end, area-systematic rut surveys can now be conducted by, e.g., equipping off-road vehicles with GPS-tracking LiDAR-based rut depth sensors (Salmivaara et al., 2018). Similarly, Giannetti et al. (2017) proposed terrestrial portable laser scanners and Haas et al. (2016), Pierzchała et al. (2016) and Launiainen et al. (2017) used unmanned air-borne vehicles (UAVs) for rut-depth stereo imaging and evaluating underlying terrain conditions. In addition, advances in weather-affected digital soil property mapping will further assist soil trafficability mapping, and the validity of the same needs to be assessed systematically using area-wide post-operational rut-depth surveys. In this regard, MR and RF techniques will be helpful in terms deter-mining how operationally induced soil compaction and rutting as observed and projected vary by topographic location, season and weather.
Acknowledgements
This research was supported financially through an NSERC Collaborative Re-search Project with J.D. Irving Limited as industrial partner. Special thanks go to Forest Watershed Research Centre at UNB, for facilitating this research, with additional support from Doug Hiltz for assistance with field sampling, and from Dr. Shane Furze for RF-analysis assistance and 10 m DSM layer provisions.
Conflicts of Interest
The authors declare no conflicts of interest regarding the publication of this pa-per.
References
Affleck, R. T. (2005). Disturbance Measurements from Off-Road Vehicles on Seasonal Terrain Cold Regions Research and Engineering Laboratory. US Army Corps of neers, Engineer Research and Development Center, Cold Regions Research and Engi-neering Laboratory.
DOI: 10.4236/ojf.2019.94017 316 Open Journal of Forestry Ampoorter, E., Goris, R., Cornelis, W. M., & Verheyen, K. (2007). Impact of Mechanized
Logging on Compaction Status of Sandy Forest Soils. Forest Ecology and Management, 241, 162-174.https://doi.org/10.1016/j.foreco.2007.01.019
Antille, D. L., & Godwin, R. J. (2013). Soil Displacement and Soil Bulk Density Changes as Affected by Tire Size. Transactions of the ASABE, 56, 1683-1693.
https://doi.org/10.13031/trans.56.9886
Arp, P. A., & Yin, X. (1992). Predicting Water Fluxes through Forest from Monthly Pre-cipitation and Mean Monthly Air Temperature Record. Canadian Journal of Forest Research, 22, 864-877.https://doi.org/10.1139/x92-116
Balland, V., Pollacco, J. A. P., & Arp, P. A. (2008). Modeling Soil Hydraulic Properties for a Wide Range of Soil Conditions. Ecological Modelling, 219, 300-316.
https://doi.org/10.1016/j.ecolmodel.2008.07.009
Bassett, I. E., Simcock, R. C., & Mitchell, N. D. (2005). Consequences of Soil Compaction for Seedling Establishment: Implications for Natural Regeneration and Restoration. Austral Ecology, 30, 827-833.https://doi.org/10.1111/j.1442-9993.2005.01525.x
Black Brook Watershed Research Site (2014). Black Brook Watershed Stream Discharge Data (WWW Document).
Børgesen, C. D., Jacobsen, O. H., Hansen, S., & Schaap, M. G. (2006). Soil Hydraulic Properties near Saturation, an Improved Conductivity Model. Journal of Hydrology, 324, 40-50. https://doi.org/10.1016/j.jhydrol.2005.09.014
Botta, G. F., Becerra, A. T., & Tourn, F. B. (2009). Effect of the Number of Tractor Passes on Soil Rut Depth and Compaction in Two Tillage Regimes. Soil and Tillage Research, 103, 381-386.https://doi.org/10.1016/j.still.2008.12.002
Brady, N. C., & Weil, R. R. (2008). The Nature and Properties of Soils (14th ed.). Upper Saddle River, NJ: Prentice Hall.
Breiman, L. (2001). Random Forests. Machine Learning, 45, 5-32.
https://doi.org/10.1023/A:1010933404324
Buja, K. (2012). Finding Overlapping Features Tool for ArcGIS.
Carter, E. A., Aust, W. M., & Burger, J. A. (2007). Soil Strength Response of Select Soil Disturbance Classes on a Wet Pine Flat in South Carolina. Forest Ecology and Man-agement, 247, 131-139.https://doi.org/10.1016/j.foreco.2007.04.026
Chen, G., & Weil, R. R. (2011). Root Growth and Yield of Maize as Affected by Soil Compaction and Cover Crops. Soil and Tillage Research, 117, 17-27.
https://doi.org/10.1016/j.still.2011.08.001
Department of Environment and Climate Change Canada (2016a). Historical Climate Data (WWW Document).http://climate.weather.gc.ca/
Department of Environment and Climate Change Canada (2016b). Historical Hydrome-tric Data (WWW Document).http://wateroffice.ec.gc.ca/
Dexter, A. R., Czyż, E. A., & Gaţe, O. P. (2007). A Method for Prediction of Soil Penetra-tion Resistance. Soil and Tillage Research, 93, 412-419.
Earl, R. (1997). Prediction of Trafficability and Workability from Soil Moisture Deficit. Soil and Tillage Research, 40, 155-168.https://doi.org/10.1016/S0167-1987(96)01072-0
Eliasson, L. (2005). Effects of Forwarder Tyre Pressure on Rut Formation and Soil Com-paction. Silva Fennica, 39, 549-557.https://doi.org/10.14214/sf.366
DOI: 10.4236/ojf.2019.94017 317 Open Journal of Forestry Farzaneh, B., Almassi, M., Sadeghi, M., & Minaei, S. (2012). Assessment of Soil Compac-tion Bulk Density Indices and Cone Index in Different Moistures and Depths for Ap-plication in Precise Tillage. World Applied Sciences Journal, 20, 1704-1712.
Furze, S. (2018). A High-Resolution Digital Soil Mapping Framework for New Bruns-wick, Canada (221 pp.). New Brunswick: University of New Brunswick.
Furze, S. (2019). Digital Soil Maps for New Brunswick (WWW Document).
GeoNB (2015). GIS Bare-Earth Digital Elevation Model. Fredericton, NB: Service New Brunswick.
Giannetti, F., Chirici, G., Travaglini, D., Bottalico, F., Marchi, E., & Cambi, M. (2017). Assessment of Soil Disturbance Caused by Forest Operations by Means of Portable La-ser Scanner and Soil Physical Parameters. Science Society of America Journal, 81, 1577-1585.https://doi.org/10.2136/sssaj2017.02.0051
Grigal, D. F. (2000). Effects of Extensive Forest Management on Soil Productivity. Forest Ecology and Management, 138, 167-185.
https://doi.org/10.1016/S0378-1127(00)00395-9
Haas, J., Ellhöft, K. H., Schack-Kirchner, H., & Lang, F. (2016). Using Photogrammetry to Assess Rutting Caused by a Forwarder—A Comparison of Different Tires and Bogie Tracks. Soil & Tillage Research, 163, 14-20.https://doi.org/10.1016/j.still.2016.04.008
Horn, R., Vossbrink, J., & Becker, S. (2004). Modern Forestry Vehicles and Their Impacts on Soil Physical Properties. Soil and Tillage Research, 79, 207-219.
https://doi.org/10.1016/j.still.2004.07.009
Jones, M. F., & Arp, P. A. (2017). Relating the Cone Penetration and Rutting Resistance of Soils to Variations in Soil Properties and Daily Moisture Variations over Time. Open Journal of Soil Science, 7, 149-171.https://doi.org/10.4236/ojss.2017.77012
Jones, M. F., & Arp, P. A. (2019). Analyzing and Projecting Soil Moisture and Cone Pe-netrability Variations in Forest Soils. Open Journal of Forestry, 9, 109-142.
https://doi.org/10.4236/ojf.2019.92005
Jones, M. F., Castonguay, M., Jaeger, D., & Arp, P. A. (2018). Track-Monitoring and Analyzing Machine Clearances during Wood Forwarding. Open Journal of Forestry, 8, 297-327.https://doi.org/10.4236/ojf.2018.83020
Jun, H. G., Way, T. R., Löfgren, B., Landström, M., Bailey, A. C., Burt, E. C., & McDo-nald, T. P. (2004). Dynamic Load and Inflation Pressure Effects on Contact Pressures of a Forestry Forwarder Tire. Journal of Terramechanics, 41, 209-222.
https://doi.org/10.1016/j.jterra.2004.03.002
Jutras, M. F. (2012). Modeling Stream Discharge in Forest Catchments across Canada: Hydraulic Conductivity Calibrations (146 pp.). New Brunswick: University of New Bruns-wick.
Kohavi, R. (1995). A Study of Cross-Validation and Bootstrap for Accuracy Estimation and Model Selection. International Joint Conference on Artificial Intelligence, 14, 1137-1145.
Kumar, A., Chen, Y., Sadek, A., & Rahman, S. (2012). Soil Cone Index in Relation to Soil Texture, Moisture Content, and Bulk Density for No-Tillage and Conventional Tillage. Agricultural Engineering International, 14, 26-37.
Labelle, E. R., Jaeger, D., & Poltorak, B. J. (2015). Assessing the Ability of Hardwood and Softwood Brush Mats to Distribute Applied Loads. Croatian Journal of Forest Engi-neering, 36, 227-242.
Photogram-DOI: 10.4236/ojf.2019.94017 318 Open Journal of Forestry metry. Remote Sensing, 9, 1279.https://doi.org/10.3390/rs9121279
Maclaurin, E. B. (1990). The Use of Mobility Numbers to Describe the in-Field Tractive Performance of Pneumatic Tyres. In Proceedings of the 10th International ISTVS Conference (pp. 177-186). Kobe, Japan.
McDonald, T., & Sexias, F. (1997). Effect of Slash on Forwarder Soil Compaction. Journal of Forest Engineering, 8, 15-26.
McFero Grace, J., Skaggs, R. W., & Cassel, D. K. (2006). Soil Physical Changes Associated with Forest Harvesting Operations on an Organic Soil. Science Society of America Journal, 70, 503-509.https://doi.org/10.2136/sssaj2005.0154
Meek, P. (1996). Effects of Skidder Traffic on Two Types of Forest Soils. Technical Re-port. Pointe-Claire, QC.
Murphy, P. N. C., Castonguay, M., Ogilvie, J., Nasr, M., Hazlett, P., Bhatti, J. S., & Arp, P. A. (2009). A Geospatial and Temporal Framework for Modeling Gaseous N and Other N Losses from Forest Soils and Basins, with Application to the Turkey Lakes Wa-tershed Project, in Ontario, Canada. Forest Ecology and Management, 258, 2304-2317.
https://doi.org/10.1016/j.foreco.2008.12.006
Murphy, P. N. C., Ogilvie, J., Meng, F. R., White, B., Bhatti, J. S., & Arp, P. A. (2011). Modelling and Mapping Topographic Variations in Forest Soils at High Resolution: A Case Study. Ecological Modelling, 222, 2314-2332.
Naghdi, R., Bagheri, I., Lotfalian, M., & Setodeh, B. (2009). Rutting and Soil Displacement Caused by 450c Timber Jack Wheeled Skidder (Asalem Forest Northern Iran). Journal of Forest Science, 55, 177-183.https://doi.org/10.17221/102/2008-JFS
Nikooy, M., Tsioras, P. A., Naghdi, R., Zenner, E. K., & Solgi, A. (2016). Soil Disturbance Caused by Ground-Based Skidding at Different Soil Moisture Conditions in Northern Iran. International Journal of Forest Engineering, 27, 169-178.
https://doi.org/10.1080/14942119.2016.1234196
Page-Dumroese, D., Jurgensen, M., Elliot, W., Rice, T., Nesser, J., Collins, T., & Meurisse, R. (2000). Soil Quality Standards and Guidelines for Forest Sustainability in Northwes-tern North America. Forest Ecology and Management, 138, 445-462.
https://doi.org/10.1016/S0378-1127(00)00430-8
Pierzchała, M., Talbot, B., & Astrup, R. (2016). Measuring Wheel Ruts with Close-Range Photogrammetry. Forestry: An International Journal of Forest Research, 89, 383-391.
https://doi.org/10.1093/forestry/cpw009
Poltorak, B. J., Labelle, E. R., & Jaeger, D. (2018). Soil Displacement during Ground-Based Mechanized Forest Operations Using Mixed-Wood Brush Mats. Soil and Tillage Re-search, 179, 96-104.https://doi.org/10.1016/j.still.2018.02.005
R Core Team (2015). R: A Language and Environment for Statistical Computing. Vienna, Austria.
Rantala, M. (2001). Comparison of Some Measurement Methods for Predicting the Site Sensitivity (Rut Formation) in the Practical Harvesting of Wood (pp. 5-8).ECOWOOD. Raper, R. L. (2005). Agricultural Traffic Impacts on Soil. Journal of Terramechanics, 42,
259-280.https://doi.org/10.1016/j.jterra.2004.10.010
Raper, R. L., Bailey, A. C., Burt, E. C., Way, T. R., & Liberati, P. (1995). The Effects of Reduced Inflation Pressure on Soil-Tire Interface Stresses and Soil Strength. Journal of Terramechanics, 32, 43-51.https://doi.org/10.1016/0022-4898(95)00002-I
Saarilahti, M. (2002a). Soil Interaction Model. Helsinki, Finland.
DOI: 10.4236/ojf.2019.94017 319 Open Journal of Forestry Saarilahti, M., & Anttila, T. (1999). Rut Depth Model for Timber Transport of Moraine
Soils. In Proceedings of the 9th International Conference of International Society for Terrain-Vehicle Systems (pp. 29-37). Barcelona, Spain: Barcelona Congress Hall. Sakai, H., Nordfjell, T., Suadicani, K., Talbot, B., & Bøllehuus, E. (2008). Soil Compaction
on Forest Soils from Different Kinds of Tires and Tracks and Possibility of Accurate Estimate. Croatian Journal of Forest Engineering, 29, 15-27.
Salmivaara, A., Miettinen, M., Finér, L., Launiainen, S., Korpunen, H., Tuominen, S., Heikkonen, J., Nevalainen, P., Sirén, M., Ala-Ilomäki, J., & Uusitalo, J. (2018). Wheel Rut Measurements by Forest Machine-Mounted LiDAR Sensors-Accuracy and Poten-tial for Operational Applications? International Journal of Forest Engineering, 29, 41-52.https://doi.org/10.1080/14942119.2018.1419677
Scholander, J. (1974). Bearing Capacity of Some Forest Soils for Wheeled Vehicles. Some Technical Aspects and Consequences. Skogsmarks bärighet för hjulfordon. Några tek-niska aspekter och konsekvenser. Specialnotiser från. SFM Nr 14.
Singer, M. J., & Munns, D. N. (2006). Soils: An Introduction (6th ed.). Columbus, OH: Pearson Prentice Hall.
Sirén, M., Ala-Ilomäki, J., Lindeman, H., Uusitalo, J., Kiilo, K., Salmivaara, A., & Ryynänen, A. (2019). Soil Disturbance by Cut-to-Length Machinery on Mid-Grained Soils. Silva Fennica, 53, 1-24.https://doi.org/10.14214/sf.10134
Sutherland, B. J. (2003). Preventing Soil Compaction and Rutting in the Boreal Forest of Western Canada: A Practical Guide to Operating Timber-Harvesting Equipment. Point-Claire, QC.
Taghavifar, H., & Mardani, A. (2014). Effect of Velocity, Wheel Load and Multipass on Soil Compaction.Journal of the Saudi Society of Agricultural Sciences, 13, 57-66. Tekeste, M. Z., Raper, R. L., & Schwab, E. B. (2008). Soil Drying Effects on Soil Strength
and Depth of Hardpan Layers as Determined from Cone Index Data. Agricultural En-gineering International: The CIGR Ejournal, 10, 1-17.
Van Rees, K. (2002). Regulations and Guidelines for Soil Disturbance across Canada. Vaz, C. M. P. (2003). Use of a Combined Penetrometer-TDR Moisture Probe for Soil
Compaction Studies. College on Soil Physics.
Vaz, C. M. P., Manieri, J. M., de Maria, I. C., & Tuller, M. (2011). Modeling and Correc-tion of Soil PenetraCorrec-tion Resistance for Varying Soil Water Content. Geoderma, 166, 92-101.https://doi.org/10.1016/j.geoderma.2011.07.016
Vega-Nieva, D. J. D., Murphy, P. N. C., Castonguay, M., Ogilvie, J., & Arp, P. A. (2009). A Modular Terrain Model for Daily Variations in Machine-Specific Forest Soil Traffica-bility. Canadian Journal of Soil Science, 89, 93-109.https://doi.org/10.4141/CJSS06033
White, B., Ogilvie, J., Campbell, D. M. H., Hiltz, D., Gauthier, B., Chisholm, H. K. H., Wen, H. K., Murphy, P. N. C., & Arp, P. A. (2012). Using the Cartographic Depth-to-Water Index to Locate Small Streams and Associated Wet Areas across Landscapes. Canadian Water Resources Journal, 37, 333-347.https://doi.org/10.4296/cwrj2011-909
DOI: 10.4236/ojf.2019.94017 320 Open Journal of Forestry
Appendix
[image:25.595.210.522.108.710.2]Appendix 1. Rut Depth Severity Classes
DOI: 10.4236/ojf.2019.94017 321 Open Journal of Forestry
Appendix 2. Temporal Soil Moisture Modelling
The Forest Hydrology Model (ForHyM) uses daily temperature and precipita-tion (rain and snow) data as well as block-specific area, vegetaprecipita-tion, soil horizon texture, depth, OM, and CF (Table A1) to predict soil moisture and temperature fluctuations through the soil (Arp & Yin, 1992; Yin & Arp, 1994; Jutras, 2012). Calibrating ForHyM consists of comparing actual snowpack and hydraulic flow to modelled outputs and adjusting the output parameters (Table A2, Figure A2).
Table A1. Soil profile and vegetation information used to initialize ForHyM for each block.
Block Vegetation Layer Depth Texture OM (%) CF (%)
1
INHW, deep rooted
LFH 5 Organic 100 0
A 25 SL 15 20
B 50 SL 5 20
C 100 SL 1 35
2
SW, shallow rooted
LFH 10 Organic 100 0
A 10 LS 2 20
B 50 LS 10 24
C 100 SL 1 35
3
SW, shallow rooted
LFH 10 Organic 100 0
A 10 LS 2 20
B 50 LS 10 24
C 100 SL 1 35
9
TOHW, deep rooted
LFH 5 Organic 100 0
A 10 LS 8 20
B 55 LS 5 20
C 150 SL 1 25
Table A2. ForHyM calibrations pertaining to snowpack and soil permeability across Blocks 1 to 4.
Blocks 1 - 3 9
Snowpack Density Snow-to-air temperature gradient 0.16 0.2
Density of fresh snow 0.16 0.2
Saturated Soil Permeability Multiplier
Surface runoff 1 1
Forest floor infiltration 1 1
Forest floor interflow 0.01 0.01
A & B horizon infiltration 1 1
A & B horizon interflow 0.05 0.01
C horizon infiltration 1 1
C horizon interflow 0.1 0.5
[image:26.595.214.539.240.504.2] [image:26.595.210.539.548.734.2]