https://www.scirp.org/journal/jtts ISSN Online: 2160-0481
ISSN Print: 2160-0473
DOI: 10.4236/jtts.2019.94028 Sep. 27, 2019 450 Journal of Transportation Technologies
Understanding the Contributing Factors to
Nighttime Crashes at Freeway Mainline
Segments
Hongyun Chen, Kristiansson Fanny
Department of Civil Engineering, Embry-Riddle Aeronautical University, Daytona Beach, FL, USA
Abstract
This study investigated the crash contributing factors to the injury outcomes and the characteristics of the night time crashes at freeway mainline seg-ments. Multinomial logit model (MNL) was selected to estimate the explana-tory variables at a 95% confidence level. The six-year crash data (2005-2010) were obtained in the State of Florida, USA and five injury level outcomes, no injury, possible injury, non-incapacitating injury, capacitating injury, and fat-al injury, were considered. The no injury level was selected as the baseline category.
Keywords
Contributing Factors, Nighttime Crash, Injury Severity, Freeway Mainline
1. Introduction
Driving during nighttime tends to be riskier than day time [1]. Though vehicles travelling at night is about 25 percent of the total traffic, the nighttime crash rate remains high in the past decades, in general approximately 1.6 times of the day-time rate [2]. Additionally, the fatality rate of nighttime crash is much higher than the day time’s rate. In 2011, 13,861 fatal crashes were occurred nighttime, which accounted for almost half of the fatal crashes in the US. Even though the fatality rate decreases by 1.8 percent from 2010 to 2011, the fatal crashes in-creased by 0.5 percent.
Figure 1 compares the five injury outcomes, no injury, possible injury, non-incapacitating injury, incapacitating injury, and fatal injury, in the State of Florida, USA from the year 2005 to 2010. Not only the fatal injury, but the also the percentages of incapacitating injury, and non-incapacitating injury are higher How to cite this paper: Chen, H.Y. and
Fanny, K. (2019) Understanding the Con-tributing Factors to Nighttime Crashes at Freeway Mainline Segments. Journal of Transportation Technologies, 9, 450-461. https://doi.org/10.4236/jtts.2019.94028
Received: May 10, 2019 Accepted: September 24, 2019 Published: September 27, 2019
Copyright © 2019 by author(s) and Scientific Research Publishing Inc. This work is licensed under the Creative Commons Attribution International License (CC BY 4.0).
DOI: 10.4236/jtts.2019.94028 451 Journal of Transportation Technologies
Figure 1. Percentage of crash injury levels under different lighting conditions from
2005-2010.
at the night time than those during the day time and dust/dawn conditions. The facts indicate there is a need to better understand the contributing factors to those nigh time crashes, and crash characteristics.
Few studies have focused on the night time crashes and most of them concen-trated on demonstrating the benefit of using street lights to reduce night time crashes. Hawkins et al.[2] modeled the crashes with the presence of lighting and absence of lighting at 233 rural unsignalized intersections and found the loca-tions without lighting had twice as many as crashes as localoca-tions with lighting. Elvik [3] compared the results from 37 studies of safety effects of public lighting and found that lightning reduces night time fatal accidents by 65 percent while 15 percent reduction for property damage only (PDO) crashes. However, a study conducted by Griffith [4] compared the night time crashes on a 55-mile long urban freeway segment with continuous lighting and a 36 mile without lighting. It only found the significant difference for PDO crash rates, which is 19 percent higher at those without street lighting.
These studies were conducted about 15 to 20 years ago while the sample sizes were limited, and detailed levels of crash information might not be available at that time which could significantly lead to the bias in the estimation.
Nighttime crashes appear more complicated than the day time crashes. The purpose of this study is to investigate the crash contributing factors to the injury outcomes and the characteristics of the night time crashes at freeway mainline segments. The findings from this study could help the engineers and researchers to further select the effective countermeasures or policies to effectively reduce the night time crashes, especially the injury severity levels.
2. Methology
[image:2.595.210.537.73.234.2]DOI: 10.4236/jtts.2019.94028 452 Journal of Transportation Technologies the same variable for the injury outcomes. It is likely that the ordered model might overestimate the probability of the high injury level while underestimates the low injury level [7]. Moreover, the same variable might significantly impact one injury level and not the other one. MNL is more flexible and suitable in this study. Each injury MNL could have different variables and coefficients which can distinguish the efforts of same variables on the different injury levels. Thus, the MNL in this study estimated the crash injury outcomes by different expla-natory variables.
Assuming there are m possible severity injury outcomes (m = 5, no injury, possible injury, non-incapacitating injury, incapacitating injury, and fatal in-jury), the MNL model has a function for each injury outcome in the following equation [5][9]:
, 1, , ; 1, ,
ik =αk+ k ik+εik i= n k= m
Y β X (1)
where n is the number of total crashes; Yik is the severity function for the kth possible injury outcome of the ith crash; αk is an intercept parameter for the severity injury outcome k; Xik is a vector of explanatory variables of crash i in the injury outcome k; βk is a vector of coefficients to be estimated; and εik is an random error term following the Type I [10] distribution. The no injury out-come was used as the baseline category. Let Pi(k) represent the probability of the crash i in the severity injury outcome k, then the probability is:
(
)
(
)
(
)
1
exp |
exp
k k ik ik
i m
m m im im k
P k
α
ε
α
ε
=
+ +
=
+ +
∑
X
X
β
β
β
(2)The following equation determines the odds ratio (OR) or relative risk by us-ing the estimated coefficients.
( )
ORjk =exp βjk , jk =1,,uk (3)
where jk is the explanatory variable in the injury outcome k model and uk is the total number of significant explanatory variables which vary in different injury outcome models. The OR indicates the probability of choosing one outcome category over the probability of choosing the baseline category (no injury out-come) for one specific explanatory variable while others hold constant. If OR is larger than 1, it is likely to increase the injury level outcome k; if OR is smaller than 1, the injury level is likely to decrease the outcome k.
Two parameters are used to evaluate the goodness-of-fit of the MNL, Akaike’s information criterion (AIC), and likelihood ratio. The model with the smaller AIC is considered the better-fitting model. The confidence level is 95% for the explanatory variables.
3. Data Collection
DOI: 10.4236/jtts.2019.94028 453 Journal of Transportation Technologies and crash conditions. After cleaning these data with missing codes, a total of 45,798 crashes were occurred at the freeways.
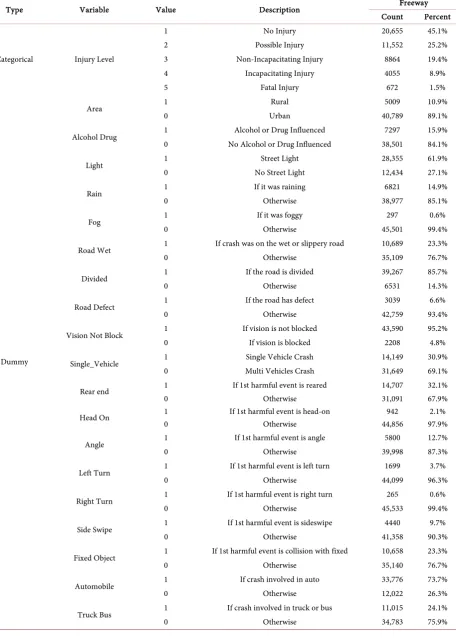
Twenty-eight variables were initially selected and described in Table 1, in-cluded one categorical variable, twenty-one dummy variables and five conti-nuous variables. Five injury level outcomes were coded from 1 to 5. The roadway conditions include the area types (rural/urban), the road surface condition (dry/wet), the type of road (divided/not divided), the road condition (defect/no defect), the road shoulder width (ft), AADT (average annual daily traffic) in thousand, the percentage of heavy truck, maximal post speed limit, lighting con-ditions (light/no light), and weather concon-ditions (rain/fog).
Crash conditions include the crash types defined by the first harmful events (rear-end, head-on, angle, left-turn, right-turn, sideswipe, and collisions with fixed objects), vehicle type (single vehicle or multi-vehicles), safety equipment used when crash occurred, and vision blockage when crash occurred. Driver in-formation includes age, alcohol and/or drug involved when crash occurred. Ve-hicle information contains the type of veVe-hicle involved in the crash (auto/van, truck/bus, or bike).
4. Data Analysis
1) Multinomial Model Result
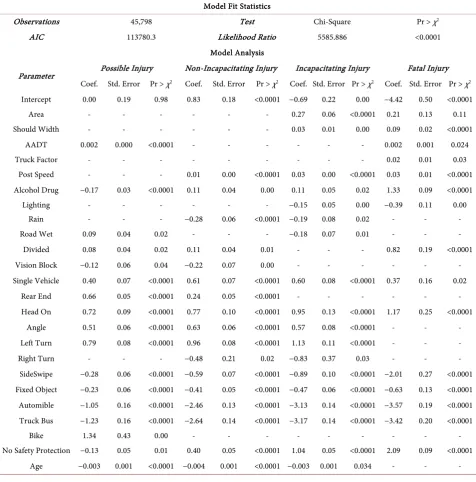
Table 2 lists the final model results with the explanatory variables at a 5% sig-nificant level. Five injury outcomes were used and the baseline category is no injury. The variable, fog, is not significant. It is possible that the sample sizes of crashes during fog was relatively small, ranging from 0.5% to 1.3% of the total crashes. The road defect is also not significant for the injury outcomes which in-dicate the variable associated with the number of the crashes but not contributed to injury outcomes. Automobile and truck are found to be less likely involved in four injury levels.
As listed in Table 2, twenty-three variables out of twenty-eight are significant for most of the injury outcomes. Area type is only significant for the incapaci-tating and fatal injury outcomes. Crashes occur at rural freeways areas are likely to be involved in severe injury levels. Similar to post speed limit, the higher speed limit, the likelihood of severe crashes could occur. AADT is only signifi-cant for the possible injury and fatal injury.
DOI: 10.4236/jtts.2019.94028 454 Journal of Transportation Technologies
Table 1. Selected explanatory variables.
Type Variable Value Description Freeway
Count Percent
Categorical Injury Level
1 No Injury 20,655 45.1%
2 Possible Injury 11,552 25.2%
3 Non-Incapacitating Injury 8864 19.4%
4 Incapacitating Injury 4055 8.9%
5 Fatal Injury 672 1.5%
Dummy
Area 1 Rural 5009 10.9%
0 Urban 40,789 89.1%
Alcohol Drug 1 Alcohol or Drug Influenced 7297 15.9%
0 No Alcohol or Drug Influenced 38,501 84.1%
Light 1 Street Light 28,355 61.9%
0 No Street Light 12,434 27.1%
Rain 1 If it was raining 6821 14.9%
0 Otherwise 38,977 85.1%
Fog 1 If it was foggy 297 0.6%
0 Otherwise 45,501 99.4%
Road Wet 1 If crash was on the wet or slippery road 10,689 23.3%
0 Otherwise 35,109 76.7%
Divided 1 If the road is divided 39,267 85.7%
0 Otherwise 6531 14.3%
Road Defect 1 If the road has defect 3039 6.6%
0 Otherwise 42,759 93.4%
Vision Not Block 1 If vision is not blocked 43,590 95.2%
0 If vision is blocked 2208 4.8%
Single_Vehicle 1 Single Vehicle Crash 14,149 30.9%
0 Multi Vehicles Crash 31,649 69.1%
Rear end 1 If 1st harmful event is reared 14,707 32.1%
0 Otherwise 31,091 67.9%
Head On 1 If 1st harmful event is head-on 942 2.1%
0 Otherwise 44,856 97.9%
Angle 1 If 1st harmful event is angle 5800 12.7%
0 Otherwise 39,998 87.3%
Left Turn 1 If 1st harmful event is left turn 1699 3.7%
0 Otherwise 44,099 96.3%
Right Turn 1 If 1st harmful event is right turn 265 0.6%
0 Otherwise 45,533 99.4%
Side Swipe 1 If 1st harmful event is sideswipe 4440 9.7%
0 Otherwise 41,358 90.3%
Fixed Object 1 If 1st harmful event is collision with fixed 10,658 23.3%
0 Otherwise 35,140 76.7%
Automobile 1 If crash involved in auto 33,776 73.7%
0 Otherwise 12,022 26.3%
Truck Bus 1 If crash involved in truck or bus 11,015 24.1%
DOI: 10.4236/jtts.2019.94028 455 Journal of Transportation Technologies Continued
Bike 1 If crash involved in bike 130 0.3%
0 Otherwise 45,668 99.7%
No Safety Protection 1 If safety equipment is not used 3957 8.6%
0 Otherwise 41,841 91.4%
Continuous
Should Width Road Shoulder Width (ft) 0 - 98
AADT Average Annual Daily Traffic in Thousand 4.50 - 328
Truck Factor Percent of heavy truck (%) 0 - 53
Post Speed Posted speed limit (mph) 45 - 70
[image:6.595.60.537.249.732.2]Age Driver age (year) 15 - 109
Table 2. Multinomial Logit model result.
Model Fit Statistics
Observations 45,798 Test Chi-Square Pr > χ2
AIC 113780.3 Likelihood Ratio 5585.886 <0.0001
Model Analysis
Parameter Possible Injury Non-Incapacitating Injury Incapacitating Injury Fatal Injury
Coef. Std. Error Pr > χ2 Coef. Std. Error Pr > χ2 Coef. Std. Error Pr > χ2 Coef. Std. Error Pr > χ2
Intercept 0.00 0.19 0.98 0.83 0.18 <0.0001 −0.69 0.22 0.00 −4.42 0.50 <0.0001
Area - - - 0.27 0.06 <0.0001 0.21 0.13 0.11
Should Width - - - 0.03 0.01 0.00 0.09 0.02 <0.0001
AADT 0.002 0.000 <0.0001 - - - 0.002 0.001 0.024
Truck Factor - - - 0.02 0.01 0.03
Post Speed - - - 0.01 0.00 <0.0001 0.03 0.00 <0.0001 0.03 0.01 <0.0001
Alcohol Drug −0.17 0.03 <0.0001 0.11 0.04 0.00 0.11 0.05 0.02 1.33 0.09 <0.0001
Lighting - - - −0.15 0.05 0.00 −0.39 0.11 0.00
Rain - - - −0.28 0.06 <0.0001 −0.19 0.08 0.02 - - -
Road Wet 0.09 0.04 0.02 - - - −0.18 0.07 0.01 - - -
Divided 0.08 0.04 0.02 0.11 0.04 0.01 - - - 0.82 0.19 <0.0001
Vision Block −0.12 0.06 0.04 −0.22 0.07 0.00 - - - -
Single Vehicle 0.40 0.07 <0.0001 0.61 0.07 <0.0001 0.60 0.08 <0.0001 0.37 0.16 0.02
Rear End 0.66 0.05 <0.0001 0.24 0.05 <0.0001 - - - -
Head On 0.72 0.09 <0.0001 0.77 0.10 <0.0001 0.95 0.13 <0.0001 1.17 0.25 <0.0001
Angle 0.51 0.06 <0.0001 0.63 0.06 <0.0001 0.57 0.08 <0.0001 - - -
Left Turn 0.79 0.08 <0.0001 0.96 0.08 <0.0001 1.13 0.11 <0.0001 - - -
Right Turn - - - −0.48 0.21 0.02 −0.83 0.37 0.03 - - -
SideSwipe −0.28 0.06 <0.0001 −0.59 0.07 <0.0001 −0.89 0.10 <0.0001 −2.01 0.27 <0.0001 Fixed Object −0.23 0.06 <0.0001 −0.41 0.05 <0.0001 −0.47 0.06 <0.0001 −0.63 0.13 <0.0001 Automible −1.05 0.16 <0.0001 −2.46 0.13 <0.0001 −3.13 0.14 <0.0001 −3.57 0.19 <0.0001 Truck Bus −1.23 0.16 <0.0001 −2.64 0.14 <0.0001 −3.17 0.14 <0.0001 −3.42 0.20 <0.0001
Bike 1.34 0.43 0.00 - - - -
No Safety Protection −0.13 0.05 0.01 0.40 0.05 <0.0001 1.04 0.05 <0.0001 2.09 0.09 <0.0001
DOI: 10.4236/jtts.2019.94028 456 Journal of Transportation Technologies On the contrary, sideswipe and collisions with fixed objects are less likely for the drivers of being involved in the injury outcomes. For the vehicle type, crash-es with bikcrash-es involved are found to be significant likely to involve in possible in-jury. It is intuitive that not using safety equipment (seat belt, air bag, helmet, etc.) during the crash significantly increases the possibility of non-incapacitating injury, incapacitating injury, and fatal injury. The finding suggests that the using these safety protections is extremely important to reduce the injury levels, espe-cially the fatal injury at night.
The result for the variable, age, is counter-intuitive. Younger drivers tend to be more likely involved in non-fatal injuries. This finding is quite different from the previous study [5]. It might be reason that the high percentages of young drivers are alcohol or drug involved during the night time. During the night time, drivers are likely to operate at a relatively high speed, younger drivers are easily get distracted and have less driving experience compared to senior drivers. Thus, a more severe consequence might occur at night.
The signs for the four variables, shoulder width, rain, wet, and divided, are a little counter intuitive. For shoulder width on the right side, it could be a varia-ble associated with road type, while the road shoulder is generally wider in the rural area than the urban area where severe injury levels are likely to occur. When it was raining or the road condition is wet, drivers are less likely to in-volve in incapacitating injury. The probable reason could be the driver behavior when drivers might be more cautious if it was raining or the road was wet. It might also correlate with the traveling speed, drivers usually travel at a relatively lower speed during these conditions which are associated with less severe injury outcomes.
The positive sign for the divided indicate the divided construction in the me-dian are likely for drivers of being possible injury, non-incapacitating injury and fatal injury compared to when the median is open to grass. It is possibility that drivers could operate or take evasive maneuvers during a crash in a median without barrel or divided construction.
2) Analysis of Odds Ratios
The odds ratios were computed for each significant explanatory variable, as listed in Table 3. The ratios represent the probability of one injury outcome over the probability of the base injury outcome (no injury) for increasing one unit of an explanatory variable while others hold constant. If OR is greater than 1, it is likely increasing the probabilities of injury outcomes; if OR is less than 1, it is likely to decrease the probabilities of the injury outcomes. For example, the probability of being in a fatal injury from urban to rural area is 1.23 times as no injury for freeways. The odds ratios for posted speed limit are larger than one which indicates the higher post speed limits slightly increase the injury outcomes at the freeway segments.
DOI: 10.4236/jtts.2019.94028 457 Journal of Transportation Technologies
Table 3. Calculated odds ratio for injury levels vs. no injury.
Parameter Injury Levels Ratio
Shoulder Width
Incapacitating Injury 1.307
Fatal Injury 1.230
Incapacitating Injury 1.026
Fatal Injury 1.090
AADT
Possible Injury 1.002
Fatal Injury 1.002
Fatal Injury 1.020
Non Incapacitating Injury 1.013
Incapacitating Injury 1.029
Fatal Injury 1.032
Alcohol Drug
Possible Injury 0.845
Non Incapacitating Injury 1.113
Incapacitating Injury 1.114
Fatal Injury 3.770
Incapacitating Injury 0.864
Fatal Injury 0.676
Non Incapacitating Injury 0.753
Incapacitating Injury 0.823
Road Wet Possible Injury 1.099
Incapacitating Injury 0.832
Divided
Possible Injury 1.088
Non Incapacitating Injury 1.117
Fatal Injury 2.281
Vision Block Possible Injury 0.885
Non Incapacitating Injury 0.804
Single Vehicle
Possible Injury 1.489
Non Incapacitating Injury 1.839
Incapacitating Injury 1.821
Fatal Injury 1.441
Rear end Possible Injury 1.931
Non Incapacitating Injury 1.277
Head On
Possible Injury 2.048
Non Incapacitating Injury 2.156
Incapacitating Injury 2.595
Fatal Injury 3.227
Angle
Possible Injury 1.661
Non Incapacitating Injury 1.878
DOI: 10.4236/jtts.2019.94028 458 Journal of Transportation Technologies Continued
Left Turn
Possible Injury 2.201
Non Incapacitating Injury 2.606
Incapacitating Injury 3.105
Fatal Injury 1.231
Right Turn
Possible Injury 0.893
Non Incapacitating Injury 0.622
Incapacitating Injury 0.438
Fatal Injury <0.001
Side Swipe
Possible Injury 0.758
Non Incapacitating Injury 0.554
Incapacitating Injury 0.412
Fatal Injury 0.135
Fixed Object
Possible Injury 0.795
Non Incapacitating Injury 0.667
Incapacitating Injury 0.625
Fatal Injury 0.531
Automobile
Possible Injury 0.349
Non Incapacitating Injury 0.086
Incapacitating Injury 0.044
Fatal Injury 0.028
Truck Bus
Possible Injury 0.293
Non Incapacitating Injury 0.072
Incapacitating Injury 0.042
Fatal Injury 0.033
Bike Possible Injury 3.811
No Safety Protection
Possible Injury 0.879
Non Incapacitating Injury 1.493
Incapacitating Injury 2.832
Fatal Injury 8.118
Age
Possible Injury 0.997
Non Incapacitating Injury 0.996
Incapacitating Injury 0.997
DOI: 10.4236/jtts.2019.94028 459 Journal of Transportation Technologies
5. Conclusions
This study investigated the crash contributing factors to the injury outcomes and the characteristics of the night time crashes at freeways mainline sections. The multinomial logit model was developed to estimate the contributing factors, in-cluding driver conditions, geometric conditions, vehicle conditions, crash condi-tions, and environmental condicondi-tions, to different injury outcomes for night time crashes. The six-year crash data (2005-2010) were obtained from Florida Crash Annual Report (CAR) System. The data were divided into five datasets based on the five identified locations. Five injury level outcomes, no injury, possible in-jury, non-incapacitating inin-jury, capacitating inin-jury, and fatal inin-jury, were consi-dered. The no injury was selected as the baseline category. A total of 45,798 crashes were observed at freeways.
Nighttime crashes at rural areas are likely to be involved in incapacitating in-jury and fatal inin-jury. AADT is only significant for the possible inin-jury and fatal injury. Vision blocked only significant for possible and non-incapacitating in-jury. Drivers involving in rear-end, head-on, angle, and left-turn crashes are likely to suffer in severe injuries. Younger drivers tend to be involved in more non-fatal injuries. It might be contributed by many young drivers during the night time.
When it was raining or the road condition was wet, drivers are less likely to involve in incapacitating injury. The presence of the divided constructions in the median is likely for drivers of being possible injury, non-incapacitating injury and fatal injury compared to when the median is open to grass. For shoulder width on the right side, it could be a variable associated with road type and driv-er behavior, while the road shoulddriv-er is gendriv-erally widdriv-er in the rural area than the urban area where high injury level is likely to occur.
The probability of being in a fatal injury from urban to rural area is 1.23 times as no injury for freeways. Drivers under alcohol or drug influenced are found more likely to be killed, up to 3.77 times at freeways. The probabilities of having street lights decreased to 0.7 times for fatal crashes at freeways to the probability of no injury. Head-on, angle, left-turn crashes are relatively high risky crash types, ranging from 2 to 18 times of the probability of severe injury outcomes (non-incapacitating injury, incapacitating injury, and fatal injury) while right-turn, and sideswipe have lower risks ranging from 0.001 to 0.9 times to the no injury. Having safety protection equipment is a key factor to reduce the injury out-comes. For fatal injury only, it increases the probability up to 8 times at freeway, when no safety equipment was used compared to the protection equipment used. Drivers involving in single vehicle crashes are more likely to be killed which is 1.4 times at freeway segment. Younger people are more likely to in-crease the probability of being non-fatal injury at freeways.
DOI: 10.4236/jtts.2019.94028 460 Journal of Transportation Technologies operating speeds, less cautious and more distracted at divided highways com-pared to undivided ones.
The method can be applied to other types of road conditions, ramps, intersec-tions, major and minor arterials, etc. The findings from this study could help the engineers and researchers to further select the effective countermeasures or poli-cies to potentially reduce the night time crashes, especially the injury severity le-vels.
The authors suggest more efforts should be made to increase the using of safety equipment, e.g. safety belt, air bag, helmet, at night which could signifi-cantly reduce the possibilities of injury outcomes, especially fatal injury levels. Efforts on awareness of risks of speeding, alcohol, or drug impacts, is also strongly recommended. Installation of street light is the most effective way to reduce the injury outcomes. Young drivers should be aware of the risk of driving at freeway. Further investigations on these divided highways are strongly rec-ommended to find the possible reasons of high probability of injury outcomes compared to not divided highways.
Conflicts of Interest
The authors declare no conflicts of interest regarding the publication of this pa-per.
References
[1] National Highway Traffic Safety Association (NHTSA) (2007) Passenger Vehicle Occupant Fatalities by Day and Night—A Contrast. Washington DC.
[2] Hawkins, N., Hallmark, S., Smadi, O., Kinsenbaw, C., Orellana, M., Hans, Z. and Isebrands, H. (2008) Strategies to Address Nighttime Crashes at Rural, Unsignalized Intersections. Final Report, Center for Transportation Research and Education, Iowa State University, Ames.
[3] Elvik, R. (1997) Meta-Analysis of Evaluations of Public Lighting as Accident Coun-termeasure. Transportation Research Record, 1485, 112-123.
[4] Griffith, S.M. (1994) Comparison of the Safety of Lighting Options on Urban Free-ways. Public Roads, 58, 8-15.
[5] Ye, F. and Lord, D. (2014) Comparing Three Commonly Used Crash Severity Mod-els on Sample Size Requirements: Multinomial Logit, Ordred Probit and Mixed Lo-git Models. Analytic Methods in Accident Research, 1, 72-85.
[6] Xie, Y., Zhao, K. and Huynh, N. (2012) Analysis of Driver Injury Severity in Rural Single-Vehicle Crashes. Accident Analysis and Prevention, 47, 36-44.
https://doi.org/10.1016/j.aap.2011.12.012
[7] Geedipally, S.R., Turner, P.A. and Sunil, P. (2011) Analysis of Motorcycle Crashes in Texas with Multinomial Logit Model. Transportation Research Record, 2265, 62-69.https://doi.org/10.3141/2265-07
DOI: 10.4236/jtts.2019.94028 461 Journal of Transportation Technologies Motor-Vehicle Crashes: A Heteroskedastic Logit Analysis. Accident Analysis and Prevention, 40, 1695-1702.https://doi.org/10.1016/j.aap.2008.06.005