ISSN Print: 2327-5219
DOI: 10.4236/jcc.2019.77013 Jul. 12, 2019 135 Journal of Computer and Communications
Design & Implementation of an Optimization
Loading System in Electric by Using Genetic
Algorithm
Ali Abdulhafidh Ibrahim, Anmar L. Dawood
College of Business Economics, Al-Nahrain University, Baghdad, Iraq
Abstract
The purpose of this paper is to propose a new system for the distribution of electric power by using the concept of Active Demand procedures to obtain a low cost and ensure the continuity of energy. This paper consists of two parts: the first includes the method of optimal distribution of electricity in the presence of Active Demand based on the price of energy for the specific time in the system; this feature will help the consumer to determine the process of consumption through the advertised price; all this will appear through the energy box. The second part involves the introduction of the genetic algo-rithm to obtain the best solutions for costs and also the best choice for the distribution of electrical power, which makes this method optimize by intro-ducing the genetic algorithm with electrical energy. The main drivers of this work are to provide continuous electrical energy at the lowest cost and also to simulate active demand, in addition to the rapid processing of energy failures by the aggregator and raising awareness of the process of energy conservation for the consumer.
Keywords
Power Distribution System, Genetic Algorithm, Active Demand
1. Introduction
Electricity consumption in general has become increasingly important. Electric-ity consumption without energy conservation contributes to the increase in in-terruption and leads to higher bills; the importance of rationalizing electrical energy is that it is one of the main pillars of the optimal exploitation of fossil energy sources such as petroleum and its derivatives used in power plants, which How to cite this paper: Ibrahim, A.A. and
Dawood, A.L. (2019) Design & Implemen-tation of an Optimization Loading System in Electric by Using Genetic Algorithm. Journal of Computer and Communications, 7, 135-146.
https://doi.org/10.4236/jcc.2019.77013
Received: May 6, 2019 Accepted: July 9, 2019 Published: July 12, 2019
Copyright © 2019 by author(s) and Scientific Research Publishing Inc. This work is licensed under the Creative Commons Attribution International License (CC BY 4.0).
http://creativecommons.org/licenses/by/4.0/
DOI: 10.4236/jcc.2019.77013 136 Journal of Computer and Communications helps to preserve these sources for future generations [1].
Power distribution reliability is a unique topic in the electric power industry due to its high impact on the cost of electricity and its high correlation with cus-tomer satisfaction [2].
Since distribution systems account for up to 90% of all customer reliability problems, improving distribution system reliability is the key to improving cus-tomer reliability. To make effective improvements, a basic understanding of dis-tribution system (functions, subsystems, equipment, and operation) is required [2].
From the customer viewpoint the power system reliability means uninter-rupted power supply starting from generation to the consumers. The reliability of a power system is affected by the frequency (number of interruptions during an analysis period), duration (the time of the interruption), and extent of the in-terruption (how many customer loads are interrupted). From the Scientists point of view, reliability assessment depends on determining mathematically the frequency and duration of customer interruptions [3]. Thus using aggregator will play an important role in the process of non-interruption of energy.
The electricity sector bears a large burden of electricity production to cover the peak loads, which only take a limited number of hours during the year. Therefore, it is necessary to inform citizens of the importance of rationalization and its benefits for the migration of unnecessary loads outside the peak time. The most important challenge to solve the problem is how to make the simula-tion for the consumer understandable so that the consumer can respond to the request submitted in the event of any increase in demand or failure in the processing of power in a particular area (active demand).
The work presented in this research is arranged in five departments contain-ing the present department as follows:
Department Two: Proposed Methodology: Main Steps 1) Power distribution system in the presence of Active Demand 2) Genetic Algorithm
3) Experimental Results
Department Three: Conclusions Department Four: References
2. Proposed Methodology: Main Steps
The proposed methodology for two methods of identification of the energy dis-tribution system (AD) is discussed and includes the following sections, a brief discussion of the distribution method of the electrical energy of the proposed system and how to reduce the cost.
2.1. Power Distribution System in the Presence of Active Demand
con-DOI: 10.4236/jcc.2019.77013 137 Journal of Computer and Communications sumers, will add a new dimension to the problem of load forecasting, thus pro-viding the load currently available for the most appropriate prediction tech-niques. It was approach in smart networks is based on analysis of the load in its components. They are the base load (representing different seasonal patterns) and the proposed approach will be outlined through a numerical example here simulating the effects of active demand. The main idea is that small business and consumers will play an active role in system electricity, and adjusting their con-sumption patterns based on the dynamics of the electricity markets thus, the new represents an opportunity to solve and support network constraints and develop renewable energy sources through flexibility that can be modified and that may provide economic benefits to all consumers [4].
Aggregator is a device that simulates the active demand in a particular area and within a certain time, the aim is to try to reach the best distribution of elec-tric power and try to avoid the interruption of elecelec-tricity by rationalizing the process of consumption and try to give up unnecessary electricity, and for the mechanism of work of the Aggregator will be addressed later [5].
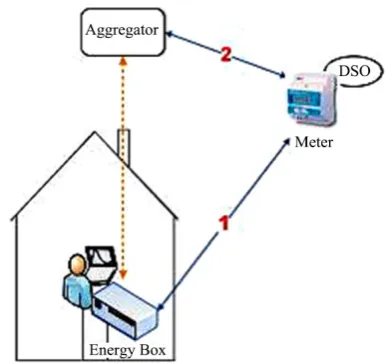
2.1.1. The Aggregator
The network is made up of active demand from the distribution system opera-tor, which contains many aggregators (see Figure 1). Each aggregator has con-sumers who are made up of small business customers and individual concon-sumers. The distribution system operator asks the aggregator to increase or decrease power consumption in a particular area with specific time. The aggregator re-sponds to the operator of the distribution system by sending a signal to con-sumers asking them to change their energy consumption over a specified period of time. The consumer has the option to respond or not to the aggregator. The aggregators force the consumers to change his energy consumption by sending them a signal telling them that the price of KWH is higher or lower at a given time, or by telling them that they will receive the bonus price if their energy consumption is different. The consumer will find it useful to change his energy pattern so that he gets the price of the bonus or even the electricity bill. For ex-ample, if power consumption is high in a given area, the aggregator may ask consumers to reduce their consumption, so that the network avoids overload or imbalance, and customers may respond by delaying a particular task (such as running a washing machine) at a different time. Other reasons the aggregator is required to reduce energy are when the KWH market price is high, when the weather is too cold or too hot. For example, if the renewable energy device oper-ates in a given area and the power consumption in this area is low, the distribu-tion system operator may ask the aggregator to increase power consumpdistribu-tion. The aggregator responds to the distribution system operator by sending a signal to customers that the KWH at a specific time is low so that consumers increase their consumption [4] [5].
In Figure 2, the aggregator communicates with the consumer by means of the
hypo-DOI: 10.4236/jcc.2019.77013 138 Journal of Computer and Communications thesis the energy box (EB) sends a signal to the distribution system operator about the consumption. The distribution system operator investigates the data from consumer by energy box, makes the appropriate decision and sends a sig-nal to the aggregator, which sends the sigsig-nal back to the energy box so that the customer changes its load consumption mode. The energy box sends a feedback about the customer decision, to the distribution system operator that sends it to the aggregator.
2.1.2. The Relation between the Energy Demand and the Supply Demand
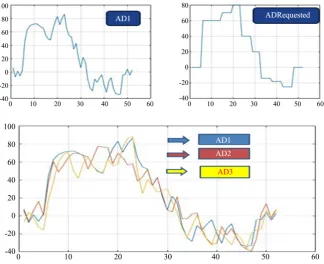
[image:4.595.211.538.259.470.2]Through this method and using the program Matlab and make some important changes, including the introduction of the aggregator to the program enabled us to obtain three possibilities for the demand for electricity, including:
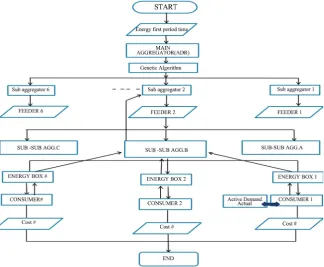
Figure 1. The main stages of the power distribution of the proposed system using method least squares exponential.
[image:4.595.276.469.511.693.2]DOI: 10.4236/jcc.2019.77013 139 Journal of Computer and Communications 1) If the demand for energy is greater than the supply.
2) If the demand for energy is equal to the supply. 3) If the demand for energy is less than the supply.
In these three cases, the first case is important because the required amount of energy is greater than the quantity offered (see Figure 3).
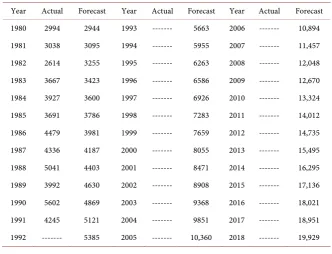
Where the requested energy of the consumer is determined by a least square exponential method (see Table 1). The consumer begins to determine the amount of energy based on the price declared by the energy box, where there is a relationship between the sub-sub aggregator and the energy box begins to de-termine the actual amount of energy per consumer and therefore these com-pounds send a signal to the aggregator connected to the main feeder by increas-ing the amount of energy or reduce it. This will equalize the amount of energy required and actual [6] [7].
[image:5.595.212.537.344.608.2] [image:5.595.210.540.654.726.2]By implementing the Matlab simulation program and adding the aggregator to it, have been able to get three types of energy demand and what concerns us is when the demand for energy is more than supply as shown Figure 3 in the blue curve.
Figure 3. Matlab output AD curve based on the aggregator.
Table 1. The simulate data of the peak load from 12 years.
Years 1980 1981 1982 1983 1984 1985 1986 1987 1988 Peak 2994 3038 2614 3667 3927 3691 4479 4336 5041 Years 1989 1990 1991
DOI: 10.4236/jcc.2019.77013 140 Journal of Computer and Communications
2.1.3. Least Square Method
In this method used the equation
x
y ab= (1) where y is the forecasted load, x is the number of years forecasted. A represents the initial load and b represents the load growth rate.
We can calculate a and b by using the following equations [3]:
1
1
Loga=n
∑
ni=logyi2
1 1
Logb=
∑
ni= xilogyi∑
in= xi (2)where n is the number of years of previous data.
By replacing the regression coefficient, a and b, in Equation (1) and replacing the value of x we can get the forecasted peak load.
Example 1:
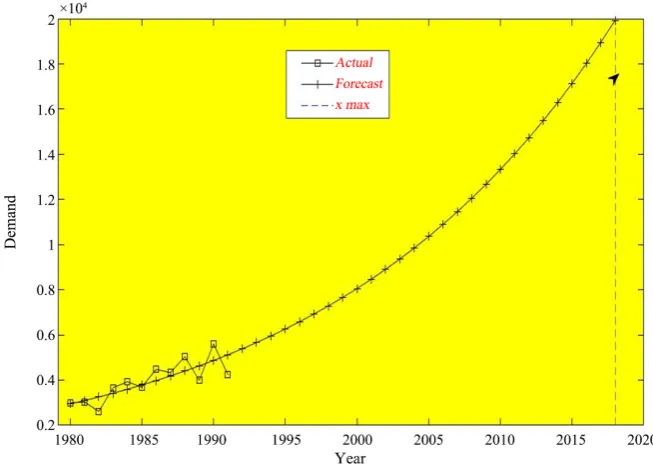
The average rate of growth and the forecasted demands for the next (27) years are simulated in the matlab program. As shown in Table 2 and Figure 4.
Figure 5 shows how time is distributed on sectors where the number (1)
[image:6.595.207.540.477.731.2]represents the industrial sector, which is very important in the first period of the day, which is from 8 am to 4 pm, where most of the vital installations in the work period, so the consumer has to reduce energy in homes because Most con-sumers at work thus reduce unnecessary energy in his home. Depending on the high energy prices for domestic consumers to try to persuade them to conserve energy. As for the number (2), it represents the trade and services sector, which is less important than the industry sector because it needs semi-stable energy. As
Table 2. Matlab output data based on the least exponential method and rate of growth 5.16%.
DOI: 10.4236/jcc.2019.77013 141 Journal of Computer and Communications Figure 4. Matlab output curve based on the least exponential method.
Figure 5. Explains the five sectors and how time is allocated to them.
for the number (3), which represents the agriculture sector, it also does not need a lot of energy and the amount of energy is also semi-stable. The number (4) represents the public sector, which needs different amounts of energy according to the size of its establishment. The number (5) represents the housing sector, which plays an important role in energy conservation.
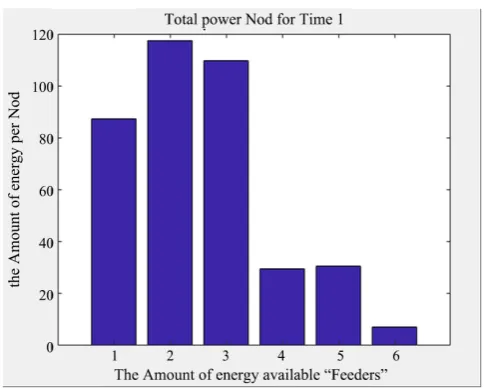
DOI: 10.4236/jcc.2019.77013 142 Journal of Computer and Communications Figure 6. The amount of energy obtained by each feeders.
2.2. Genetic Algorithm
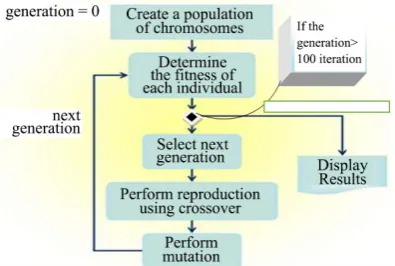
Genetic algorithm is one of the most important tools of artificial intelligence as the program of the genetic algorithm is characterized by the characteristics of the smart program, namely (thinking, conclusion and learning) and this is what the smart program differs from other traditional programs. Genetic algorithms are an important technique in the search for the best option of a set of solutions available for a specific design. Genetic manipulation passes the optimal advan-tages through successive breeding processes and strengthens these traits. These traits have the greatest ability to enter reproduction, produce an optimal genera-tion, by repeating the genetic cycle, the quality of the generation gradually im-proves (see Figure 7).
The mechanism of the genetic algorithm starts with the choice of the chro-mosome (Population) data set. Data is often represented in binary system. Also calculate the optimization function (fitness function) for each chromosome, which is the function of evaluating the intermediate and final results. The basic stages of the algorithm are as follows:
1) Selection: process of selecting the best individuals based on the optimization function.
2) Crossover: process of generating a new generation through the mating of the best individuals that have been chosen. This process is often carried out by the exchange of half-representation between parents.
3) Mutation: process of changing some of the characteristics of the generation resulting from the crossover process with the aim of improving it, and is of-ten the change of the value of one or the change of location with another. 4) The algorithm ends with the evaluation of the new generation based on the
DOI: 10.4236/jcc.2019.77013 143 Journal of Computer and Communications Figure 7. Proposed system architecture using genetic algorithm.
2.3. Experimental Results
The proposed system was tested by its implementation in the Matlab program and the positive results were obtained. At the beginning of the system, the im-portant division of the day was determined for the time and the prices of each time were also set. The total estimate of the energy produced by the generator was determined and distributed to the feeders. The demand was obtained from the aggregator where the demand for energy is greater than the supply. The sys-tem was run, power was distributed and distribution was obtained but not the best (see Figure 8), but after the introduction of the genetic algorithm, the op-timal distribution was achieved and the cost was reduced by about half.
Through the use of genetic algorithm (see Figure 9), we have been able to ob-tain the best distribution possible and the lowest cost and at the same time there is no deficit in the electricity in a given region by responding to prices imposed during first time period. The aggregator has a great role by keeping the consum-er in touch with the system and giving it continuous updates. All this contri-buted to the process of rationalizing electrical energy and thus reduce waste of resources and reduce the load on the generator.
2.3.1. Genetic Algorithm for Reduce Cost
DOI: 10.4236/jcc.2019.77013 144 Journal of Computer and Communications
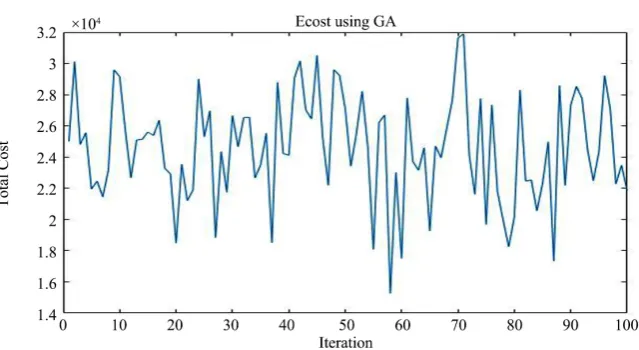
Figure 11 shows the final cost. It is noted from the index that there is high
[image:10.595.263.486.314.503.2]volatility in the cost for each node. So can reduce the cost because the genetic algorithm has been introduced into the way the system works to get fitness func-tion to avoid wasting resources.
[image:10.595.217.533.551.708.2]Figure 8. Genetic algorithm flow chart.
Figure 9. The chart shows how to optimize energy distribu-tion in first time period, after using G.A.
DOI: 10.4236/jcc.2019.77013 145 Journal of Computer and Communications Figure 11. Shows ecost for all time after using G.A.
3. Conclusions
1) Figure 9 shows that the proposed distribution system, which is based on time
for each sector, as mentioned above, and also based on the price for energy consumption, has been reached. Through this system, the best distribution of electrical power occurred when the genetic algorithm was introduced into the program and obtained the best solutions for distribution.
2) Figure 11 shows that the best possible cost was obtained compared with
Figure 10 after the introduction of the genetic algorithm, which led to the
cost reduction by about half.
Conflicts of Interest
The authors declare no conflicts of interest regarding the publication of this paper.
References
[1] https://www.nap.edu/booksearch.php?record_id=9681&term=Electricity+consumption+i
n+general+has+become+increasingly+important.+Electricity+consumption+without+ene rgy+conservation+contributes+to+increase+in+interruption+and+leads+to+higher+bills %2C+the+importance+of+rationalizing+electrical+energy+is+that+it+is+one+of+the+ma in+pillars+of+the+optimal+exploitation+of+fossil+energy+sources+such+as+petroleum+ and+its+derivatives+used+in+power+plants%2C+which+helps+to+preserve+these+sourc es+for+future+generations.+
[2] Brown, R.E. (2002) Electric Power Distribution Reliability. Mareel Dekker, New York.
[3] Chowdhury, A.A. and Koval, D.O. (2009) Power Distribution System Reliability Practical Methods and Applications. IEEE, Press Series on Power Engineering, John Wiley & Sons, Inc., Hoboken, New Jersey, USA,.
[4] Paoletti, S. and Facchini, A. (2011) Load Forecasting for Active Distribution Net-works. 2011 2nd IEEE PES International Conference and Exhibition on Innovative Smart Grid Technologies, Manchester, 5-7 December 2011, 1-6.
https://doi.org/10.1109/isgteurope.2011.6162780
DOI: 10.4236/jcc.2019.77013 146 Journal of Computer and Communications
[6] The ADDRESS Project. http://www.addressfp7.org/
[7] Park, D., El-Sharkawi, M., Marks II, R., Atlas, L. and Damborg, M. (1991) Electric Load Forecasting Using an Artificial Neural Network. IEEE Transactions on Power Systems, 6, 442–449. https://doi.org/10.1109/59.76685