ISSN Online: 2169-2688 ISSN Print: 2169-267X
DOI: 10.4236/ars.2019.81003 Mar. 29, 2019 40 Advances in Remote Sensing
Studying the Impact of Pollution from Wadi
Gaza on the Mediterranean Sea Using GIS and
Remote Sensing Techniques
Maher A. El-Hallaq
Islamic University of Gaza, Gaza, Palestine
Abstract
Wadi Gaza is considered as one of the most important coastal wetlands lo-cated on the Eastern Mediterranean Basin. It is witnessing rapid degradation due to anthropogenic activities including but not limited to discharge of mu-nicipal sewage, dumping of solid wastes, rampant use of pesticides and illegal poaching. They form a river of untreated wastewater, more than 5 km long, before its discharge into the Mediterranean Sea. This study aims to perform an analytical study of Wadi Gaza and study its effects on the pollution of the seawater opposite to it using GIS and remote sensing techniques. The flow accumulation, the watershed and the stream orders inside and outside the Gaza Strip are determined based on a DEM which involves a radar terrestrial scanning of Palestine carried out by NASA’s Endeavor Space Shuttle. The area of the watershed inside Gaza is estimated to be equal to 58.792 km2. The Study also shows that the total amount of contaminated water that flows into the sea can be estimated to reach 146.5 mm3/year. The total area of coastal sea conta-mination approximately reaches 38.8 km2 and is oriented to the north direc-tion along the coastal shore and its influence extends to Gaza seaport, 10 km apart from the Wadi.
Keywords
Wadi Gaza, GIS, Remote Sensing, Supervised Classification, Contamination
1. Introduction
Wadi Gaza is considered as one of the most important coastal wetlands located on the Eastern Mediterranean Basin. The Wadi is also a station point for the migratory routes from north to south and from south to north. In addition, it’s How to cite this paper: El-Hallaq, M.A.
(2019) Studying the Impact of Pollution from Wadi Gaza on the Mediterranean Sea Using GIS and Remote Sensing
Tech-niques. Advances in Remote Sensing, 8,
40-50.
https://doi.org/10.4236/ars.2019.81003
Received: February 25, 2019 Accepted: March 26, 2019 Published: March 29, 2019
Copyright © 2019 by author(s) and Scientific Research Publishing Inc. This work is licensed under the Creative Commons Attribution International License (CC BY 4.0).
DOI:10.4236/ars.2019.81003 41 Advances in Remote Sensing the biggest in Gaza and having a special outstanding landscape and being one of the biggest in Palestine. Therefore, it has the potential for being a recreational area attracting people from different areas. In recognition of its importance as a natural area and as the only wetland in Palestine, Wadi Gaza was declared as a nature reserve in June 2000. The Ministry of Environmental Affairs (MEnA) re-quested that municipalities should revise their land use plans so that they en-sured that the Wadi bed should be respected as a protected area [1]. Wadi Gaza springs from the Negev hills and the southern heights of Hebron. The length of the Wadi is about 105 km from its source and extends from the borderline in East Gaza to the coast where it discharges into the sea. It is located centrally along the Gaza Strip coast, and is bordered in the north-west by the sea, the south-east by the Bureij Camp, the south-west by the Nuseirat Camp, and the north by Al-Zahra City (Figure 1). The maximum elevation of the Wadi is 30 meters above sea level, dropping to sea level where it reaches the Mediterranean Sea. Its circuitous route through the Gaza Strip reaches 9 km. Its width varies from place to place, and gets wider near its mouth where it reaches about 100 m. The tributaries feeding Wadi Gaza have their sources in the central mountain areas, the low heights north of the Negev, and the west and southwest parts of the Hebron Mountains [2].
2. Problem Statement
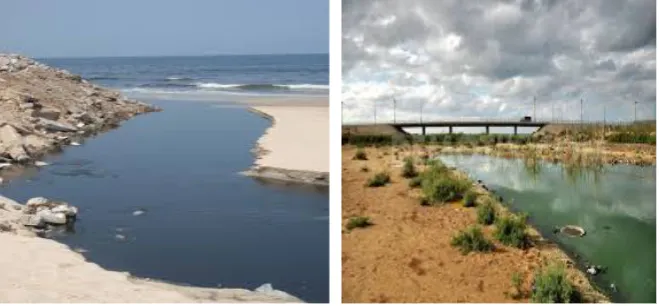
Wadi Gaza is witnessing rapid degradation due to anthropogenic activities in-cluding but not limited to discharge of municipal sewage, dumping of solid wastes, rampant use of pesticides and illegal poaching. Wastewater comes as an effluent from two sources around Wadi Gaza; wastewater treatment plants and sewer systems from the middle area refugee camps. When those two effluents combine, they form a river of untreated wastewater, more than 5 km long, before its discharge into the Mediterranean Sea. Besides wastewater, Wadi Gaza is be-ing used as a landfill for disposbe-ing huge amounts of solid waste and construction debris. The leachate generated from accumulated solid wastes has high conta-minant concentrations which makes the situation more dangerous.
The worsening pollution in Wadi Gaza is having devastating impacts on the ecology, wildlife as well as the public health of the communities around the val-ley involving pollution of the coastal area on the Mediterranean Sea. As a result, the disease-causing bacteria and viruses that enter the water of the Sea can lead to serious consequences on human health in addition to inability of the popula-tion to repose and swim in the sea due to the severe pollupopula-tion. Keeping in mind, Gaza coastal zone has multi functions and provides the area with different re-sources potential which could be classified into economic potential, social po-tential and scientific popo-tential [3]. The Gaza Strip beaches are the only major source of recreation and tourism, a traditional zone for agricultural production as well as the main source of fishery sector.
DOI: 10.4236/ars.2019.81003 42 Advances in Remote Sensing Figure 1. Geographic location of Wadi Gaza.
cubic meters of partially treated sewage from Gaza city every day and discharge it to the Mediterranean Sea. However, now, due to the closure of the Gaza se-wage outlet and the increase in population, the Wadi directly receives up to 14,000 cubic meters of sewage from the middle area every day. Most of the water feeds Wadi Gaza has stopped flowing into the Wadi because the Israeli authori-ties have built dams along the borders with Gaza, diverting all the water to Israel. Water samples taken from water wells and from the seawater opposite the Wadi showed high pollution levels of organic matter, faecal coliforms, faecal strepto-cocci, and heavy metals [4] (Figure 2).
3. Aim and Objectives
This study aims to perform an analytical study of Wadi Gaza and measure its ef-fect on the pollution of the seawater opposite it using GIS and remote sensing techniques. To achieve this aim, the following objectives should be considered: Estimation the watershed and stream orders of the Wadi.
Estimation the amount of contaminated water flows into the sea. Estimation the area of the sea contaminated by Wadi Gaza.
4. Study Area Characteristics
DOI:10.4236/ars.2019.81003 43 Advances in Remote Sensing Figure 2. Wadi Gaza snapshots.
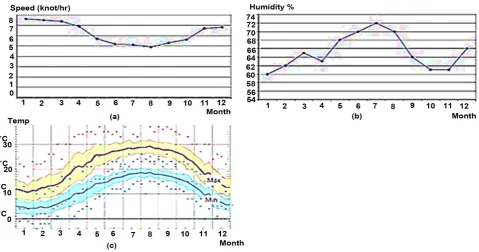
across the Wadi from the southwest. The highest average wind speed in Winter is about 7.3 knots/hour but the highest wind speed for the entire year is about 7.6 knots/hour in January. Wind speed is lowest in Summer, with a seasonal av-erage of about 5 knots/hr. The avav-erage wind speed in spring is lower than in Winter to 6.7 knots/hr. The wind speed in Autumn is 5.6 knots/hour which is lower than its value in Winter and Spring. The terrain is flat or rolling, with dunes near the coast [5]. Figure 3 illustrates some of the study area characteris-tics.
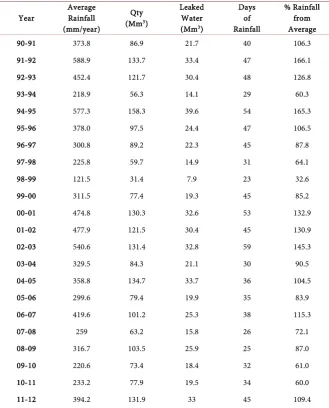
Table 1 illustrates the rainfall data on the study area during the interval be-tween 1990 up to 2012 [6]. The average rainfall on the study area during the months of each year period is shown in Figure 4.
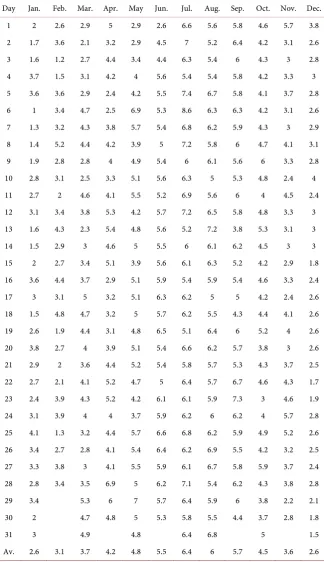
Evaporation is very important since it is a major factor that delineates the wa-ter budget and the general quantity of wawa-ter in the study area. The calculations are based only on the rainy months. Table 2 shows the daily evaporation rate of the study area along the months of a typical year [6].
5. Wadi Gaza Analysis
Analysis involves the estimation of the watershed area and the stream orders of Wadi Gaza. It also includes the estimation of the amount of contaminated water that flows into the sea via Wadi Gaza as well as the estimation of the area of the sea contaminated by this flow.
5.1. Watershed Area and Stream Orders
DOI: 10.4236/ars.2019.81003 44 Advances in Remote Sensing Figure 3. Study Area characteristics. (a) Speed in knot/hr; (b) Humidity %; (c) Temperature in ˚C.
Figure 4. The average monthly rainfall on the study area in mm.
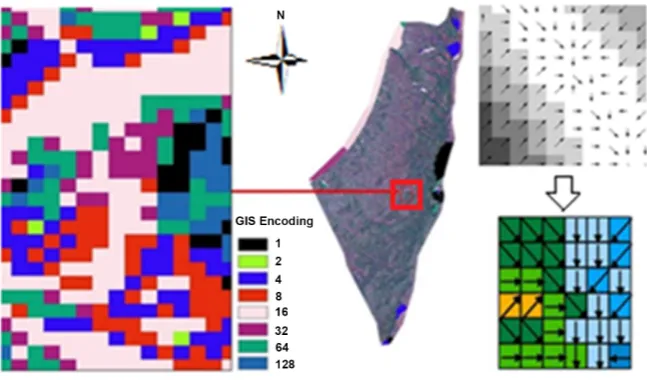
64, 128) (Figure 5). Value 1 indicates that the flow is to the East direction while 2 is to the Southeast, 4 is to the South, 8 is to the Southwest, 16 is to the West, 32 is to the Northwest, 64 is to the North and 128 is to the Northeast direction. Next, the flow accumulation, the watershed and the stream orders can be deter-mined using the GIS tools (Figure 6). The area of the watershed is estimated to equal to 58.792 km2.
5.2. Contaminated Water Flow via Wadi Gaza
[image:5.595.233.515.354.542.2]DOI:10.4236/ars.2019.81003 45 Advances in Remote Sensing Table 1. Rainfall data on the study area for the interval 1990-2012.
Year Average Rainfall
(mm/year)
Qty (Mm3)
Leaked Water (Mm3)
Days of Rainfall % Rainfall from Average
90-91 373.8 86.9 21.7 40 106.3
91-92 588.9 133.7 33.4 47 166.1
92-93 452.4 121.7 30.4 48 126.8
93-94 218.9 56.3 14.1 29 60.3
94-95 577.3 158.3 39.6 54 165.3
95-96 378.0 97.5 24.4 47 106.5
96-97 300.8 89.2 22.3 45 87.8
97-98 225.8 59.7 14.9 31 64.1
98-99 121.5 31.4 7.9 23 32.6
99-00 311.5 77.4 19.3 45 85.2
00-01 474.8 130.3 32.6 53 132.9
01-02 477.9 121.5 30.4 45 130.9
02-03 540.6 131.4 32.8 59 145.3
03-04 329.5 84.3 21.1 30 90.5
04-05 358.8 134.7 33.7 36 104.5
05-06 299.6 79.4 19.9 35 83.9
06-07 419.6 101.2 25.3 38 115.3
07-08 259 63.2 15.8 26 72.1
08-09 316.7 103.5 25.9 25 87.0
09-10 220.6 73.4 18.4 32 61.0
10-11 233.2 77.9 19.5 34 60.0
11-12 394.2 131.9 33 45 109.4
DOI: 10.4236/ars.2019.81003 46 Advances in Remote Sensing Table 2. Daily evaporation rate of the study area in mm.
Day Jan. Feb. Mar. Apr. May Jun. Jul. Aug. Sep. Oct. Nov. Dec.
1 2 2.6 2.9 5 2.9 2.6 6.6 5.6 5.8 4.6 5.7 3.8
2 1.7 3.6 2.1 3.2 2.9 4.5 7 5.2 6.4 4.2 3.1 2.6
3 1.6 1.2 2.7 4.4 3.4 4.4 6.3 5.4 6 4.3 3 2.8
4 3.7 1.5 3.1 4.2 4 5.6 5.4 5.4 5.8 4.2 3.3 3
5 3.6 3.6 2.9 2.4 4.2 5.5 7.4 6.7 5.8 4.1 3.7 2.8
6 1 3.4 4.7 2.5 6.9 5.3 8.6 6.3 6.3 4.2 3.1 2.6
7 1.3 3.2 4.3 3.8 5.7 5.4 6.8 6.2 5.9 4.3 3 2.9
8 1.4 5.2 4.4 4.2 3.9 5 7.2 5.8 6 4.7 4.1 3.1
9 1.9 2.8 2.8 4 4.9 5.4 6 6.1 5.6 6 3.3 2.8
10 2.8 3.1 2.5 3.3 5.1 5.6 6.3 5 5.3 4.8 2.4 4
11 2.7 2 4.6 4.1 5.5 5.2 6.9 5.6 6 4 4.5 2.4
12 3.1 3.4 3.8 5.3 4.2 5.7 7.2 6.5 5.8 4.8 3.3 3
13 1.6 4.3 2.3 5.4 4.8 5.6 5.2 7.2 3.8 5.3 3.1 3
14 1.5 2.9 3 4.6 5 5.5 6 6.1 6.2 4.5 3 3
15 2 2.7 3.4 5.1 3.9 5.6 6.1 6.3 5.2 4.2 2.9 1.8
16 3.6 4.4 3.7 2.9 5.1 5.9 5.4 5.9 5.4 4.6 3.3 2.4
17 3 3.1 5 3.2 5.1 6.3 6.2 5 5 4.2 2.4 2.6
18 1.5 4.8 4.7 3.2 5 5.7 6.2 5.5 4.3 4.4 4.1 2.6
19 2.6 1.9 4.4 3.1 4.8 6.5 5.1 6.4 6 5.2 4 2.6
20 3.8 2.7 4 3.9 5.1 5.4 6.6 6.2 5.7 3.8 3 2.6
21 2.9 2 3.6 4.4 5.2 5.4 5.8 5.7 5.3 4.3 3.7 2.5
22 2.7 2.1 4.1 5.2 4.7 5 6.4 5.7 6.7 4.6 4.3 1.7
23 2.4 3.9 4.3 5.2 4.2 6.1 6.1 5.9 7.3 3 4.6 1.9
24 3.1 3.9 4 4 3.7 5.9 6.2 6 6.2 4 5.7 2.8
25 4.1 1.3 3.2 4.4 5.7 6.6 6.8 6.2 5.9 4.9 5.2 2.6
26 3.4 2.7 2.8 4.1 5.4 6.4 6.2 6.9 5.5 4.2 3.2 2.5
27 3.3 3.8 3 4.1 5.5 5.9 6.1 6.7 5.8 5.9 3.7 2.4
28 2.8 3.4 3.5 6.9 5 6.2 7.1 5.4 6.2 4.3 3.8 2.8
29 3.4 5.3 6 7 5.7 6.4 5.9 6 3.8 2.2 2.1
30 2 4.7 4.8 5 5.3 5.8 5.5 4.4 3.7 2.8 1.8
31 3 4.9 4.8 6.4 6.8 5 1.5
Av. 2.6 3.1 3.7 4.2 4.8 5.5 6.4 6 5.7 4.5 3.6 2.6
DOI:10.4236/ars.2019.81003 47 Advances in Remote Sensing Figure 5. Estimation of flow direction.
5.3. Sea Area Contaminated
A Landsat remotely sensed imagery is downloaded from the U.S. Geological Survey (USGS) website, Landsat archive of December 2016. A full-band imagery in a Geostationary Earth Orbit Tagged Image File Format (GeoTIFF) is used. First, pre-processing of the obtained image which includes radiometric and geometric correction is performed using ERDAS Imagine 2016 software. Prin-cipal Component analysis of the main component of a multi-spectral image has been performed so that the convergence between the primary colors is separated so that each color is easily controlled, and the range is maximized between the smallest value and the largest value. Next, supervised classification is used since the Area of Interest (AOI) is known and clear to be distinguished. Thus, the spectral signatures are developed and then the software assigns each pixel in the image to the type to which its signature is most similar.
Figure 8 shows the satellite image enhancement and classification. GIS tech-niques are used to estimate quantities of seawater polluted as extracted from the classified image using ArcGIS 10.5 software.
Table 3 summarizes the amount of sea pollution divided into three levels based on the degree of contamination. The contamination, as shown in Figure 8(c), is classified into three greyscale areas where each area expresses the amount of pollution in it. The total area of contamination approximately reaches 38.8 Km2 and is aligned to the north direction on the coastal shore and its influ-ence can extend to further than Gaza seaport which is 10 km far from the Wadi, along the coastal shore.
5.4. Discussion
DOI: 10.4236/ars.2019.81003 48 Advances in Remote Sensing (a) (b)
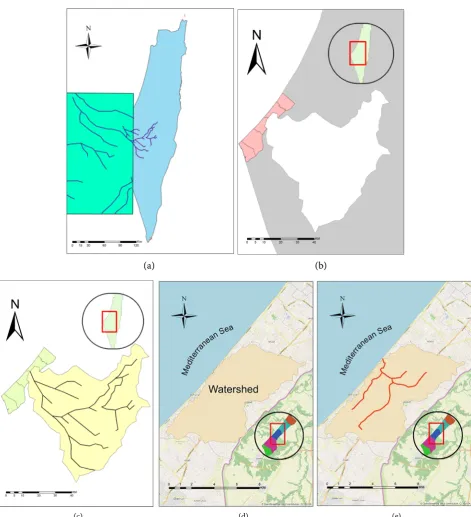
[image:9.595.63.535.64.582.2](c) (d) (e) Figure 6. (a) Flow accumulation; (b) watershed; (c) stream orders; (d) Gaza watershed; (e) Gaza stream orders.
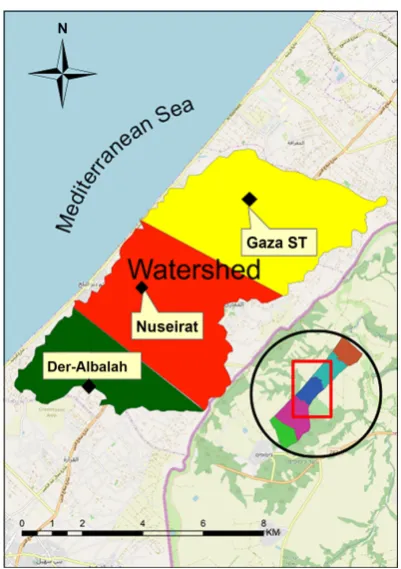
DOI:10.4236/ars.2019.81003 49 Advances in Remote Sensing Figure 7. Watershed division by rainfall stations.
Figure 8. Satellite imagery analysis. (a) Landsat image; (b) Principal Component analysis; (c) Supervised classification result.
Table 3. Amount of seashore contamination.
ID Contamination Level of Contamination Area (Km2)
1 High Degree 2.9
2 Medium Degree 8.3
3 Low Degree 27.6
Total 38.8
DOI: 10.4236/ars.2019.81003 50 Advances in Remote Sensing The study results highlight an environmental alert to the local authorities to face the resulting risk through activating the natural area of the Wadi and find a proper solution to the wastewater problem. A wastewater treatment plant is very essential to serve the middle area and households should be connected to a pumping station in order to pump the sewage to this plant. The donor organiza-tions should devote more funds to treat the harmful impact of this problem. In addition to, several future studies should be carried out to study the impact of this contamination from Wadi Gaza on the pollution of the groundwater as well as marine organisms and on persons bathing in the sea opposite it.
6. Conclusion and Recommendations
The flow accumulation, the watershed and the stream orders inside and outside the Gaza Strip are determined based on a DEM which involves a radar terrestrial scanning of Palestine carried out by NASA’s Endeavor Space Shuttle. The area of the watershed inside Gaza is estimated to be equal to 58.792 km2. The study also shows that the total amount of contaminated water that flows into the sea can be estimated to reach 146.5 mm3/year. The total coastal sea area of contamination approximately reaches 38.8 km2 and is aligned to the north direction on the coastal shore and its influences can extend further than Gaza seaport, 10 km apart from the Wadi. It is strongly recommended to consider the output of this study into account by setting laws and legislations for the preservation of Wadi Gaza environment as well as solving the problem of wastewater and removing it from the valley area.
Acknowledgements
Deep thanks go to Eng. Essa Tartouri and Eng. Ali Hamada for their hard effort and assistance during data collection stage.
References
[1] Abd Rabou, A.F.N., Yassin, M.M., Al-Agha, M.R., Hamad, D.M. and Ali, A.K.S. (2007) The Avifauna of Wadi Gaza Nature Reserve, Gaza Strip—Palestine. The Is-lamic University Journal (Series of Natural Studies and Engineering), 15, 39-85. [2] United Nations Educational Scientific and Cultural Organization (UNESCO) (2018)
Wadi Gaza Coastal Wetlands. https://whc.unesco.org/en/tentativelists/5722/ [3] Afifi, S. (2008) Seawater, Shellfish & Fish Quality Assessment in Gaza Strip.
Propos-al Concept Document, PPropos-alestine, 36 p.
[4] The International Committee of the Red Cross (ICRC) (2011) Environmental Base-line Study for Wadi Gaza. ICRC, Gaza.
[5] Thabit, A. (2011) The Climate and Its Impact on Human Comfort and Health in West Bank and Gaza Strip—Palestine. Master Thesis, Faculty of Geography, The Is-lamic University of Gaza, Gaza, 187 p. (In Arabic)
[6] Coastal Municipalities Water Utility (CMWU) (2016) Monthly Rainfall and Evapo-ration Statistics. CMWU, Gaza.