Journal of Water Resource and Protection,2011, 3, 235-244
doi:10.4236/jwarp.2011.34030 Published Online April 2011 (http://www.scirp.org/journal/jwarp)
Predicting Phosphorus Sorption onto Steel Slag Using a
Flow-through Approach with Application to a Pilot Scale
System
Chad J. Penn, Joshua M. McGrath Oklahoma State University, Oklahoma, USA E-mail: [email protected]; [email protected]
Received February 11, 2011; revised March 11, 2011; accepted March 31, 2011
Abstract
Reducing phosphorus (P) loads from soils to surface waters is necessary for solving the problem of eutrophication. Many industrial by-products have been shown to sorb appreciable amounts of dissolved P from solution and it has been proposed to use P sorption materials (PSMs) such as steel slag in landscape scale “filters” for trapping dissolved P in runoff. The objective of this study was to model the effect of retention time (RT) and P concentration on P sorption by steel slag and a surface modified slag in a flow-through system. Sorption of P onto steel slag and rejuvenated-modified steel slag was measured using a traditional batch isotherm and a flow-through setting at several RTs and P concentrations. Flow-through data were used to produce a model that estimated P sorption based on RT and P concentration. The model was tested on a pilot-scale pond filter consisting of the same slag materials. For both the materials, flow-through tests indicated an increase in RT increased P removal efficiency but decreased the total amount of P removed at saturation. The Langmuir model developed from batch isotherms overestimated and underestimated P sorption in normal and rejuvenated slag respectively, relative to flow-through. Normal and rejuvenated slag removed 38 and 36% of P in the pilot-scale pond filter after 2 weeks of pumping. The Langmuir equation poorly predicted P sorption in the pond filter while the flow-through model produced reasonable estimates. Results suggest that flow-through methodology is necessary for estimating P sorption in the context of landscape P filters.
Keywords: Phosphorus, By-Products, Phosphorus Removal Structure
1. Introduction
Input of phosphorus (P) to surface waters can contribute to eutrophication of receiving water bodies. Potential sources of P to surface waters include waste-water treatment plants, horticultural operations, and runoff from agricultural and urban/suburban land (including golf courses). In regard to runoff, dissolved P is the most difficult form to control since particulate losses are typically controlled by maintaining sufficient soil cover and reducing erosion [1]. Dissolved P loads in runoff are greatest from soils that are high in soil test P and soils with recent surface applications (not incorporated) of P [2-3].
Previous research has shown that application of P sorbing materials (PSMs) directly to high P soils or to animal manures prior to land application can reduce losses of dissolved in runoff during rainfall events [4-5].
However, such reductions in P runoff concentrations may be temporary since P is not truly removed from the system [6-7]. As an alternative, it has been suggested that PSMs could be used in a “P removal structure” or a constructed, isolated structure for treating P rich runoff prior to reaching surface bodies of water [8]. Penn et al. [7] constructed a P removal structure in a surface water drainage ditch located on the Eastern Shore of Maryland, U.S. This structure contained an iron rich by-product that possessed a high P sorption capacity. In a single rainfall event that lasted nearly 18 h, the structure removed 99% of the dissolved P that entered it. One disadvantage of this material was that it had low hydraulic conductivity; therefore the amount of water that could be treated was limited.
Several studies have evaluated this Ca and Fe rich waste in regards to treating wastewater streams [9-10]. In addition, McDowell et al. [11] found that a mixture of “basic” and “melter” slag backfilled around subsurface drainage pipes overlaid by P rich topsoils was able to significantly reduce dissolved P concentrations in drainage waters. In another study, Shilton et al. [9] utilized a melter slag as a filter material at a wastewater treatment plant for 11 years and found that 77% of total P was removed during the first 5 yrs of operation.
Based on the success of these field scale experiments, it is likely that steel slag would also serve well in removing P from passing runoff water in a P removal structure. However, the P sorption potential of steel slag will likely depend on the incoming P concentration and the contact or retention time (RT) of the solution with slag. In order to estimate the effectiveness and longevity of steel slag in P removal structures, it is necessary to examine the impact of solution P concentration and RT on P sorption. Many studies on P sorption onto slag have utilized a batch isotherm experiment [10,12] which may not suitable in the context of P removal structures. Instead, a flow through column or cell may be necessary. In regard to the latter, most flow-through studies on slag have been conducted at high retention times (> 1 h) and P concentrations [13-15] that are more suited to wetland treatment systems and wastewater treatment as opposed to P removal structures for treating runoff.
In addition, any potential to increase the useful lifetime in which slag is able to remove P from runoff would likely increase the acceptance of such a practice. Drizo et al. [16] found that by initiating a rest period during P additions to electric arc furnace (EAF) steel slag columns increased the total P sorption capacity of the material. However, chemical treatments to spent slag may also be effective at rejuvenating the P sorption material in situ.
The objective of this study was to model the effect of RT and P concentration on P sorption by slag and a surface modified slag in a flow through setting. Achievement of this objective will provide us with the information necessary for designing a future runoff P removal structure consisting of the same material.
2. Materials and Methods
2.1. General Characterization of Sorption Materials
Electric arc furnace (EAF) slag was collected from a steel mill (Tube City IMS) located in Ft. Smith, AR (U.S.). In order to increase the hydraulic conductivity, the material was sieved to achieve particle size 6.35 to 11
mm. Previous work indicated that non-sieved EAF slag clogged after only 4 d in the pilot scale pond structure. Bulk density of the sieved slag used in all experiments was 1.8 g·cm–3. A surface modified slag product (i.e.
rejuvenated slag) was produced and tested after “spent” P saturated slag was treated with aluminum sulfate in an attempt to rejuvenate the slag. Details on the treatment process for production of the rejuvinated slag is described in detail below under “Large scale pond flow-through experiment”.
All analyses were conducted in triplicate. Material pH was measured with a pH meter using a solid:DI water ratio of 1:5. Alkalinity was determined by automatic titration (TitriLab 865; Radiometer Analytical, Villeurbanne Cedex, France) to pH 4.5 on 2 g material suspended in 20 mL of DI water. Materials were ground prior to analysis of total elements by EPA 3051 digestion method [17]. Digestion solutions were analyzed for Ca, Mg, S, Fe, and Al by inductively coupled plasma atomic emission spectroscopy (ICP-AES). Samples were also extracted with DI water at a 1:10 solid:solution ratio for 1 h followed by filtration with a 0.45 µm filter and analysis for Ca, Mg, S, Fe, and Al by ICP-AES. Each material was also analyzed for crystalline minerals by X-ray diffraction (XRD) on a Philips (now PANayltical; Almelo, Netherlands) powder x-ray diffractometer. Hydraulic conductivity was measured by the falling head method [18].
2.2. Batch Experiment
A standard batch isotherm was conducted on both slag materials using 2 g of sample and 16 h equilibration (shaking) in 30 mL solutions of 0, 1, 10, 25, 50, and 100 mg·P·L–1. P solutions were made using KH
2PO4 and
the matrix solution consisted of 5.6, 132, 110, 10, and 17 mg·L–1 of Mg, Ca, S, Na, and K, respectively
adjusted to a pH of 7. Reagent grade magnesium sulfate, calcium sulfate, sodium chloride, and potassium chloride were used to make the matrix. This matrix was chosen as it was found to be representative of agricultural runoff measured in a previous study [7]. After equilibration, solutions were centrifuged for 15 minutes and filtered through a 0.45 µm filter prior to P analysis by the Murphy-Riley molybdate blue method [19]. P sorption was quantified by the difference bet- ween P concentrations added and the final equilibrated concentrations. These values were applied to a nonlin- ear Langmuir using the following equation:
max
1
S KC
S
KC
(1)
where S is the sorbed P concentration (mg·kg–1), S max is
C. J. PENN ET AL. 237
47 mm
0.45-μm Filter
Constant Water Level
Slag Material and Sand Mixture
Filter Support
Outflow Solution
Peristaltic Pump
Glass Vials (Collection of Samples) 90 mm
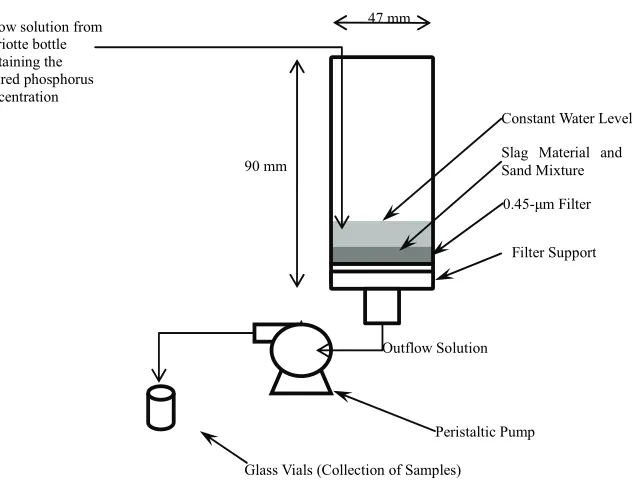
[image:3.595.143.460.73.314.2]Inflow solution from Mariotte bottle containing the desired phosphorus concentration
Figure 1. Diagram of the flow-through cells used to evaluate the effect of retention time and phosphorus concentration on P sorption by slag and rejuvenated slag.
K is the Langmuir binding strength coefficient (L·mg–1),
and C is the equilibrium concentration (mg·L–1). The best
fit model parameters for the non-linear equation were obtained by finding the combinations of parameters that provided the best fit to the observed data. Specifically, this was done by using an Excel (Microsoft, 2003) spreadsheet as prepared and described by Bolster and Hornberger [20]. This program was designed to provide K and Smax values, in addition to the “goodness-of-fit”
indicator, model efficiency (E). An E value of 1 indicates a perfect fit of the data and E < 0 indicates that taking the average of all measured values would give a better prediction than the model [20].
2.3. Laboratory Flow-Through Experiments
To test the effect of retention time (RT) and P concentration on P sorption in a flow-through setting, flow-through cells were constructed as described in Desutter et al. [21]. Two g of slag was mixed with acid washed, lab-grade sand (pure Si sand, 14808-60-7; Acros organics, Morris Plains, New Jersey) in order to achieve a total pore volume of 3.2 cm3 (5 g of sand;
40% porosity) and then was placed in a flow-through cell. A 0.45 µm filter was placed under materials and the bottom of the cell was connected to a single channel peristaltic pump (VWR variable rate “low flow” and “ultra low flow”, 61161-354 and 54856-070) using plastic tubing. The desired RT (RT [min] = pore volume [mL] / flow rate [mL·min–1]) was achieved by
varying the pump flow rate which pulled solution
through the cell (Figure 1). Flow rates required to achieve the desired RTs of 0.5, 3, 6 and 8 min were 6.4, 1.1, 0.53, and 0.40 mL·min–1, respectively. Ess-
entially, the RT is the amount of time required for the solution to pass through the cell. A constant head Mariotte bottle apparatus was used to maintain a constant volume of P solution on the materials. Materials were subjected to flow for 5 h in which the “outflow” from the cells was sampled at 0, 15, 30, 60, 90, 120, 150, 180, 210, 240, 270, and 300 min. Sol- utions were analyzed for P by the Murphy-Riley mol- ybdate blue method and pH (meter). Discrete P sor-ption onto materials was calculated at each sampling time as a percentage decrease in outflow relative to inflow P concentration (i.e. source bottle).
Five different P concentrations were tested; 0.5, 1, 5, 10, and 15 mg·L–1. These P concentrations represent
y = 96.035e-0.0043x R2 = 0.61*
y = 72.321e-0.011x R2 = 0.97*
0 10 20 30 40 50 60 70 80 90 100
0 20 40 60 80 100
y = 78.158e-0.0012x R2 = 0.95*
y = 23.219e-0.0012x R2 = 0.82*
0 10 20 30 40 50 60 70 80 90 100
0 200 400 600 800 1000 1200
P added (mg kg-1)
D isc re te P re mo ve d ( % ) (b)
P added (mg kg-1)
[image:4.595.54.529.74.235.2]D is cr et e P r em ove d ( % ) Normal slag Rejuvenated slag (a)
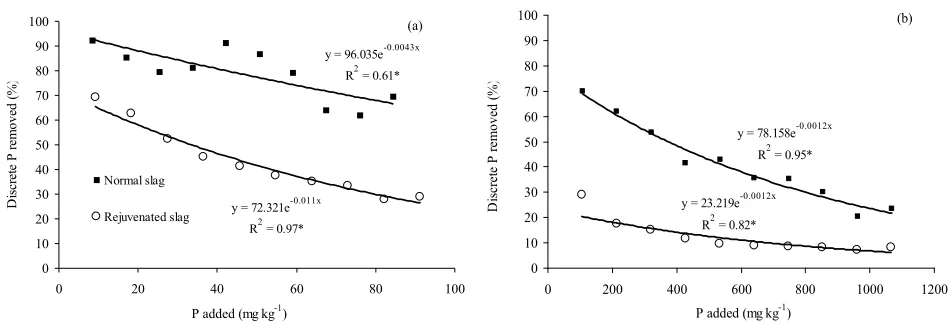
Figure 2. Example P removal curves for normal and rejuvenated slag at (a) 6 minute retention time and 1 mg·P·L–1 solution and (b) 3 minute retention time and 10 mg·P·L–1 solution.
2.4. Large Scale Pond Flow-through Experiments
A large scale flow-through unit was constructed to treat water in a small pond (~ 405 m2) located at the at the
Oklahoma State University turfgrass research farm. This pond receives subsurface drainage from research turfgrass plots and typically displays dissolved P concentrations ~ 0.5 mg·L–1; this was a “closed” system with no spillway.
Please note that the purpose of this experiment was not to remediate the pond, instead the purpose was to test the materials in a flow-through setting at a large scale under more “natural” conditions. The flow-through unit was housed in a small plastic building (Suncast, Batavia, IL) and consisted of a 1 2 horse power electric well pump (RC5, Waterace; Ashland, OH) that delivered pond water into the top of a 960 L stock tank (Wylie polyethylene leg tank, Wylie, TX) that contained 454 kg of sieved slag. A drainage outlet at the bottom of the tank was connected to a 1.27 cm diameter hose which allowed treated water to return back to the pond. The water pump was wired to a float switch (FLT004, Chicago Sensor; Chicago, IL) that prevented overflow of the tank. The pump was also wired to a timer in order to control flow events; water was applied to the slag material for 20 h·day–1 allowing a 4 h
rest period to prevent the pump from overheating. Treated and pre-treated water (i.e. outflow and inflow) was sampled at time 0, 10, and 19.5 h after initiation of a daily flow-through event. For the normal slag material, this occurred for 22 continuous days.
After the normal slag was “spent” (i.e. inflow = outflow P concentration), the material was washed in the tank with clean tap water (to remove sediment). After washing, a treatment process was initiated in situ for slag “rejuvenation”. The idea was to precipitate amorphous Al hydroxide minerals on the surface of the alkaline slag
material. Approximately 134 L of a 0.17 M aluminum sulfate solution (Al2[SO4]3·12H2O) was poured into the
tank (drain plugged), submersing all slag. Slag was “soaked” in the aluminum sulfate solution for 48 h before the drain plug was removed and all drainage water was collected and disposed of. This “rejuvenated slag” was allowed to air dry for one week. Approximately 1 kg of the rejuvenated slag was removed from the tank for future laboratory characterization and experimentation. Pond flow-through experimentation was then conducted in the same manner as the normal slag previously tested.
2.5. Data Analysis and Model Development
Discrete P sorption (%) under flow-through conditions was averaged among replications and described as a function of P added to the materials (mg·kg–1) using a
exponential model (Figure 2). The relationship between discrete P sorption and P added for every RT * P concentration combination was found to be statistically significant at P < 0.05 based on use of the SAS [23] “proc reg” command. Two multiple linear regression (MLR) models were then constructed to predict the slope and intercept of this “design curve” (Figure 2) as a function of P concentration and RT. Because the slope and intercepts were not normally distributed, these parameters were log transformed before producing the MLR model. The MLR model was produced using the SAS “proc reg” command with RT and P concentration as the independent variables. All four MLR models (two for each material) were significant at P < 0.01. With knowledge of the equation for the discrete P sorption relationship, one can determine how much cumulative P is removed by integration of the exponential equation:
0 e d
Cumulative P removed (%)
x mx
b x
x
C. J. PENN ET AL 239
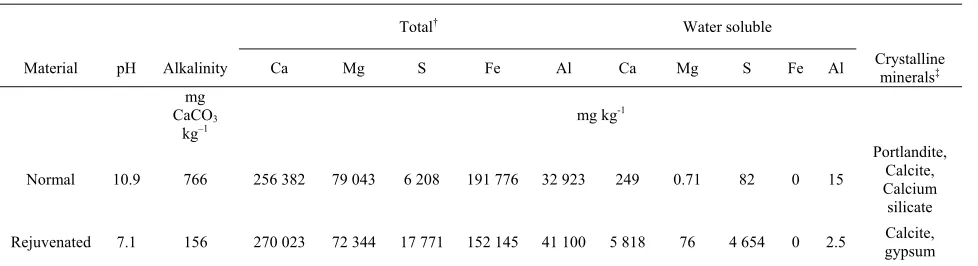
Table 1. Characterization of the normal and rejuvenated slag.
Total† Water soluble
Material pH Alkalinity Ca Mg S Fe Al Ca Mg S Fe Al Crystalline minerals‡
mg
CaCO3
kg–1 mg kg
-1
Normal 10.9 766 256 382 79 043 6 208 191 776 32 923 249 0.71 82 0 15
Portlandite, Calcite, Calcium silicate
Rejuvenated 7.1 156 270 023 72 344 17 771 152 145 41 100 5 818 76 4 654 0 2.5 gypsum Calcite,
† Determined by EPA3051 digestion method ‡ Determined by X-ray diffraction
In this case, “cumulative P removed” is the total amount of P that has been sorbed by the material up to point x, P added to the material in mg·kg–1. This is expressed as a
percentage of x. Variables m and b are the slope and intercept, respectively for the exponential relationship between x (P added) and discrete P removal (%). The point at which the design curve approaches zero percent discrete P removal represents the maximum amount of P that can be added (in units of mg·P·kg–1) to the material at
P saturation. In other words, this is the point at which the P concentration inflow = P concentration outflow. The amount of P added to reach this point of P saturation is described by the following function:
ln Maximum P added b
m
(3)
This value of maximum P added can then be inserted as variable “x” into Equation 2 along with the m and b values for that particular RT and P concentration of interest; the resulting cumulative P removed represents the maximum overall P removal under those conditions.
3. Results and Discussion
3.1. Slag Characterization
Saturated hydraulic conductivity of the sieved slag used in all experiments was high as expected at 0.68 cm s–1. In
the context of a field P removal structure, a high conductivity translates to the ability to treat large amounts of runoff water in a smaller area. Total concentrations of Ca, Mg, Fe, and Al (Table 1) were similar to those reported for EAF slag in previous studies [15,24]. The slag was dominated with Ca and Fe and the pH for the normal slag was relatively high (10.9; Table 1). Normal slag possessed some alkalinity but this was small compared to the finer sized fractions typically reported. For example, when expressed as calcium carbonate equivelant (CCE), normal slag contained only
0.07% compared to 18 to 80% reported for the fine fractions [25]. The elevated pH and Ca concentrations are typical considering the presence of portlandite (Ca[OH]2), calcite (CaCO3), and calcium silicate
(Ca2SiO4) identified by X-ray diffraction (Table 1).
After the normal slag was saturated with P from use in the pond filter and subsequent treatment with aluminum sulfate solution, some chemical properties were altered. The rejuvenated slag appeared visibly different from normal slag in that the former contained a white precipitant powder around the individual slag pieces. The most obvious chemical changes included a decrease in pH and alkalinity and increase in total S, Al, water soluble Ca and S (Table 1). Acidification treatment with aluminum sulfate clearly decreased pH and added Al and S. Dissolution of the Ca hydroxide (i.e. portlandite) and calcite minerals via acidification not only increased the water solubility of Ca but also resulted in the formation of gypsum (CaSO4) with the added S from aluminum
sulfate. Water soluble Al decreased with treatment due to the decrease in pH; Al becomes soluble at alkaline and acid pH but is precipitated as Al hydroxide minerals at near neutral pH. The increase in total Al from aluminum sulfate treatment is likely in the form of an amorphous Al hydroxide since no Al minerals were detected by X-ray diffraction.
amorphous Al hydroxides formed in the rejuvenated slag would be an effective P sorbent via ligand exchange of P onto terminal hydroxide groups; this mechanism would also occur on any Fe oxide/hydroxide minerals present in either material.
The traditional batch isotherm data fit well to the Langmuir model as indicated by an E value of 0.83 and 0.93 for normal and slag, respectively. The normal slag displayed a higher K value than rejuvenated slag (2.43 vs. 0.209; standard error = 0.18 and 0.075 for normal and slag, respectively). A larger K value is often considered to indicate greater affinity” for P compared to lesser values. On the other hand, Smax was less for normal slag
compared to rejuvenated slag (686 vs. 122 9 mg·kg–1;
standard error = 88 and 139 for normal and slag, respectively). The higher K value for normal slag may be due to the greater “potency” of the dissolved Ca in normal slag to precipitate P since this material possessed a higher pH and alkalinity compared to the rejuvenated slag. However, at higher concentrations of added P combined with greater soluble Ca concentrations of rejuvenated slag, the rejuvenated slag may sorb more P than normal slag as suggested by the higher Smax of rejuvenated slag.
3.2. Flow-Through Phosphorus Sorption
Phosphorus sorption under flow-through conditions was described as a function of P added to the materials using an exponential function (Figure 2). The exponential function was statistically significant for every P concentration and RT. Utilizing all P concentrations and RTs tested, two MLR models were found to be statistically significant (P < 0.01) for predicting the slope (m) and intercept (b) for the relationship between P added (mg·kg–1) and discrete P removal (%) as a function
of P concentration and RT for normal slag:
log 0.08506 RT 0.074 16 P concentration 2.53493
m
(4)
log 0.06541 RT 0.00864 P concentration 1.60631
b
(5) For rejuvenated slag:
log 0.08551 RT 0.071 49 P concentration 2.4399
m
(6)
log 0.05956 RT 0.0352 P concentration 1.61715
b
(7)
The r squared values for slope and intercept Equations (4 to 7) for normal slag were 0.68 and 0.48, respectively, and 0.72 and 0.83 for rejuvenated slag. In general, the flow through curves for the normal and rejuvenated slag were similar in slope (m), yet rejuvenated slag always had a lower Y intercept (b) than normal slag, especially at high P concentrations. One example of this is shown in
Figure 2. This difference in b is also observed in the MLR by comparing Equation 5 to 7; due to the P concentration coefficient being four times as high in rejuvenated than normal slag, the differences in intercepts become greater with increasing P concentrations. The b value for normal slag also increases more with increasing RT compared to rejuvenated slag due to the larger RT coefficient for normal slag shown in Equations 5 and 7 (0.065 41 vs. 0.059 56 for normal and rejuvenated slag, respectively).
The lower b values for the rejuvenated compared to normal slag is likely a result of the lower “potency” of the dissolved Ca in rejuvenated slag due to lower pH and alkalinity (Table 1). This difference is also reflected in the greater Langmuir K value previously discussed for the normal slag. Previous studies have also shown that P sorption with slag is enhanced with increasing pH and alkalinity [12-13].
3.3. Flow-through vs. Batch Isotherm Phosphorus Sorption
Due to differences in the nature of the batch isotherm compared to the flow-through experimentation, the amount of P sorbed by these methods should also differ.
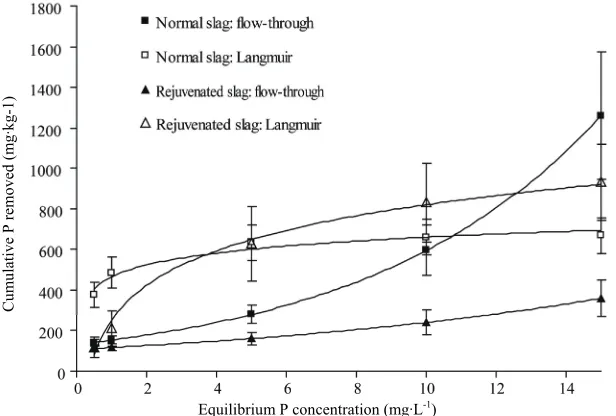
Figure 3 shows the differences between each approach by applying the P concentrations tested in the flow through experimentation (0.5, 1, 5, 10, and 15 mg·L–1)
to the Langmuir Equation (1) and MLR equations (at RT = 0.5 min) describing flow-through P sorption (Equations 4 to 7). Note that Equations 2 and 3 are also necessary for estimating the cumulative P removed from the predicted discrete curves. The “equilibrium point” in the flow-through condition is defined as the point in which the concentration of P added equals the concentration of P in the leachate, or “treated water” (i.e. when discrete P removal = 0). For the normal slag,
Figure 3 indicates that a batch isotherm greatly underestimates P sorption at a high P concentration (15 mg·P·L–1). On the other hand, the batch system mostly
sorbed more P than flow-through for rejuvenated slag as concentrations increased.
C. J. PENN ET AL 241
Cum
ulative P removed (
m
g·
kg-1)
[image:7.595.146.454.80.288.2]Equilibrium P concentration (mg·L-1)
Figure 3. Phosphorus (P) sorption by normal and rejuvenated slag as predicted by the flow-through model (Equations 2, and 4 to 7) and Langmuir equation (Equation 1). Flow-through model predictions based on a retention time of 30 s and Langmuir predictions are based on the Smax and K values determined in the batch equilibration experiment. Equilibrium P concentrations plotted are those tested in flow-through experimentation: 0.5, 1, 5, 10, and 15 mg·L–1. Error bars indicate standard error.
Table 2. Long-term phosphorus (P) removal performance of the materials tested on a pond. Actual P removal compared to predicted removal using flow-through equations (Equations 2 and 4 to7) and Langmuir isotherm (Equation 1).
Parameter Normal slag Rejuvenated slag
Duration tested (days) 20 20
P Input Range (mg·L–1) 0.11 to 0.60 0.16 to 0.52
Flow weighted concentration (mg·L–1) 0.38 0.34
Total P added (mg·kg–1) 172 149
Mass material (kg) 454 454
Retention time (min) 10 10
Measured P removed (mg·kg–1) 59 54
Flow-through predicted P removed (mg·kg–1) 88 62
Langmuir isotherm predicted P removed (mg·kg–1) 329 82
een these factors that promote and inhibit Ca phosphate precipitation. For example, the longer RT of the batch system (or a long compared to a short RT within a flow-through system) will provide more time for precipitation, promoting Ca phosphate precipitation. However, the nature of the batch system relative to flow-through also means that less reactants are being added to the system (i.e. not maintaining elevated H2PO4– concentration) and
also reaction products are not removed as efficiently, which would reduce precipitation or P removal. A long RT may also allow the counter ion of the source Ca mineral (i.e. 2 or
4
SO 2
3
CO ) to accumulate, which
would prevent further dissolution of the minerals translating to a lower “supply” of Ca2+ thereby reducing
precipitation (i.e. common ion effect).
For the normal slag in Figure 3, it appears that constant removal of reaction products was dominant over a greater amount of time for precipitation in the batch system at all concentrations above 11 mg·P·L–1. On the
other hand, the batch system displayed higher P retention than flow-through at lower equilibrium P concentrations (i.e. less than 11 mg·L–1). This may be due
[image:7.595.79.520.397.567.2]Cum
ulative P removed (
m
g·
kg
-1)
P added (mg·kg-1)
Cum
ulative P removed (
m
g·
kg
-1)
[image:8.595.161.436.67.471.2]P added (mg·kg-1)
Figure 4. Cumulative Phosphorus (P) sorbed with P added among normal (a) and treated (b) slag tested in the pond filtration unit. Open circles indicate model estimates from Equations 2 and 4 to 7. Flow rate was 8.5 L·min–1 and pond water was pumped into materials for 20 h per day (10,200 L per day). Details on experiment parameters and results shown in Table 2.
initial concentration of P added to the system. For example, in order for the batch system to achieve the equilibrium concentration of 5 mg·P·L–1, a P solution
concentration of approximately 38 mg·L–1 was required.
This greater initial P concentration compared to the flow-through methodology (5 mg·P·L–1) provided the greater
chemical potential for precipitation and adsorption reactions to occur.
For the rejuvenated slag the greater RT of the batch system providing more time for precipitation appeared to dominate over the ability to remove reaction products at high equilibrium P concentrations. This contrary result relative to normal slag is likely due to the lower pH and alkalinity of rejuvenated slag compared to normal slag. In order for the soluble Ca to be most effective at P sorption the pH must be maintained above 6.5.
3.4. Results of Pond Flow-through Experiment
Results of the large scale pond flow-through experiment utilizing normal and rejuvenated slag are shown in Fig. 4. Similar to results from laboratory flow-through experiments and the subsequent MLR model (Equations 4 to 7), the decrease in discrete P removal with P addition between materials is similar but the initial P removal (i.e. Y intercept) was greater for normal than rejuvenated slag (data not shown). Pond P conditions were similar for each experiment (Table 2). The pH of pond water during this experiment was 7.2 to 8.0, which was in the typical range for this particular pond prior to initiation of pumping. Actual P removal was 59 and 54 mg·P·kg–1 overall (i.e. cumulative) for normal and
C. J. PENN ET AL. 243
concentrations were slightly out of the range of flow-through model development conditions (i.e. RT > 8 min and P < 0.5 mg·L–1; Table 2), the predictions were
reasonable (Figure 4 and Table 2). Based on the calculated total pore volume and measured flow rate through the slag (17.2 L·min–1), the retention time for
both materials was 10 min.
Flow-through Equations (4 to 7) slightly over predicted cumulative P removal for normal slag and rejuvenated slag when the respective RT and flow-weighted P concentrations were applied (Table 2). On the other hand, the Langmuir model (Equation 1) highly over predicted cumulative P removal for the normal slag and slightly over predicted for the rejuvenated slag (Table 2) based on the K and Smax
values determined from the batch isotherm. These results clearly suggest the superiority of a flow-through model over a Langmuir batch isotherm for conditions in which a P rich solution is passing through sorptive materials.
4. Conclusions
The materials examined in this study would be effective at scrubbing dissolved P from runoff when placed in P removal structures designed to intercept runoff [7-8]. Since the concept behind such structures is to remove and replace “spent” material after it has been saturated with P [7], the ability to successfully “rejuvenate” the slag material in situ via treatment process with aluminum sulfate as demonstrated in the current study will save considerable cost, time, and effort.
The flow-through model approach used in this study could be used in predicting the lifetime of materials in P removal structures or determining how much material is required for achieving a target P removal goal for a sp-ecific site. For example, we are currently constructing a P removal structure on a golf course ditch where dis-solved P concentrations are typically 0.6 mg·L–1. Based
on the slag mass (2 700 kg) and target RT, the model predicts 31% cumulative P removal at saturation or 97 mg·P·kg–1. Based on expected runoff flow volumes for
the site, the 2 700 kg of slag would last about 15 to 24 months. Slag will then be treated in-situ for rejuvenation.
5. References
[1] J. N. Quinton, J. A. Catt and T. M. Hess, “The Selective Removal of Phosphorus from Soil: Is Event Size Important?” Journal of Environment Quality, Vol. 30, No. 2, 2001, pp. 538-546. doi:10.2134/jeq2001.302538x
[2] D. R. Edwards and T. C. Daniel, “Effects of Poultry litter Application Rate and Rainfall Intensity on Quality of Runoff from Fescuegrass Plots,” Journal Environment Quality, Vol. 22, No. 2, 1993, pp. 361-365.
doi:10.2134/jeq1993.00472425002200020017x
[3] C. J. Penn, G. L. Mullins, L. W. Zelazny, J. G. Warren, and J. M. McGrath, “Surface Runoff Losses of Pho- sphorus from Virginia Soils Amended with Turkey Manure Using Phytase and HAP Corn Diets,” Journal of Environment Quality, Vol. 33, No. 4, 2004, pp.1431-1439. doi:10.2134/jeq2004.1431
[4] J. W. Leader, E. J. Dunne, and K. R. Reddy, “Phosphorus Sorbing Materials: Sorption Dynamics and Physio-chemical Characteristics,” Journal of Environment Qu-ality, Vol. 37, No. 1, 2008, pp. 174-81.
doi:10.2134/jeq2007.0148
[5] L. E. Gallimore, N. T. Basta, D. E. Storm, M. E. Payton, R. H. Huhnke and M. D. Smolen, “Water Treatment Residual to Reduce Nutrients in Surface Runoff from Agricultural Land,” Journal Environmrnt Quality, Vol. 28, No. 5, 1999, pp. 1474-1478.
doi:10.2134/jeq1999.00472425002800050012x
[6] C. J. Penn, and R. B. Bryant, “Application of Pho-Sphorus Sorbing Materials to Streamside Cattle Loafing Areas,” Journal of Soil and Water Conservation, Vol. 61, No. 5, 2006, pp. 303-310.
[7] C. J. Penn, R. B. Bryant, P. A. Kleinman and A. Allen, “Sequestering Dissolved Phosphorus from Ditch Dr-ainage Water,” Journal of Soil and Water Conser-vation, Vol. 62, No. 4, 2007, pp. 269-272.
[8] C. J. Penn, J. M. McGrath and R. B. Bryant, “Ditch Drainage Management for Water Quality Impro-vement,” In: M. T. Moore and R. Kroger Eds., Agri-cultural Drainage Ditches: Mitigation Wetlands for the 21st Century, Research Signpost, Kerala, India, 2010, pp. 151-173.
[9] A. N. Shilton, I. Elmetri, A. Drizo, S. Pratt, R. G. Hav-erkamp and S. C. Bilby, “Phosphorus Removal by an “Active” Slag Filter-A Decade of Full Scale Exp-erience,” Water Research, Vol. 40, No. 1, 2006, pp. 113-118. doi:10.1016/j.watres.2005.11.002
[10] L. Johansson, “Industrial By-Products and Natural Sub-strate as Phosphorus Sorbents,” Environmental Techno-logy, Vol. 20, No. 3, 1999, pp. 309-316.
doi:10.1080/09593332008616822
[11] R. W. McDowell, A. N. Sharpley and W. Bourke, “Treatment of Drainage Water with Industrial By-Products to Prevent Phosphorus Loss from Tile-Drained Land,” Journal of Environment Quality, Vol. 37, No. 4, 2008, pp. 1575-1582. doi:10.2134/jeq2007.0454
[12] B. Kostura, H. Kulveitova and J. Lesko, “Blast Furnace Slags as Sorbents of Phosphate from Water Solutions,” Water Research, Vol. 39, No. 9, 2005, pp. 1795-1802. [13] L. I. Bowden, A. P. Jarvis, P. L. Younger and K. L.
Johnson, “Phosphorus Removal from Waste Waters Using Basic Oxygen Steel Slag,” Environmental Science & Technology, Vol. 43, No. 7, 2009, pp. 2476-2481.
doi:10.1021/es801626d
[15] A. Drizo, Y. Comeau, C. Forget and R. P. Chapuis, “Pho-sphorus Saturation Potential: A Parameter for Estimating the Longevity of Constructed Wetland Systems,” Env-ironmental Science & Technology, Vol. 36, No. 21, 2002, pp. 4642-4648. doi:10.1021/es011502v
[16] A. Drizo, J. Cummings, D. Weber, E. Twohig, G. Dru- schel and B. Bourke, “New Evidence for Rejuvenation of Phosphorus Retention Capacity in EAF Steel Slag,” Environmental Science & Technology, Vol. 42, No. 16, 2008, pp. 6191-6197. doi:10.1021/es800232r
[17] U. S. Environmental Protection Agency, “Method 3051a: Micro-Wave Assisted Acid Dissolution of Sediments, Sludges, Soils and Oils,” 2nd Edition,” U.S. Government Printing Office, Washington, DC, 1997.
[18] A. Klute and C. Dirksen, “Hydraulic Conductivity and Diffusivity: Laboratory Methods,” In: A. Klute, Ed., Me-thods of Soil Analysis, Part 1 SSSA Book Series 5, SSSA, Madison, WI, 1986, pp. 687-732.
[19] J. Murphy and J. R. Riley, “A Modified Single Solution Method for the Determination of Phosphate in Natural Waters,” Analytica Chimica Acta, Vol. 27, No. 1, 1962, pp. 31-36. doi:10.1016/S0003-2670(00)88444-5
[20] C. H. Bolster and G. M Hornberger, “On the Use of Linearized Langmuir Equations,” Soil Science Society of Amercia Journal, Vol. 71, No. 6, 2007, pp. 1796-1806.
doi:10.2136/sssaj2006.0304
[21] T. M. DeSutter, G. M. Pierzynski and L. Baker, “Flow-through and Batch Methods for Determining Ca-Mg and Mg-Ca Selectivity,” Soil Science Society of Amercia Journal, Vol. 70, No. 2, 2006, pp. 550-554.
doi:10.2136/sssaj2005.0065N
[22] P. A. Vadas, R. D. Harmel and P. J. A. Kleinman, “Tra-nsformations of Soil and Manure Phosphorus after Sur-face Application of Manure to Field Plots,” Nutrient Cycling Agroecosystms, Vol. 77, No. 1, 2007, pp. 83-99.
doi:10.1007/s10705-006-9047-5
[23] SAS Institute, “SAS User’s Guide: Statistics,” SAS Inst., Cary, NC, 2003.D. M. Proctor, K. A. Fehling, E. C. Shay, J. L. Witt-enborn, J. J. Green, C. Avent, R. D. Bigham, M. Connolly, B. Lee, T. O. Shepker and M. A. Zak, “Phy-sical and Chemical Characteristics of Blast Furnace, Basic Oxygen Furnace, and Electric Arc Furnace Steel Industry Slags,” Environmental Science & Technology, Vol. 34, No. 8, 2000, pp. 1576-1582.
doi:10.1021/es9906002
[24] National Slag Association, “A Guide For The Use of Steel Slag in Agriculture and for Reclamation of Acid Lands,” 2011. Internet available: http://www.mational slag.org/tech/ag_guide909.pdf