Generating student feedback from time-series data using Reinforcement
Learning
Dimitra Gkatzia, Helen Hastie, Srinivasan Janarthanam and Oliver Lemon Department of Mathematical and Computer Sciences
Heriot-Watt University Edinburgh, Scotland
{dg106, h.hastie, sc445, o.lemon} @hw.ac.uk
Abstract
We describe a statistical Natural Language Generation (NLG) method for summarisa-tion of time-series data in the context of feedback generation for students. In this paper, we initially present a method for collecting time-series data from students (e.g. marks, lectures attended) and use ex-ample feedback from lecturers in a data-driven approach to content selection. We show a novel way of constructing a reward function for our Reinforcement Learning agent that is informed by the lecturers’ method of providing feedback. We eval-uate our system with undergradeval-uate stu-dents by comparing it to three baseline systems: a rule-based system, lecturer-constructed summaries and a Brute Force system. Our evaluation shows that the feedback generated by our learning agent is viewed by students to be as good as the feedback from the lecturers. Our findings suggest that the learning agent needs to take into account both the student and lec-turers’ preferences.
1 Introduction
Data-to-text generation refers to the task of auto-matically generating text from non-linguistic data (Reiter and Dale, 2000). The goal of this work is to develop a method for summarising time-series data in order to provide continuous feedback to students across the entire semester. As a case study, we took a module in Artificial Intelligence and asked students to fill out a very short diary-type questionnaire on a weekly basis. Questions included, for example, number of deadlines, num-ber of classes attended, severity of personal issues. These data were then combined with the marks from the weekly lab reflecting the students’ per-formance. As data is gathered each week in the
lab, we now have a set of time-series data and our goal is to automatically create feedback. The goal is to present a holistic view through these diary en-tries of how the student is doing and what factors may be affecting performance.
Feedback is very important in the learning pro-cess but very challenging for academic staff to complete in a timely manner given the large num-ber of students and the increasing pressures on academics’ time. This is where automatic feed-back can play a part, providing a tool for teachers that can give insight into factors that may not be immediately obvious (Porayska-Pomsta and Mel-lish, 2013). As reflected in NSS surveys1, stu-dents are not completely satisfied with how feed-back is currently delivered. The 2012 NSS survey, for all disciplines reported an 83% satisfaction rate with courses, with 70% satisfied with feedback. This has improved from recent years (in 2006 this was 60% for feedback) but shows that there is still room for improvement in how teachers deliver feedback and its content.
In the next section (Section 2) a discussion of the related work is presented. In Section 3, a de-scription of the methodology is given as well as the process of the data collection from students, the template construction and the data collection with lecturers. In Section 4, the Reinforcement Learning implementation is described. In Section 5, the evaluation results are presented, and finally, in Sections 6 and 7, a conclusion and directions for future work are discussed.
2 Related Work
Report generation from time-series data has been researched widely and existing methods have been used in several domains such as weather forecasts (Belz and Kow, 2010; Angeli et al., 2010; Sripada et al., 2004), clinical data summarisation (Hunter
1http://www.thestudentsurvey.com/
et al., 2011; Gatt et al., 2009), narrative to assist children with communication needs (Black et al., 2010) and audiovisual debriefs from sensor data from Autonomous Underwater Vehicles missions (Johnson and Lane, 2011).
The two main challenges for time-series data summarisation are what to say (Content Selec-tion) and how to say it (Surface RealisaSelec-tion). In this work we concentrate on the former. Previ-ous methods for content selection include Gricean Maxims (Sripada et al., 2003); collective con-tent selection (Barzilay and Lapata, 2004); and the Hidden Markov model approach for content selection and ordering (Barzilay and Lee, 2004). NLG systems tend to be very domain-specific and data-driven systems that seek to simultane-ously optimize both content selection and sur-face realisation have the potential to be more domain-independent, automatically optimized and lend themselves to automatic generalization (An-geli et al., 2010; Rieser et al., 2010; Dethlefs and Cuayahuitl, 2011). Recent work on report generation uses statistical techniques from Ma-chine Translation (Belz and Kow, 2010), super-vised learning (Angeli et al., 2010) and unsuper-vised learning (Konstas and Lapata, 2012).
Here we apply Reinforcement Learning meth-ods (see Section 4 for motivation) which have been successfully applied to other NLG tasks, such as Temporal Expressions Generation (Janarthanam et al., 2011), Lexical Choice (Janarthanam and Lemon, 2010), generation of adaptive restaurant summaries in the context of a dialogue system (Rieser et al., 2010) and generating instructions (Dethlefs and Cuayahuitl, 2011).
[image:2.595.83.272.565.725.2]3 Methodology
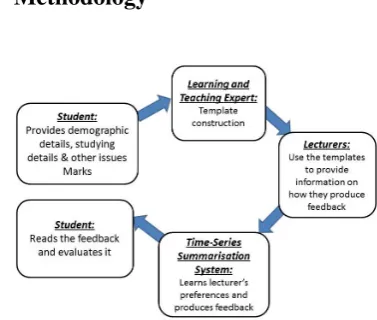
Figure 1: Methodology for data-driven feedback report generation
Figure 1 shows graphically our approach to the de-velopment of a generation system. Firstly, we col-lected data from students including marks, demo-graphic details and weekly study habits. Next, we created templates for surface realisation with the help of a Teaching and Learning expert. These templates were used to generate summaries that were rated by lecturers. We used these ratings to train the learning agent. The output of the learning agent (i.e. automatically generated feedback re-ports) were finally evaluated by the students. Each of these steps are discussed in turn.
3.1 Time-series Data Collection from Students
The data were collected during the weekly lab ses-sions of a Computer Science module which was taught to third year Honours and MSc students over the course of a 10 week semester. We re-cruited 26 students who were asked to fill in a web-based diary-like questionnaire. Initially, we asked students to provide some demographic de-tails (age, nationality, level of study). In addition, students provided on a weekly basis, information for nine factors that could influence their perfor-mance. These nine factors were motivated from the literature and are listed here in terms of effort (Ames, 1992), frustration (Craig et al., 2004) , dif-ficulty (Person et al., 1995; Fox, 1993) and per-formance (Chi et al., 2001). Effort is measured by three factors: (1) how many hours they studied; (2) the level of revision they have done; (3) as well as the number of lectures (of this module) they at-tended. Frustration is measured by (4) the level of understandability of the content; (5) whether they have had other deadlines; and whether they faced any (6) health and/or (7) personal issues and at what severity. Thedifficulty of the lab exercises
is measured by (8) the students’ perception of dif-ficulty. Finally, (9) marks achieved by the students in each weekly lab was used as a measure of their
performance.
3.2 Data Trends
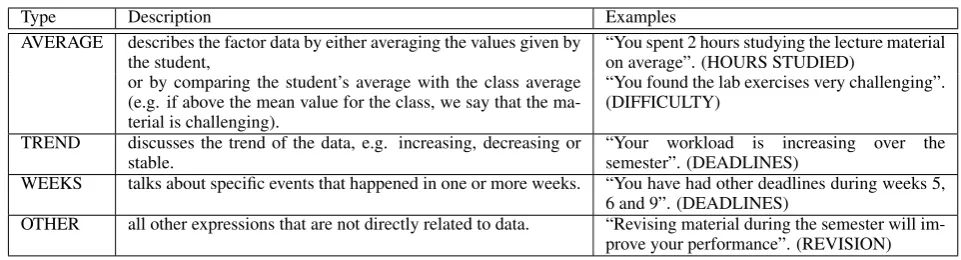
Type Description Examples AVERAGE describes the factor data by either averaging the values given by
the student,
“You spent 2 hours studying the lecture material on average”. (HOURS STUDIED)
or by comparing the student’s average with the class average (e.g. if above the mean value for the class, we say that the ma-terial is challenging).
“You found the lab exercises very challenging”. (DIFFICULTY)
TREND discusses the trend of the data, e.g. increasing, decreasing or stable.
“Your workload is increasing over the semester”. (DEADLINES)
WEEKS talks about specific events that happened in one or more weeks. “You have had other deadlines during weeks 5, 6 and 9”. (DEADLINES)
[image:3.595.68.549.59.189.2]OTHER all other expressions that are not directly related to data. “Revising material during the semester will im-prove your performance”. (REVISION)
Table 1: The table explains the different template types.
factor and the class average of the same factor.
3.3 Template Generation
The wording and phrasing used in the templates to describe the data were derived from working with and following the advice of a Learning and Teach-ing (L&T) expert. The expert provided consulta-tion on how to summarise the data. We derived 4 different kinds of templates for each factor: AV-ERAGE, TREND, WEEKS and OTHER based on time-series data on plotted graphs. A description of the template types is shown in Table 1.
In addition, the L&T expert consulted on how to enhance the templates so that they are ap-propriate for communicating feedback accord-ing to the guidelines of the Higher Education Academy (2009), for instance, by including moti-vating phrases such as ”You may want to plan your study and work ahead”.
3.4 Data Collection from Lecturers
The goal of the Reinforcement Learning agent is to learn to generate feedback at least as well as lecturers. In order to achieve this, a second data collection was conducted with 12 lecturers partic-ipating.
The data collection consisted of three stages where lecturers were given plotted factor graphs and were asked to:
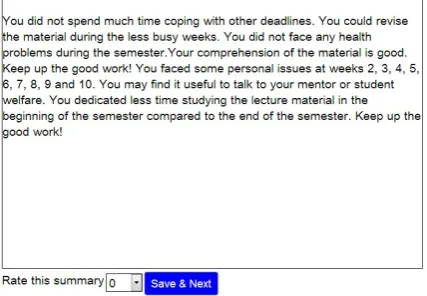
1. write a free style text summary for 3 students (Figure 2);
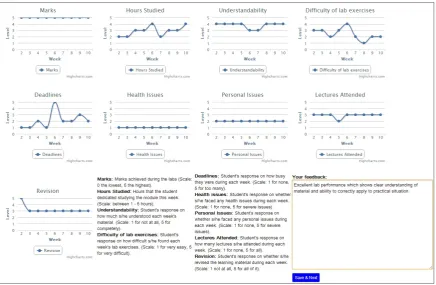
2. construct feedback summaries using the tem-plates for 3 students (Figure 3);
3. rate random feedback summaries for 2 stu-dents (Figure 4).
We developed the experiment using the Google Web Toolkit for Web Applications, which
facil-itates the development of client-server applica-tions. The server side hosts the designed tasks and stores the results in a datastore. The client side is responsible for displaying the tasks on the user’s browser.
In Task 1, the lecturers were presented with the factor graphs of a student (one graph per factor) and were asked to provide a free-text feedback summary for this student. The lecturers were en-couraged to pick as many factors as they wanted and to discuss the factors in any order they found useful. Figure 2 shows an example free text sum-mary for a high performing student where the lec-turer decided to talk about lab marks and under-standability. Each lecturer was asked to repeat this task 3 times for 3 randomly picked students.
In Task 2, the lecturers were again asked to con-struct a feedback summary but this time they were given a range of sentences generated from the tem-plates (as described in Section 2.3). They were asked to use these to construct a feedback report. The number of alternative utterances generated for each factor varies depending on the factor and the given data. In some cases, a factor can have 2 gen-erated utterances and in other cases up to 5 (with a mean of 3 for each factor) and they differenti-ate in the style of trend description and wording. Again the lecturer was free to choose which fac-tors to talk about and in which order, as well as to decide on the template style he/she prefers for the realisation through the template options. Fig-ure 3 shows an example of template selection for the same student as in Figure 2.
Figure 2: The interface of the 1st task of the data collection: the lecturer consults the factor graphs and provides feedback in a free text format.
Figure 3: The interface of the 2nd task of data collection: the lecturer consults the graphs and constructs a feedback summary from the given templates (this graph refers to the same student as Figure 2).
a randomly generated summary for the same stu-dent as in Figure 2.
4 Learning a Time-Series Generation Policy
Reinforcement Learning (RL) is a machine learn-ing technique that defines how an agent learns to take optimal actions in a dynamic environment so
[image:4.595.167.429.395.587.2]Figure 4: The interface of the 3rd task of data col-lection: the lecturer consults the graphs and rates the randomly generated feedback summary (this graph refers to the same student as Figures 2 and 3).
from time-series data for feedback report gener-ation. Summarisation from time-series data is an open challenge and we aim to research other meth-ods in the future, such as supervised learning, evo-lutionary algorithms etc.
4.1 Actions and States
In this learning setup, we focused only on select-ing the correct content, i.e. which factors to talk about. The agent selects a factor and then decides whether to talk about it or not. The state consists of a description of the factor trends and the num-ber of templates that have been selected so far. An example of the initial state of a student can be:
<marks increased, lectures attended stable, hours studied increased, understandability stable, difficulty increased, health issues stable, per-sonal issues stable, revision increased, 0>
The agent explores the state space by selecting a factor and then by deciding whether to talk about it or not. If the agent decides to talk about the selected factor, it chooses the template in a greedy way, i.e. it chooses for each factor the template that results in a higher reward. After an action has been selected, it is deleted from the action space.
4.1.1 Ordering
In order to find out in which order the lectur-ers describe the factors, we transformed the feed-back summaries into n-grams of factors. For in-stance, a summary that talks about the student’s performance, the number of lectures that he/she attended, potential health problems and revision
done can be translated into the following ngram: start, marks, lectures attended, health issues, re-vision, end. We used the constructed n-grams to compute the bigram frequency of the tokens in or-der to identify which factor is most probable to be referred to initially, which factors follow particu-lar factors and which factor is usually talked about in the end. It was found that the most frequent or-dering is: start, marks, hours studied, understand-ability, difficulty, deadlines, health issues, per-sonal issues, lectures attended, revision, end.
4.2 Reward Function
The goal of the reward function is to optimise the way lecturers generate and rate feedback. Given the expert annotated summaries from Task 1, the constructed summaries from Task 2 and the ratings from Task 3, we derived the multivariate reward function:
Reward=a+ n
X
i=1
bi∗xi+c∗length
where X = {x1, x2, ..., xn} represents the combinations between the data trends observed in the time-series data and the corresponding lectur-ers’ feedback (i.e. whether they included a factor to be realised or not and how). The valuexi for factoriis defined by the function:
xi=
1, the combinationiof a factor trend
and a template type is included in the feedback
0, if not.
For instance, the value ofx1 is 1 if marks were increased and this trend is realised in the feedback, otherwise it is 0. In our domainn= 90in order to cover all the different combinations. Thelength
stands for the number of factors selected,ais the intercept, bi andc are the coefficients for xi and
lengthrespectively.
In order to model the reward function, we used linear regression to compute the weights from the data gathered from the lecturers. Therefore, the reward function is fully informed by the data pro-vided by the experts. Indeed, the intercepta, the vector weights b and the weight c are learnt by making use of the data collected by the lecturers from the 3 tasks discussed in Section 3.4.
Factor Trend Template
difficulty stable NOT MENTIONED hours studied stable TREND
understandability stable NOT MENTIONED deadlines increase WEEKS
health issues stable WEEKS personal issues stable WEEKS lectures att. stable WEEKS
revision stable OTHER
[image:6.595.309.524.60.189.2]marks increase TREND
Table 2: The table shows the scenario at which the reward function is maximised.
The reward function is minimized (Reward = -586.0359) for the scenario shown in Table 3 (please note that this scenario also was not ob-served in the data collection).
Factor Trend Template
difficulty increase AVERAGE hours studied stable NOT MENTIONED understandability decrease AVERAGE
deadlines * *
health issues increase TREND personal issues stable TREND
lectures att. stable NOT MENTIONED
revision stable AVERAGE
[image:6.595.73.295.62.166.2]marks stable TREND
Table 3: The table shows the scenario at which the reward function is minimised (* denotes multiple options result in the same minimum reward).
4.3 Training
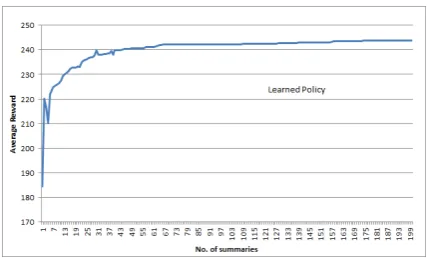
We trained a time-series generation policy for 10,000 runs using the Tabular Temporal-Difference Learning (Sutton and Barto, 1998). During the training phase, the learning agent gen-erated feedback summaries. When the construc-tion of the summary begins, the length of the sum-mary is 0. Each time that the agent adds a template (by selecting a factor), the length is incremented, thus changing the state. It repeats the process until it decides for all factors whether to talk about them or not. The agent is finally rewarded at the end of the process using the Reward function described in Section 3.2. Initially, the learning agent selects factors randomly, but gradually learns to identify factors that are highly rewarding for a given data scenario. Figure 5 shows the learning curve of the agent.
Figure 5: Learning curve for the learning agent. The x-axis shows the number of summaries pro-duced and y- axis the total reward received for each summary.
5 Evaluation
We evaluated the system using the reward func-tion and with students. In both these evaluafunc-tions, we compared feedback reports generated using our Reinforcement Learning agent with four other baseline systems. Here we present a brief descrip-tion of the baseline systems.
Baseline 1: Rule-based system. This system selects factors and templates for generation using a set of rules. These hand-crafted rules were derived from a combination of the L&T expert’s advice and a student’s preferences and is therefore a chal-lenging baseline and represents a middle ground between the L&T expert’s advice and a student’s preferences. An example rule is: if the mark aver-age is less than 50% then refer to revision.
Baseline 2: Brute Force system. This system performs a search of the state space, by exploring randomly as many different feedback summaries as possible. The Brute Force algorithm is shown below:
Algorithm 1Brute Force algorithm
I n p u t d a t a : D f o r n = 0 . . . 1 0 , 0 0 0
c o n s t r u c t r a n d o m l y f e e d b a c k [ n ] a s s i g n g e t R e w a r d [ n ]
i f g e t R e w a r d [ n]>g e t R e w a r d [ n−1] b e s t F e e d b a c k = f e e d b a c k [ n ] e l s e
b e s t F e e d b a c k = f e e d b a c k [ n−1] r e t u r n b e s t F e e d b a c k
[image:6.595.73.294.316.420.2]new one as the best. It repeats this process for 10,000 times for each scenario. Finally, the algo-rithm returns the summary that scored the highest ranking.
Baseline 3: Lecturer-produced summaries.
These are the summaries produced by the lectur-ers, as described in Section 2.4, for Task 2 using template-generated utterances.
Baseline 4: Random system: The Random system constructs feedback summaries by select-ing factors and templates randomly as described in Task 3 (in Section 3.4).
[image:7.595.307.521.155.228.2]5.1 Evaluation with Reward Function
Table 4 presents the results of the evaluation per-formed using the Reward Function, comparing the learned policy with the four baseline systems. Each system generated 26 feedback summaries. On average the learned policy scores significantly higher than any other baseline for the given sce-narios (p<0.05 in a paired t-test).
Time-Series Summarisation Systems Reward
Learned 243.82
Baseline 1: Rule-based 107.77
Baseline 2: Brute Force 241.98
Baseline 3: Lecturers 124.62
Baseline 4: Random 43.29
Table 4: The table summarises the average re-wards that are assigned to summaries produced from the different systems.
5.2 Evaluation with Students
A subjective evaluation was conducted using 1st year students of Computer Science as participants. We recruited 17 students, who were all English na-tive speakers. The participants were shown 4 feed-back summaries in a random order, one generated by the learned policy, one from the rule-based sys-tem (Baseline 1), one from the Brute Force syssys-tem (Baseline 2) and one summary produced by a lec-turer using the templates (Baseline 3). Given the poor performance of the Random system in terms of reward, Baseline 4 was omitted from this study. Overall there were 26 different scenarios, as de-scribed in Section 3.1. All summaries presented to a participant were generated from the same sce-nario. The participants then had to rank the sum-maries in order of preference: 1 for the most pre-ferred and 4 for the least prepre-ferred. Each
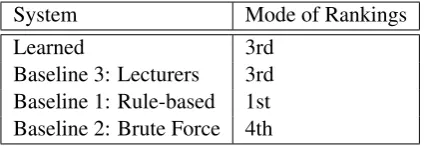
partici-pant repeated the process for 4.5 scenarios on aver-age (the participant was allowed to opt out at any stage). The mode values of the rankings of the preferences of the students are shown in Table 5. The web-based system used for the evaluation is shown in Figure 6.
System Mode of Rankings
Learned 3rd
Baseline 3: Lecturers 3rd Baseline 1: Rule-based 1st Baseline 2: Brute Force 4th
Table 5: The table shows the mode value of the rankings of the preference of the students.
We ran a Mann-Whitney’s U test to evaluate the difference in the responses of our 4-point Likert Scale question between the Learned system and the other three baselines. It was found that, for the given data, the preference of students for the feedback generated by the Learned system is as good as the feedback produced by the experts, i.e. there is no significant difference between the mean value of the rankings of the Learned system and the lecturer-produced summaries (p = 0.8) (Base-line 3).
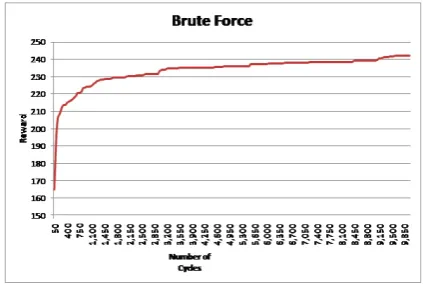
The preference of the users for the Brute Force system does not differ significantly from the sum-maries generated by the Learned system (p = 0.1335). However, the computational cost of the Brute Force is higher because each time that the algorithm sees a new scenario it has to run ap-proximately 3k times to reach a good summary (as seen in Figure 7) and about 10k to reach an optimal one, which corresponds to 46 seconds. This delay would prohibit the use of such a system in time-critical situations (such as defence) and in live sys-tems such as tutoring syssys-tems. In addition, the processing time would increase with more compli-cated scenarios and if we want to take into account the ordering of the content selection and/or if we have more variables. In contrast, the RL method needs only to be trained once.
[image:7.595.74.292.363.451.2]Figure 6: The interface for the evaluation: the students viewed the four feedback summaries and ranked them in order of preference. From left to right, the summaries as generated by: an Expert (Baseline 3), the Rule based system (Baseline 1), the Brute Force algorithm (Baseline 2), the Learned system.
Figure 7: The graphs shows the number of cycles that the Brute Force algorithm needs to achieve specific rewards.
students’ preferences should be taken into account as they are the receivers of the feedback. This can also be generalised to other areas, where the ex-perts and the end users are not the same group of people. As the learned policy was not trained to optimise for the evaluation criteria, in future, we will explore reward functions that bear in mind both the expert knowledge and the student’s pref-erences.
6 Conclusion
We have presented a statistical learning approach to summarisation from time-series data in the area of feedback reports. In our reports, we took into
account the principles of good feedback provision as instructed by the Higher Education Academy. We also presented a method for data gathering from students and lecturers and show how we can use these data to generate feedback by presenting the problem as a Markov Decision Process and optimising it using Reinforcement Learning tech-niques. We also showed a way of constructing a data-driven reward function that can capture de-pendencies between the time-series data and the realisation phrases, in a similar way that the lec-turers do when providing feedback. Finally, our evaluation showed that the learned report genera-tion policy generates reports as well as lecturers.
7 Future Work
[image:8.595.74.286.350.492.2]se-lection and surface realisation, therefore we will extend the action space in order to include actions for template selection.
8 Acknowledgements
The research leading to this work has re-ceived funding from the EC’s FP7 programme: (FP7/2011-14) under grant agreement no. 248765 (Help4Mood).
References
Carole Ames. 1992. Classrooms: Goals, Structures, and Student Motivation. Journal of Educational Psy-chology, 84(3):p261-71.
Gabor Angeli, Percy Liang and Dan Klein. 2010. A simple domain-independent probabilistic approach to generation. EMNLP ’10: Proceedings of the 2010 Conference on Empirical Methods in Natural Lan-guage Processing.
Regina Barzilay and Mirella Lapata. 2004. Collec-tive content selection for concept-to-text generation. HLT ’05: Proceedings of the conference on Hu-man Language Technology and Empirical Methods in Natural Language Processing.
Regina Barzilay and Lillian Lee. 2004. Catching the drift: Probabilistic content models, with applications to generation and summarization. HLT-NAACL 2004: Proceedings of the Human Language Tech-nology Conference of the North American Chapter of the Association for Computational Linguistics.
Anja Belz and Eric Kow. 2010. Extracting parallel fragments from comparable corpora for data-to-text generation. INLG ’10: Proceedings of the 6th Inter-national Natural Language Generation Conference.
Rolf Black, Joe Reddington, Ehud Reiter, Nava Tintarev, and Annalu Waller. 2010. Using NLG and Sensors to Support Personal Narrative for Children with Complex Communication Needs. SLPAT ’10: Proceedings of the NAACL HLT 2010 Workshop on Speech and Language Processing for Assistive Tech-nologies.
Michelene T.H. Chi, Stephanie A. Siler, Heisawn Jeong, Takashi Yamauchi, Robert G. Hausmann. 2001. Learning from human tutoring. Journal of Cognitive Science, 25(4):471-533.
Scotty D. Craig, Arthur C. Graesser, Jeremiah Sullins, Barry Gholson. 2004. Affect and learning: an ex-ploratory look into the role of affect in learning with AutoTutor. Journal of Educational Media, 29:241-250.
Nina Dethlefs and Heriberto Cuayahuitl. 2011. Combining hierarchical reinforcement learning and bayesian networks for natural language generation
in situated dialogue. ENLG ’11: Proceedings of the 13th European Workshop on Natural Language Gen-eration.
Barbara Fox. 1993. The Human Tutorial Dialogue Project: Issues in the Design of Instructional Sys-tems. Lawrence Erlbaum Associates, Hillsdale, New Jersey.
Albert Gatt, Francois Portet, Ehud Reiter, James Hunter, Saad Mahamood,Wendy Moncur, and So-mayajulu Sripada. 2009. From Data to Text in the Neonatal Intensive Care Unit: Using NLG Technol-ogy for Decision Support and Information Manage-ment. Journal of AI Communications, 22:153-186.
Higher Education Academy. 2009. Providing individ-ual written feedback on formative and summative assessments. http://www.heacademy. ac.uk/assets/documents/resources/
database/id353_senlef_guide.pdf.
Last modified September 16.
Jim Hunter, Yvonne Freer, Albert Gatt, Yaji Sripada, Cindy Sykes, and D Westwater. 2011. BT-Nurse: Computer Generation of Natural Language Shift Summaries from Complex Heterogeneous Medical Data. Journal of the American Medical Informatics Association,18:621-624.
Srinivasan Janarthenam, Helen Hastie, Oliver Lemon, Xingkun Liu. 2011. ”The day after the day after to-morrow?” A machine learning approach to adaptive temporal expression generation: training and evalu-ation with real users. SIGDIAL ’11: Proceedings of the SIGDIAL 2011 Conference.
Srinivasan Janarthanam and Oliver Lemon. 2010. Adaptive Referring Expression Generation in Spo-ken Dialogue Systems: Evaluation with Real Users. SIGDIAL ’10: Proceedings of the 11th Annual Meeting of the Special Interest Group on Discourse and Dialogue.
Nicholas A. R. Johnson and David M. Lane. 2011. Narrative Monologue as a First Step Towards Ad-vanced Mission Debrief for AUV Operator Situa-tional Awareness. In the 15th InternaSitua-tional Confer-ence on Advanced Robotics.
Ioannis Konstas and Mirella Lapata. 2012. Unsuper-vised concept-to-text generation with hypergraphs. NAACL HLT ’12: Proceedings of the 2012 Confer-ence of the North American Chapter of the Asso-ciation for Computational Linguistics: Human Lan-guage Technologies.
Natalie K. Person, Roger J. Kreuz, Rolf A. Zwaan and Arthur C. Graesser. 1995. Pragmatics and Peda-gogy: Conversational Rules and Politeness Strate-gies May Inhibit Effective Tutoring. Journal of Cog-nition and Instruction, 13(2):161-188.
Ehud Reiter and Robert Dale. 2000. Building Natural Language Generation systems. Cambridge Univer-sity Press.
Verena Rieser, Oliver Lemon, and Xingkun Liu. 2010. Optimising Information Presentation for Spoken Di-alogue Systems. ACL ’10: Proceedings of the 48th Annual Meeting of the Association for Computa-tional Linguistics.
Somayajulu Sripada, Ehud Reiter, I Davy, and K Nilssen. 2004. Lessons from Deploying NLG Tech-nology for Marine Weather Forecast Text Gener-ation. In Proceedings of PAIS session of ECAI-2004:760-764.
Somayajulu Sripada, Ehud Reiter, Jim Hunter, and Jin Yu. 2003. Generating English Summaries of Time Series Data using the Gricean Maxims. KDD ’03: Proceedings of the ninth ACM SIGKDD interna-tional conference on Knowledge discovery and data mining.