ORIGINAL RESEARCH
ADULT BRAIN
Compressed Sensing–Sensitivity Encoding (CS-SENSE)
Accelerated Brain Imaging: Reduced Scan Time without
Reduced Image Quality
XJ.E. Vranic,XN.M. Cross,XY. Wang,X D.S. Hippe,XE. de Weerdt, andXM. Mossa-Basha
ABSTRACT
BACKGROUND AND PURPOSE:Compressed sensing–sensitivity encoding is a promising MR imaging acceleration technique. This study compares the image quality of compressed sensing–sensitivity encoding accelerated imaging with conventional MR imaging sequences.
MATERIALS AND METHODS: Patients with known, treated, or suspected brain tumors underwent compressed sensing–sensitivity en-coding accelerated 3D T1-echo-spoiled gradient echo or 3D T2-FLAIR sequences in addition to the corresponding conventional acquisition as part of their clinical brain MR imaging. Two neuroradiologists blinded to sequence and patient information independently evaluated both the accelerated and corresponding conventional acquisitions. The sequences were evaluated on 4- or 5-point Likert scales for overall image quality, SNR, extent/severity of artifacts, and gray-white junction and lesion boundary sharpness. SNR and contrast-to-noise ratio values were compared.
RESULTS:Sixty-six patients were included in the study. For T1-echo-spoiled gradient echo, image quality in all 5 metrics was slightly better for compressed sensing–sensitivity encoding than conventional images on average, though it was not statistically significant, and the lower bounds of the 95% confidence intervals indicated that compressed sensing–sensitivity encoding image quality was within 10% of conven-tional imaging. For T2-FLAIR, image quality of the compressed sensing–sensitivity encoding images was within 10% of the convenconven-tional images on average for 3 of 5 metrics. The compressed sensing–sensitivity encoding images had somewhat more artifacts (P⫽.068) and less gray-white matter sharpness (P⫽.36) than the conventional images, though neither difference was significant. There was no significant difference in the SNR and contrast-to-noise ratio. There was 25% and 35% scan-time reduction with compressed sensing–sensitivity encoding for FLAIR and echo-spoiled gradient echo sequences, respectively.
CONCLUSIONS: Compressed sensing–sensitivity encoding accelerated 3D T1-echo-spoiled gradient echo and T2-FLAIR sequences of the brain show image quality similar to that of standard acquisitions with reduced scan time. Compressed sensing–sensitivity encoding may reduce scan time without sacrificing image quality.
ABBREVIATIONS:CNR⫽contrast-to-noise ratio; CS⫽compressed sensing; SENSE⫽sensitivity encoding; SPGR⫽echo-spoiled gradient echo
T
he excellent soft-tissue contrast resolution and specialized se-quences targeting different aspects of pathophysiology make MR imaging the optimal technique for studying the brain. Despite the many advantages of brain MR imaging, MR imaging acquisi-tion is a time-consuming endeavor compared with CT. Longim-age-acquisition times limit both the clinical application and prac-ticality of MR imaging, particularly in medically unstable and pediatric patients.
MR imaging acquisition time is largely influenced by the num-ber of data points sampled fromk-space, the way these data points are sampled, and the way in which image reconstruction is per-formed. Several image-acquisition and postprocessing techniques have been developed to reduce image-acquisition time while still preserving image quality.1,2These include parallel MR imaging
and compressed sensing (CS) MR imaging techniques, which rely on different reconstruction constraints to accelerate image pro-duction.3Combining these techniques can lead to
image-acquisi-tion acceleraimage-acquisi-tion factors that far exceed what is achievable by either parallel or CS MR imaging alone.3-6This combined
image-accelera-tion technique is referred to as CS-sensitivity encoding (SENSE) MR
Received May 17, 2018; accepted after revision October 22.
From the Department of Radiology (J.E.V., N.M.C., D.S.H., M.M.-B.), University of Washington, Seattle, Washington; and Philips Healthcare (Y.W., E.d.W.), Best, the Netherlands.
Please address correspondence to Mahmud Mossa-Basha, MD, University of Washington Medical Center, 1959 NE Pacific St, Seattle, WA 98195; e-mail: [email protected]; @mossabas
Indicates article with supplemental on-line tables. Indicates article with supplemental on-line photo.
imaging, and it has the potential to dramatically decrease overall im-aging times while still preserving image quality.
Despite the many technical advancements that have been made in accelerating MR imaging acquisition and image recon-struction, robust evaluation of these acceleration techniques in clinical practice is still warranted. Clinical verification of the abil-ity of these accelerated image-acquisition techniques to produce diagnostic-quality images of the central nervous system is essen-tial before broader implementation of these imaging techniques into clinical practice can occur. Only a small number of studies have investigated the performance of CS-SENSE MR imaging in limited patient populations as it relates to body imaging.4,5Very
few studies have evaluated CS in brain MR imaging, with the studies performed focusing on the evaluation of multiple sclerosis lesions on T2-FLAIR,7brain MR imaging quality assessment in
healthy controls,8and evaluating achievable acceleration,
recon-struction schemes, and artifacts generated from retrospective CS.9
To date, however, no one has critically evaluated the clinical performance of the integrated CS-SENSE algorithm for MR imaging applied to imaging of the cen-tral nervous system, to our knowledge. In addition, we present the first work to apply CS acceleration in a brain tumor clinical population. The purpose of the current study was to compare the image quality of CS-SENSE accelerated 3D T1-echo-spoiled gradient echo (SPGR) SENSE SPGR) and T2-FLAIR (CS-SENSE FLAIR) sequences with the cor-responding conventional acquisitions. We hypothesized that CS-SENSE accel-erated sequences will have image quality equivalent to that of conventional ac-quisitions while accelerating imaging.
MATERIALS AND METHODS
Patient SelectionWith our institutional review board ap-proval and after obtaining informed written consent, adult patients (18 years of age or older) were prospec-tively scanned between February 8, 2017, and January 19, 2018, for assess-ment of the MR imaging brain tumor protocols of our institution with inclu-sion of a conventional sequence and a corresponding CS-SENSE accelerated acquisition when the clinical schedule permitted. CS-SENSE accelerated ac-quisition was performed before or after the corresponding conventional ac-quisition in alternating order (to mit-igate potential bias from ordering ef-fects), with both sequences performed after gadolinium administration for both T2-FLAIR and SPGR.
Image Acquisition
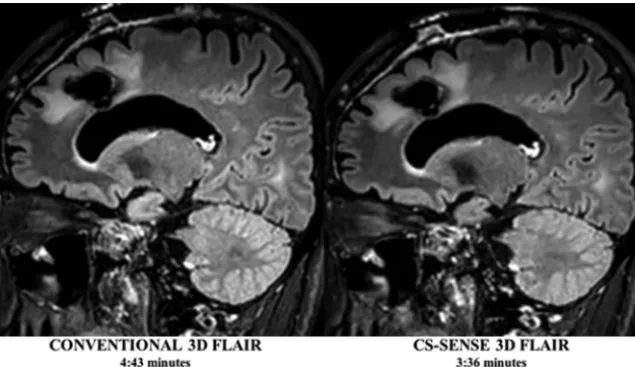
All imaging was performed on a 3T Ingenia MR imaging scanner (Philips Healthcare, Best, the Netherlands) using a 16-channel head coil (In Vivo, Gainesville, Florida). Each patient underwent the brain tumor imaging protocol of our institution. This in-cluded the following sequences: axial DWI, axial T1-spin-echo, sagittal 3D T2-FLAIR with gadolinium, axial 3D T1-SPGR with gadolinium, and coronal and axial T1-spin-echo with gadolin-ium. In addition to these conventional acquisitions, each patient underwent either a CS-SENSE accelerated 3D T2-FLAIR (Fig 1) or a CS-SENSE accelerated gadolinium-enhanced 3D T1-SPGR sequence (Fig 2), which was performed during their routine MR imaging examination. The sequence scan parameters for both the conventional and CS-SENSE MR imaging sequences are listed in
Table 1. The CS-SENSE FLAIR and CS-SENSE SPGR sequences had acceleration factors of 1.3 and 1.7 with scan time
reduc-FIG 1. Conventional and CS-SENSE accelerated sagittal 3D T2-FLAIR images from the same pa-tient demonstrate a treated primary brain tumor within the left frontal lobe. Note the sharp borders of the brain parenchymal lesion detected in both images, while CS-SENSE 3D FLAIR (right) was acquired with a 25% scan time reduction.
[image:2.594.56.374.47.230.2] [image:2.594.55.377.287.473.2]tions of 25% and 35% compared with the conventional acqui-sition counterparts, respectively. These CS-SENSE accelerated acquisitions used a balanced variable density incoherent un-dersampling acquisition scheme and iterative reconstruction to solve an inverse problem with a sparsity constraint. Specif-ically, the images were acquired using a random undersam-pling pattern with the Poisson disc style distribution. Image reconstruction was performed using a wavelet transform for the sparsity term, according to the common CS and parallel imaging problem definitions. Prior knowledge of noise decor-relation, regularization, and coil sensitivities was used to pro-vide an optimal SNR as a starting point, allowing additional acceleration capabilities via sparsity constraining. The recon-struction algorithm was based on a modified fast iterative shrinkage/ soft thresholding algorithm (FISTA) scheme,10which entails
itera-tive reconstruction. Conventional clinical acquisition T2-FLAIR and T1-SPGR sequences served as imaging control sequences against which the CS-SENSE FLAIR and SPGR sequences could be compared.
Image Evaluation
Two experienced board-certified neuroradiologists (M.M.-B. and N.M.C.) blinded to the imaging technique and patient clinical information independently evaluated all CS-SENSE and corre-sponding conventional sequences. All imaging studies were de-identified and randomized so that each rater was unaware of whether they were reviewing a CS-SENSE or conventional acqui-sition. Raters evaluated overall imaging quality on the following 4-point scale: 1, nondiagnostic; 2, limited but interpretable; 3, minimally limited; and 4, optimal quality. Image SNR was rated on the following 5-point scale: 1, markedly diminished SNR that renders the images uninterpretable; 2, moderately diminished SNR that affects interpretation; 3, diminished SNR that only mildly limits interpretation; 4, mildly diminished SNR that does not affect image interpretation; and 5, optimal SNR. Image arti-facts were evaluated on the following 5-point scale: 1, severe im-age artifacts; 2, moderate artifacts; 3, mild artifacts; 4, trace arti-facts; and 5, no artifacts. Brain parenchymal lesion border sharpness was evaluated on the following 3-point scale: 1, a lesion whose borders were indistinguishable from background brain; 2, a lesion with blurry margins; and 3, sharp lesion margins. Finally, gray-white matter sharpness was assessed using the following 3-point scale: 1, indistinguishable gray-white sharpness; 2, blurry gray-white sharpness; and 3, well-defined gray-white sharpness.
In addition to qualitative image evaluation, quantitative evaluation of SNR and the contrast-to-noise ratio (CNR) was also performed for each CS-SENSE and conventional acquisi-tion, respectively. For each patient, ROIs were drawn on rep-resentative images from each CS-SENSE and conventional ac-quisition. ROIs were positioned within the normal subcortical white matter, within a focal brain lesion, and outside the pa-tient, in what was classified as image background. All ROIs were the same size and had nearly identical positioning be-tween sequences. As reported elsewhere in the literature,7,11
SNR and CNR were calculated as follows: SNR⫽SI/SDnoise
and CNR⫽(SIlesion⫺SIWM)/SDnoise, where SI is the average
signal intensity of the lesion or white matter and SDnoiseis the
SD of noise.
Statistical Analysis
While raters evaluated images using 4- or 5-point scales, they ultimately only used 2–3 levels of each scale, with the middle level being the most common. To improve interpretability, we dichot-omized all scales, mainly to get the best possible balance of ratings above and below the threshold. Specifically, image quality was dichotomized as optimal image quality (5 versus 1– 4), optimal SNR (5 versus 1– 4), no or trace artifacts (4 –5 versus 1–3), sharp gray-white matter boundaries (3 versus 1–2), and sharp lesion boundaries (3 versus 1–2).
The percentages for each image-quality metric were compared between CS-SENSE and the corresponding conventional images (FLAIR versus CS-FLAIR, SPGR versus CS-SPGR) using the non-parametric bootstrap to calculate 95% CI andPvalues for the differences. The widths of the 95% CIs were used to help assess a plausible range of differences in image quality between CS-SENSE and the corresponding conventional images. Ratings from both raters were analyzed together for the primary analysis and sepa-rately as a sensitivity analysis. Bootstrap resampling was per-formed by patient to account for the nonindependence of ratings by both raters of the same images and for multiple scans acquired from some patients.
[image:3.594.51.538.55.181.2]Interrater agreement was assessed using the Cohenand by counting how often both raters, 1 rater, and neither rater rated CS-SENSE images at least as highly as conventional images. All statistical calculations were conducted with R statistical and com-puting software (Version 3.1.1; http://www.r-project.org/). Throughout, 2-tailed tests were used with statistical significance defined asP⬍.05.
Table 1: Imaging parameters for CS-SENSE accelerated and conventional MRI sequences
3D T2-FLAIR CS-SENSE 3D T2-FLAIR 3D T1-SPGR CS-SENSE 3D T1-SPGR
FOV (cm) 230⫻2230⫻150 230⫻230⫻150 240⫻240⫻168 240⫻240⫻168
True voxel size (mm3) 1⫻1⫻2 1⫻1⫻2 1.1⫻1.1⫻1.1 1.1⫻1.1⫻1.1
Interpolated voxel (mm3) 1⫻1⫻1 1⫻1⫻1 1⫻1⫻0.5 1⫻1⫻0.5
TR/TE (ms) 25/3.6 25/3.6 4800/301 4800/301
Slices (No.) 150 150 300 300
TI (ms) – – 1650 1650
SENSE acceleration factor (RL, FH) (2, 1) (2, 1) (2.4, 1.7) (2.4, 1.7)
CS acceleration factor – 1.3 – 1.7
Total acceleration factor 2 3.4 4.1 5.3
Scan time (min:sec) 4:33 3:36 4:43 2:56
Scan time reduction – 25% 35%
RESULTS
Patient DataSixty-nine patients were reviewed. Three patients were scanned with 1 of the 2 accelerated image-acquisition sequences but were not scanned with the corresponding conventional sequence and were excluded from analysis. This step resulted in a final cohort of 66 patients. Of these 66 patients, 35 patients were imaged with CS-SENSE FLAIR for a total of 35 scans (16 women [45.7%]; 25–74 years of age; median, 47 years). Thirty-one patients were imaged with the CS-SENSE SPGR, with 1 patient being scanned twice and a second patient being scanned 3 times, each at different time points, resulting in a total of 34 CS-SENSE SPGR scans (16 women [51.6%]; 18 – 83 years of age; median, 63 years). Ninety-five percent of patients in-cluded in this cohort demonstrated brain lesions on MR imag-ing (On-line Table 1). There were a total of 89 and 56 lesions on FLAIR and SPGR, respectively. There were lesions in 34 pa-tients (34 scans) in the FLAIR cohort, 22 of whom had multiple lesions. Lesions were also present in 29 patients (32 scans) in the SPGR cohort, 10 of whom had multiple lesions. Lesion sizes are summarized in On-line Table 2.
Qualitative Image Comparison
Pooled image-quality ratings are summarized inTable 2. For FLAIR, there were no statistically significant differences in overall image quality, SNR, gray-white matter boundary sharpness, or lesion-border sharpness between CS-SENSE and conventional se-quences, with the lower bound of the 95% CIs indicating that image quality of the CS-SENSE images was within approximately 10% of the conventional images by these metrics. However, there was a trend toward more artifacts on CS-SENSE compared with conventional images (11.4%,P⫽.068).
For SPGR, there were no significant differences in any image-quality metric between CS-SENSE and conventional SPGR, though CS-SENSE images had slightly higher image-quality rat-ings on average than the conventional images. By each metric,
image-quality ratings of CS-SENSE were within 10% of the con-ventional SPGR ratings based on the lower bound of the 95% CI. Differences in image quality were most noticeable between the CS-SENSE SPGR and the standard SPGR; 50% of accelerated SPGR studies demonstrated optimal image quality compared with 37% of the standard SPGR acquisitions.
The image-quality results were generally similar when exam-ined by each rater separately with a few notable exceptions. For FLAIR, rater 1 tended to rate gray-white boundary sharpness of CS-SENSE images more highly than on conventional images (⫹8.6%,P⫽.14), while rater 2 rated CS-SENSE images lower than on conventional images (⫺17.1%,P⬍.001). For SPGR, rater 1 rated SNR and lack of artifacts in CS-SENSE images more highly than on conventional images (⫹20.6%,P⫽.026 and⫹26.5%,P ⫽.027, respectively), while rater 2 rated the images more similarly (⫺11.8%,P⫽.27 and⫹0.0%,P⬎.99, respectively).
Interrater Agreement
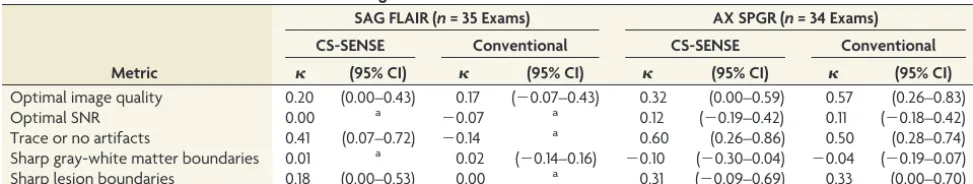
[image:4.594.51.541.57.139.2]Interrater agreement scores for the CS-SENSE and conventional sequences are listed inTable 3. Interrater agreement for each im-age quality was mostly poor to fair for FLAIR (⬍0.4) but fair to moderate for SPGR (⫽0.2– 0.6). Despite some differences in absolute ratings, raters both agreed 77%–91% of the time that the image-quality metrics of the CS-SENSE FLAIR were at least as good as the those of conventional images and rarely agreed that the CS-SENSE FLAIR images were worse than conventional im-ages (Table 4). Similarly, raters both agreed 67%– 87% of the time that the image-quality metrics of the CS-SENSE SPGR were at least as good as those of the conventional images, while only agreeing 0%– 6% of the time that the conventional images were better. In terms of disagreement, there was⬎1 disagreement on the Likert scale only for artifact severity (On-line Figure), which occurred in 7/69 comparisons. This level of disagreement did not occur for any other qualitative metrics.
Table 2: CS-SENSE and conventional MRI sequence qualitative evaluation
Metric
SAG FLAIR (n= 70 Reads) SPGR (n= 68 Reads) Acquisitiona
Difference Acquisitiona
Difference
CS-SENSE Conventional Mean (95% CI) PValue CS-SENSE Conventional Mean (95% CI) PValue Optimal image quality 19 (27.1) 19 (27.1) 0.0% (⫺510.0–10.0) ⬎.99 34 (50.0) 25 (36.8) 13.2% (⫺5.7–31.8) .15 Optimal SNR 6 (8.6) 5 (7.1) 1.4% (⫺55.7–8.6) .67 27 (39.7) 24 (35.3) 4.4% (⫺59.7–18.2) .55 No or trace artifacts 52 (74.3) 60 (85.7) ⫺511.4% (⫺524.3–0.0) .068 46 (67.6) 37 (54.4) 13.2% (⫺53.0–28.6) .11 Sharp gray-white matter boundaries 36 (51.4) 39 (55.7) ⫺54.3% (⫺512.9–4.3) .36 27 (39.7) 26 (38.2) 2.2% (⫺58.1–12.2) .67 Sharp lesion boundaries 57 (86.4) 55 (83.3) 2.3% (⫺57.1–11.7) .65 52 (83.9) 52 (83.9) 0.8% (⫺58.6–10.0) .84
Note:—SAG indicates sagittal.
a
Values are No. (%) where higher percentages indicate a higher prevalence of good image quality.
Table 3: CS-SENSE and conventional MRI interrater agreement
Metric
SAG FLAIR (n= 35 Exams) AX SPGR (n= 34 Exams)
CS-SENSE Conventional CS-SENSE Conventional
(95% CI) (95% CI) (95% CI) (95% CI)
Optimal image quality 0.20 (0.00–0.43) 0.17 (⫺0.07–0.43) 0.32 (0.00–0.59) 0.57 (0.26–0.83)
Optimal SNR 0.00 a ⫺0.07 a 0.12 (⫺0.19–0.42) 0.11 (⫺0.18–0.42)
Trace or no artifacts 0.41 (0.07–0.72) ⫺0.14 a 0.60 (0.26–0.86) 0.50 (0.28–0.74)
Sharp gray-white matter boundaries 0.01 a 0.02 (⫺0.14–0.16) ⫺0.10 (⫺0.30–0.04) ⫺0.04 (⫺0.19–0.07) Sharp lesion boundaries 0.18 (0.00–0.53) 0.00 a 0.31 (⫺0.09–0.69) 0.33 (0.00–0.70) Note:—AX indicates axial; SAG, sagittal.
a
[image:4.594.53.540.175.267.2]Quantitative Assessment
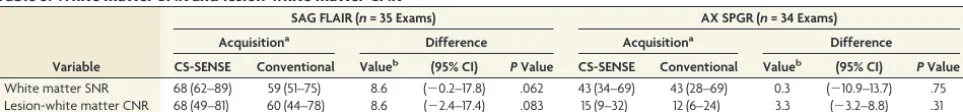
The white matter SNR or lesion CNR measurements were high for both conventional and CS-SENSE FLAIR acquisitions (ⱖ44 in all cases), though there was a trend toward higher SNR and CNR values on average for the CS-SENSE acquisition (Table 5). White matter SNR measurements were also relatively high for conven-tional and CS-SENSE SPGR acquisitions (ⱖ28 in all cases) with little numeric difference between them on average (difference in medians, 0.3;P⫽.75). The lesion CNR measurements from the SPGR acquisitions tended to be lower and ranged from 9 to 24 overall. The CNR was slightly higher on average in CS-SENSE than on the conventional acquisitions (difference in medians, 3.3;P⫽.31), but the difference was not statistically significant (Table 5).
DISCUSSION
Long MR imaging acquisition times represent a significant limi-tation to widespread use of MR imaging. This is especially true for MR imaging in the evaluation of both clinically unstable and pe-diatric patients: Increased MR imaging scan time may expose these individuals to an increased need for sedation or result in limited diagnostic quality due to motion. Long image-acquisition times also negatively impact radiology workflow, leading to scheduling bottlenecks. Finally, long acquisition times contribute to the high cost of MR imaging. Given the significance of image-acquisition time for patient safety, clinical efficiency, image qual-ity, and cost, technical effort has been made to decrease image-acquisition and reconstruction times. CS techniques show promise in providing imaging acceleration without significant image-quality degradation. Despite the promise these accelera-tion techniques hold for improving patient throughput and de-creasing imaging cost, rigorous evaluation of the performance of these acceleration techniques in a clinical imaging population has yet to be undertaken. To our knowledge, this is the first study to translate CS-SENSE, which combines and integrates CS and SENSE parallel imaging, to a clinical brain tumor patient
popula-tion to evaluate image quality relative to corresponding conven-tional MR imaging sequences.
In the current study, we hypothesized that CS-SENSE acceler-ated sequences would have image quality equivalent to that of standard acquisitions while accelerating imaging. To evaluate this hypothesis, we compared the clinical performance of 2 CS-SENSE accelerated MR imaging sequences with their corresponding con-ventional sequences in a clinical cohort undergoing brain tumor MR imaging scans. On the basis of blinded multirater evaluations of multiple clinically pertinent imaging variables, these acceler-ated acquisitions largely performed as well as their conventional counterparts across several image-quality metrics, including overall image quality, SNR, image artifacts, gray-white matter boundary sharpness, and parenchymal lesion border sharpness. In particular, the lower bounds of 95% CIs of the differences in image quality between CS-SENSE and conventional images indi-cated that the CS-SENSE images were within 10% of the conven-tional images for all metrics for the SPGR sequence and for 3 of 5 metrics for the FLAIR sequence. The CS-SENSE acquisitions had no significant differences in white matter SNR and lesion CNR relative to their corresponding conventional acquisitions, and in fact, there was a trend toward higher values for the CS-SENSE FLAIR relative to the conventional FLAIR. CS-SENSE showed at least comparable SNR and CNR measures relative to their con-ventional counterparts. While this finding is somewhat counter-intuitive considering the undersampling algorithm used by CS-SENSE, increased/similar SNR is thought be a result of the denoising algorithm incorporated into CS-SENSE. CS-SENSE FLAIR and SPGR sequences decreased imaging time by 25% and 35% relative to conventional sequences, respectively. These re-sults confirm that CS-SENSE sequences produce diagnostic-qual-ity MR images of the brain specifically for brain tumor protocols while reducing overall image-acquisition time compared with conventional acquisitions.
To date, multiple MR imaging techniques have been devel-oped with the goal of accelerating image-acquisition and
recon-Table 4: Interrater agreement on image-quality comparisons of CS-SENSE and conventional MRIa
Metric
SAG FLAIR (n= 35 Exams) AX SPGR (n= 34 Exams) Image Quality of
CS-SENSE ≥ Conventional
Image Quality of CS-SENSE ≥ Conventional Both Raters 1 Rater Neither Rater Both Raters 1 Rater Neither Rater
Optimal image quality 28 (80.0) 7 (20.0) 0 (0.0) 26 (76.5) 6 (17.6) 2 (5.9)
Optimal SNR 32 (91.4) 3 (8.6) 0 (0.0) 23 (67.6) 10 (29.4) 1 (2.9)
Trace or no artifacts 27 (77.1) 5 (14.3) 3 (8.6) 29 (85.3) 3 (8.8) 2 (5.9)
Sharp gray-white matter boundaries 28 (80.0) 7 (20.0) 0 (0.0) 26 (76.5) 8 (23.5) 0 (0.0)
Sharp lesion boundaries 29 (87.9) 4 (12.1) 0 (0.0) 27 (87.1) 3 (9.7) 1 (3.2)
Note:—SAG indicates sagittal; AX, axial.
a
[image:5.594.52.536.55.158.2]Values are No. (%).
Table 5: White matter SNR and lesion-white matter CNR
Variable
SAG FLAIR (n= 35 Exams) AX SPGR (n= 34 Exams) Acquisitiona
Difference Acquisitiona
Difference
CS-SENSE Conventional Valueb
(95% CI) PValue CS-SENSE Conventional Valueb
(95% CI) PValue White matter SNR 68 (62–89) 59 (51–75) 8.6 (⫺0.2–17.8) .062 43 (34–69) 43 (28–69) 0.3 (⫺10.9–13.7) .75 Lesion-white matter CNR 68 (49–81) 60 (44–78) 8.6 (⫺2.4–17.4) .083 15 (9–32) 12 (6–24) 3.3 (⫺3.2–8.8) .31
Note:—SAG indicates sagittal; AX, axial.
a
Values are median (interquartile range).
b
[image:5.594.56.538.196.252.2]struction times. Examples of these acceleration techniques in-clude parallel imaging and CS. Because parallel imaging and CS rely on different pieces of ancillary information for image produc-tion, it is possible to combine and integrate these acceleration techniques,1-3,5,6,12with the resultant combined technique referred
to as CS-SENSE MR imaging. Most interesting, integration of these 2 individual acceleration techniques is synergistic and results in an im-aging-acceleration factor that exceeds the accelerations achieved by either parallel imaging or CS alone while still keeping image noise low.3,5Liang et al3illustrated this principle using MR imaging
phan-toms, demonstrating superior performance of CS-SENSE relative to parallel imaging or CS alone at increasing acceleration factors. Otazo et al5independently came to similar conclusions when they
demon-strated that a combined CS-SENSE technique resulted in a 2-fold increase in acceleration over CS alone.
Despite the increases in imaging acceleration observed with in vitro phantom imaging, little has been done to evaluate the per-formance of CS-SENSE acceleration techniques in a clinical pa-tient population. Chandarana et al4 used a novel CS-SENSE
accelerated T1-weighted gradient-echo technique with a golden-angle radialk-space sampling scheme to evaluate 8 healthy sub-jects undergoing multiphase liver MR imaging. The authors con-cluded that their CS-SENSE accelerated sequence produced diagnostic-quality images. Kayvanrad et al8evaluated accelerated
brain MR imaging using CS, parallel imaging, or low-resolution scans in 5 healthy volunteers and found that CS significantly out-performed parallel imaging and low-resolution imaging with a number of sequences. Sharma et al9performed retrospective CS
of fully acquired datasets in 15 neuroimaging datasets to deter-mine appropriate reconstructions and delineate expected artifacts in these reconstructions; they found 2-fold acceleration to be appropriate with ringing and blurring artifacts the most com-monly encountered artifacts. These studies evaluated small co-horts of healthy volunteers and not patient populations. Tole-dano-Massiah et al7evaluated the clinical performance of CS 3D
FLAIR in a multiple sclerosis population and demonstrated that CS produces diagnostic-quality images of the brain while reduc-ing imagreduc-ing time. In contrast to this study, which evaluated CS-accelerated FLAIR image quality, we evaluated the clinical perfor-mance of CS-SENSE acceleration of both T1- and T2-weighted sequences in a brain tumor patient population that has not pre-viously been evaluated with these acceleration techniques.
CS-SENSE has its own inherent technical limitations. While undersampling ofk-space is essential to decreasing image-acqui-sition time, if too few data points are acquired, then image quality is adversely affected. This issue manifests as decreased SNR and increased image blurring.3Technical challenges also arise during
image reconstruction. To accurately reconstruct CS-SENSE im-ages, solution of an optimization problem with multiple mathe-matical constraints is required. This process proves computation-ally complex and time-consuming. Fortunately, immediate sensitivity coil compression to a smaller number of virtual coils can aid in reducing the time required to complete the iterative reconstruction process.13The iteration used in the current
exam-ination reconstructs inline in⬍1 minute.
Our study had several limitations and challenges. The clinical cohort evaluated was relatively limited in size. Additionally, the
current study evaluated imaging acceleration using CS-SENSE in patients undergoing an MR imaging brain tumor protocol. Indi-viduals with other central nervous system pathologies were not included in our clinical cohort, limiting generalizability to other brain MR imaging applications. Because imaging focused on the brain, these results may not be generalizable to other pathologies or anatomic sites including spine, head and neck, and body MR imaging. Further investigation is necessary to establish the value of CS-SENSE in these anatomic regions. Interrater agreement () ranged from 0 to 0.6 for the current study across all evaluations. The raters reviewed the accelerated sequences randomly and in-dependent of the corresponding conventional acquisition using qualitative scales, both of which likely contributed to the limited agreement. Although raters had disagreements on the actual rat-ing, they usually agreed⬎80% of the time that CS-SENSE image-quality metrics were at least as good as those for conventional images. Last, raters did not perform a diagnostic or clinical task such as detecting or characterizing lesions or changes in lesions, so further study is needed to confirm that these tasks are not ad-versely affected by CS-SENSE acceleration.
CONCLUSIONS
Accelerated CS-SENSE MR imaging provides equivalent image quality compared with corresponding conventional MR imaging in patients undergoing brain MR imaging of tumor by 3D T2-FLAIR and T1-SPGR sequences based on qualitative and quanti-tative assessment. CS-SENSE acceleration does not appear to ad-versely impact overall image quality relative to the corresponding conventional acquisitions. The results of this study are consistent with our hypothesis that there are no appreciable differences be-tween the CS-SENSE acquisitions and their conventional coun-terparts. On the basis of these results, use of CS-SENSE acceler-ated sequences in clinical practice can be considered to reduce scan time and improve throughput without loss of image quality, specifically for 3D T2-FLAIR and T1-SPGR sequences in brain tumor MR imaging protocols.
Disclosures: Daniel S. Hippe—UNRELATED:Grants/Grants Pending: National In-stitutes of Health (R01NS092207), GE Healthcare, Philips Healthcare, Toshiba America Medical Systems, Siemens,Comments: for statistical work on other studies.* Elwin de Weerdt—UNRELATED:Employment: Royal Philips. *Money paid to the institution.
REFERENCES
1. Chun IY, Adcock B, Talavage TM.Efficient compressed sensing SENSE pMRI reconstruction with joint sparsity promotion.IEEE Trans Med Imaging2016;35:354 – 68CrossRef Medline
2. Tsao J, Kozerke S.MRI temporal acceleration techniques.J Magn Reson Imaging2012;36:543– 60CrossRef Medline
3. Liang D, Liu B, Wang J, et al.Accelerating SENSE using compressed sensing.Magn Reson Med2009;62:1574 – 84CrossRef Medline
4. Chandarana H, Feng L, Block TK, et al.Free-breathing contrast-enhanced multiphase MRI of the liver using a combination of com-pressed sensing, parallel imaging, and golden-angle radial sam-pling.Invest Radiol2013;48:10 –16CrossRef Medline
5. Otazo R, Kim D, Axel L, et al.Combination of compressed sensing and parallel imaging for highly accelerated first-pass cardiac perfu-sion MRI.Magn Reson Med2010;64:767–76CrossRef Medline
7. Toledano-Massiah S, Sayadi A, de Boer R, et al.Accuracy of the com-pressed sensing accelerated 3D-FLAIR sequence for the detection of MS plaques at 3T.AJNR Am J Neuroradiol2018 Jan 18. [Epub ahead of print]CrossRef Medline
8. Kayvanrad M, Lin A, Joshi R, et al.Diagnostic quality assessment of compressed sensing accelerated magnetic resonance neuroimag-ing.J Magn Reson Imaging2016;44:433– 44CrossRef Medline
9. Sharma SD, Fong CL, Tzung BS, et al.Clinical image quality as-sessment of accelerated magnetic resonance neuroimaging us-ing compressed sensus-ing.Invest Radiol2013;48:638 – 45CrossRef Medline
10. Zibulevsky M, Elad M.L1–L2 optimization in signal and image pro-cessing.IEEE Signal Processing Magazine2010;27:76 – 88CrossRef
11. Kaufman L, Kramer DM, Crooks LE, et al.Measuring signal-to-noise ratios in MR imaging.Radiology1989;173:265– 67CrossRef Medline
12. Liu F, Duan Y, Peterson BS, et al.Compressed sensing MRI com-bined with SENSE in partial k-space.Phys Med Biol2012;57:N391– 403CrossRef Medline