ORIGINAL RESEARCH
ADULT BRAIN
Deep Learning–Based Detection of Intracranial Aneurysms in
3D TOF-MRA
XT. Sichtermann,XA. Faron,X R. Sijben,XN. Teichert,XJ. Freiherr, andX M. Wiesmann
ABSTRACT
BACKGROUND AND PURPOSE: The rupture of an intracranial aneurysm is a serious incident, causing subarachnoid hemorrhage associ-ated with high fatality and morbidity rates. Because the demand for radiologic examinations is steadily growing, physician fatigue due to an increased workload is a real concern and may lead to mistaken diagnoses of potentially relevant findings. Our aim was to develop a sufficient system for automated detection of intracranial aneurysms.
MATERIALS AND METHODS: In a retrospective study, we established a system for the detection of intracranial aneurysms from 3D TOF-MRA data. The system is based on an open-source neural network, originally developed for segmentation of anatomic structures in medical images. Eighty-five datasets of patients with a total of 115 intracranial aneurysms were used to train the system and evaluate its performance. Manual annotation of aneurysms based on radiologic reports and critical revision of image data served as the reference standard. Sensitivity, false-positives per case, and positive predictive value were determined for different pipelines with modified pre- and postprocessing.
RESULTS:The highest overall sensitivity of our system for the detection of intracranial aneurysms was 90% with a sensitivity of 96% for aneurysms with a diameter of 3–7 mm and 100% for aneurysms of⬎7 mm. The best location-dependent performance was in the posterior circulation. Pre- and postprocessing sufficiently reduced the number of false-positives.
CONCLUSIONS: Our system, based on a deep learning convolutional network, can detect intracranial aneurysms with a high sensitivity from 3D TOF-MRA data.
ABBREVIATIONS:CNN⫽convolutional neural network; DSC⫽Dice similarity coefficient; FPs/case⫽false-positives per case
U
nruptured intracranial aneurysms are common among the general population. It is estimated that approximately 3% of healthy adults have an intracranial aneurysm.1These aneurysms often remain undiagnosed unless they become symptomatic (eg, by compression of adjacent neural structures or rupture into the subarachnoid space).2Rupture of an intracranial aneurysm is a serious incident with high fatality and morbidity rates.3Identifi-cation of factors contributing to the risk of intracranial aneurysm development, growth, and rupture is an active field of investiga-tion. Apart from several disorders like polycystic kidney disease or Marfan syndrome, elements such as genetic factors, family his-tory, female sex, and age are linked to an increased risk of aneu-rysm development. Intracranial aneuaneu-rysm site, size, and shape are further strongly associated with the risk of rupture.4-6Detection of an intracranial aneurysm before it becomes symptomatic al-lows endovascular or surgical treatment of the aneurysm before it ruptures and may thus prevent death or morbidity.
DSA is still considered the criterion standard in evaluating intracranial vessels and detection of intracranial aneurysms7; however, it is inconvenient for primary diagnoses because it is invasive and time-consuming. CTA and MRA are noninvasive methods widely used in clinical routine. Unlike DSA and CTA, which are based on x-ray imaging, MRA does not cause radiation exposure. It is therefore the preferred technique for screening asymptomatic patients for intracranial pathology. The number of radiology examinations performed for diagnoses is steadily in-Received June 5, 2018; accepted after revision October 29.
From the Department of Diagnostic and Interventional Neuroradiology (T.S., A.F., R.S., N.T., J.F., M.W.), University Hospital RWTH Aachen, Aachen, Germany; ment of Radiology (A.F.), University Hospital Bonn, Bonn, Germany; and Depart-ment of Diagnostic and Interventional Neuroradiology (N.T.), University Hospital Düsseldorf, Du¨sseldorf, Germany.
Thorsten Sichtermann and Anton Faron contributed equally to this work.
This work was supported by Nvidia Corporation with the donation of a Titan XP GPU.
Please address correspondence to Thorsten Sichtermann, MD, Klinik fu¨r Diagnos-tische und Interventionelle Neuroradiologie, Universita¨tsklinikum Aachen, Pau-welsstr 30, 52074 Aachen, Germany; e-mail: [email protected]
creasing.8,9Given the growing workload of radiology depart-ments, physician fatigue with the inherent risk of missed diagno-sis of potentially significant findings is a relevant concern. Hence, a reliable method for automated detection of intracranial aneu-rysms from routine diagnostic imaging would be of great utility in clinical routine.
Rapid advances in the field of computing and a growing amount of data prompted the rise of convolutional neural net-works (CNNs), a specific type of deep learning network archi-tecture, for segmentation, classification, and detection tasks in medical imaging.10-12 The training process of a CNN is straightforward to implement because the features for discrim-ination of the desired output classes are not designed but learned in an automated fashion from the input data.13Several approaches for automated detection of intracranial aneurysms from noninvasive imaging have been proposed in the litera-ture.14-17However, a deep learning– based method for sufficient detection of intracranial aneurysms from 3D TOF data has not yet been reported, to our knowledge. The aim of this study was to investigate the potential of a deep learning algorithm for auto-mated detection of intracranial aneurysms from 3D TOF-MRA clinical data.
MATERIALS AND METHODS
DatasetThis retrospective study was approved by the Independent Ethics Committee at the RWTH Aachen Faculty of Medicine. The re-quirement for informed consent was waived. From an internal data base belonging to our department, we incorporated data from all patients with a 3D TOF-MRA examination of at least 1 previously untreated intracranial aneurysm. Images were ob-tained for clinical purposes between 2015 and 2017. After we removed protected patient information and substituted sub-ject identifiers, examinations were retrieved from the local PACS. The dataset consisted of 85 examinations. Of those, 72 image sets originated from our department. Sixty of these ex-aminations were performed on a 3T scanner (Magnetom Prisma; Siemens; Erlangen, Germany). Twelve examinations were performed on a 1.5 scanner (Magnetom Aera; Siemens). The following parameters were used for the 3D TOF-MRA: Magnetom Prisma (3T)—TR, 21 ms; TE, 3.42 ms; flip angle, 18°; FOV, 200 mm; section thickness, 0.5 mm; matrix, 348⫻384; acquisition time, 5 minutes 33 seconds; 20-channel head/neck coil; Magnetom Area (1.5T)—TR, 28 ms; TE, 7 ms; flip angle, 25°; FOV, 200 mm; section thickness, 0.5 mm; matrix, 256⫻320; acquisition time, 5 minutes 52 seconds; 20-channel head/neck coil.
Thirteen examinations included in this dataset originated from external departments and were performed on different scanners.
We included all TOF acquisitions with at least 1 previously untreated aneurysm, irrespective of etiology, symptomatology, and configuration (saccular, fusiform, and dissecting). The aneu-rysms were located in the internal carotid arteries, the anterior cerebral arteries (including the anterior communicating artery), the middle cerebral arteries, or the posterior circulation (in-cluding the vertebral, basilar, posterior, cerebral, and posterior
communicating arteries). One patient had polycystic kidney disease, while the remainder had incidental findings. Exclusion criteria were previous treatment (coil embolization or surgical clipping) or pronounced motion artifacts, preventing accurate segmentation.
The DeepMedic (Version .6.1; https://biomedia.doc.ic.ac.uk/ software/deepmedic/) CNN was used18with an application of re-quired preprocessing on the dataset19: voxel size resampling (0.5⫻0.5⫻0.5 mm3) and intensity normalization to a
zero-mean, unit-variance space. To evaluate the impact of preprocess-ing on the performance of the CNN, we modified our dataset using different BET2 skull-stripping (https://fsl.fmrib.ox.ac.uk/ fsl/fslwiki/BET)20and performing N4 bias correction.21
The ground truth segmentation was performed by a neurora-diology resident experienced in cranial diagnostic imaging. On the basis of radiologic reports, anonymized TOF data were criti-cally reviewed, and aneurysms were manually annotated in a vox-elwise manner using the manual segmentation tool of ITK-SNAP (www.itksnap.org).22Intrarater reliability was studied using the Pearson correlation coefficient.
After evaluation of the dataset, we trained DeepMedic and performed inference to segment aneurysms. Remarkably, 2 aneu-rysms that had been previously overlooked were detected by the CNN in this early stage. Consequently, the dataset was validated by another radiologist who was blinded to the radiology reports. Complete ground truth was evaluated once again and adjusted accordingly.
The dataset needed division into training, test, and validation sets, to run the CNN and assess its performance. The training set was used for learning, which describes the process of fitting the parameters of the network to learn features for discriminating the output classes. The validation set was used during training to re-duce overfitting to the training data. This is done by comparing the Dice similarity coefficient (DSC) (a measure indicative of seg-mentation accuracy) of the training samples with the DSC of the unknown validation samples and adjusting the learning rate of the network. The test set is used for evaluation of the trained model.18 Training the model took about 20 hours; inference per case was about 50 seconds on a Titan XP GPU (Nvidia, Santa Clara, California).
Five-fold cross-validation was performed. For each split, the whole dataset was randomly divided into the 3 subsets as ex-plained earlier: training set (58 cases, 68%), validation set (10 cases, 12%), and test set (17 cases, 20%).
DeepMedic and Evaluation
Segmentation of the aneurysms was executed with the DeepMedic framework, a CNN for voxelwise classification of medical imaging data after training with 3D patches at multiple scales. DeepMedic was developed and evaluated for the segmentation of brain lesions.23
The network consists of 2 pathways with 11 layers. Both pathways are identical, but the input of the second pathway is a subsampled version of the first (see the full architecture inFig 1). Parameters were set as proposed by Kamnitsas et al18: An initial learning rate of 10⫺3
10⫺6and L2⫽10⫺4regularization was performed. To accelerate the convergence, we used Rectified Linear Unit activation functions and batch-normalization as implemented in the DeepMedic frame-work.23We used the proposed DeepMedic hybrid sampling scheme. In this strategy, image segments larger than the neural network’s re-ceptive field are given as an input to the network. A training batch is built by extracting segments with 50% probability centered on the foreground or background voxels, facilitating an automatic method for balancing the distribution of training samples regarding the size of the desired class in the segment and therefore preventing class imbalance by adjusting to the true distribution of background and aneurysm voxels.18With a probability of 50%, the training images were mirrored on the coronal axis to increase the diversity of the training set.
We used the EvaluateSegmentation Tool (https://github.com/ Visceral-Project/EvaluateSegmentation)24to analyze the segmen-tation results by determining Hausdorff distances and the DSC. For methodologic reasons, each segmented voxel or connected component of voxels in the output binary segmentation was con-sidered a positive detection. Each positive detection that corre-sponded to an aneurysm in ground truth was considered a true-positive finding, while each true-positive detection that did not correspond to an aneurysm in ground truth was considered a false-positive finding. In preliminary studies, this approach led to a very high rate of false-positive detections. Because we observed that compared with true-positive detections, false-positives tended to be rather small, we further examined whether the inte-gration of a detection threshold as a postprocessing step, remov-ing connected components smaller than a given volume, would
improve our results. On the basis of the composition of our data-set, detection thresholds of 5, 6, and 7 mm3were studied (Fig 1).
To further reduce the number of false-positives, we fine-tuned the network using a modified training strategy in which 90% of the input samples corresponded to background class; and 10%, to aneurysm class, reflecting a more realistic distribution of aneu-rysms. The learning rate was lowered to 10⫺4and the pretrained weights of the last 3 layers were changed while the training weights of the other layers were kept constant. To study the reliability of true-positive detections and the capability of the system in pre-dicting aneurysm size, we compared the volume segmented by the algorithm with the manually examined volume of the ground truth.
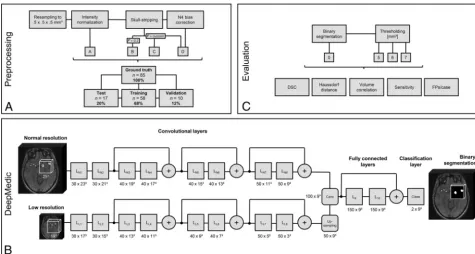
To assess the impact of preprocessing, we evaluated 4 models (A–D). In model A, only the necessary steps to obtain reasonable results from DeepMedic, resampling to isotropic voxel size and intensity normalization, were performed. Additional skull-strip-ping is advised in the DeepMedic documentation.18We used the well-established BET2 skull-stripping method. Skull-stripping in model B was performed with a fixed fractional intensity threshold of 0.2. In model C, the parameter was adjusted manually in each case to receive an optimal brain outline, without nonbrain struc-tures such as skull or parts of the ocular muscles and nerves. For model D, we used the skull-stripping masks from model C and performed an additional N4 bias correction25to evaluate whether low-frequency intensity inhomogeneities in the acquisitions would have an impact on the performance of the algorithm (Fig 1). In this work, each model is depicted as a preprocessing model identifier (A–D), followed by the detection threshold (0, 5, 6, 7). FIG 1. Flowchart of the pipeline.A, Preprocessing is performed with 4 different models. The dataset is split into test, training, and validation sets. B, Inference is performed with the convolutional neural network DeepMedic with a 2-pathway architecture. The number of feature maps and their size is depicted as number⫻size. The⫹depicts the addition of the 2 preceding layers, which adds an additional nonlinearity and reduces the number of weights.18The diagram is based on the depiction in the DeepMedic documentation. (Modified from Kamnitsas K, Ledig C,
Newcombe VFJ, et al. Efficient multi-scale 3D CNN with fully connected CRF for accurate brain lesion segmentation.Medical Image Analysis 2017;36:61–78 under CC-BY4 license).32C, Thresholding is applied to the resulting segmentation and evaluated with different metrics. L
N
[image:3.594.54.530.45.299.2]Full preprocessing per case took about 5 minutes on a Corei7– 8700K CPU (Intel, Santa Clara, California). Individual creation of a skull-stripping mask was performed by an experienced user and took about 8 minutes for each sample.
Statistical analysis was performed using SPSS software, Ver-sion 25.0 (Released 2017; IBM Armonk, New York). We used the Shapiro-Wilk test to test for normality. Significance values of nor-mality tests are only reported for cases in which the nornor-mality assumption was violated. A Kruskal-Wallis test was used for the split-validation of maximum diameters.
Comparisons among the Models
We hypothesized the 4 different levels of preprocessing to each be improvements over the previous version. Therefore, sensitivity values of each preprocessing model were compared only with those of its closest neighbor by testing for differences in the proportions of hits and misses, using McNemar tests. These tests were chosen over 2 tests because the values obtained
from each model were not independent of one another. Com-paring each model with its closest neighbor yielded 3 compar-isons (A0 versus B0, B0 versus C0, C0 versus D0); thus, signif-icance levels were corrected for 3 comparisons using a Bonferroni correction.
False-positives per case (FPs/case) were compared for each preprocessing model using a Friedman test. Post hoc tests were run using Wilcoxon signed rank tests for each closest neighbor.
DSCs of each preprocessing model were compared using Friedman tests. Post hoc tests were run using Wilcoxon signed rank tests for each closest neighbor. Missing values, caused by the inability of the evaluation tool to analyze volumes with no seg-mented voxels, were set to zero.
Hausdorff distances of each preprocessing model were an-alyzed using a linear mixed model, which included a random subject factor, and “model” as the sole fixed dependent vari-able. This linear mixed model was chosen over a repeated-measures ANOVA because the linear mixed model can analyze missing values better; unlike DSCs, a Hausdorff distance of zero would not accurately describe the inability of the tool to analyze a volume with no segmented voxels.
Comparisons within the Models
We hypothesized that each of the postprocessing models reduces the number of false-positives sequentially. Thus, sensitivity values for each detection threshold were compared with those of the closest neighbor within each model by testing for a difference in the proportions of hits and misses using McNemar tests. This yielded 3 comparisons per preprocessing model (0 versus 5, five versus 6, and 6 versus 7).
FPs/case were compared for each detection threshold using a Friedman test. Post hoc tests were run using Wilcoxon signed rank tests comparing each closest neighbor.
Size and Location
Increased aneurysm size embodies an increased rupture risk.4 However, consented classifications of aneurysms based on an-eurysm size are missing. To study the impact of anan-eurysm size on the detection rate, we classified aneurysms on the basis of
maximum diameter as follows: In the literature, aneurysms with a maximum diameter ofⱕ3 mm are generally considered tiny.26For simplification, we termed these findings small an-eurysms. A distinct increased risk of rupture was identified for aneurysms with a diameter of⬎7 mm.6We therefore defined aneurysms of⬎3 butⱕ7 mm as medium, and those of⬎7 mm as large. Additionally, aneurysms were categorized on the basis of their location.
Sensitivity values of these categories were compared for both categorizations using Fisher exact tests rather than2tests
be-cause the cases numbered below 5 for certain cells. Spearman rank correlation coefficients were calculated between ground truth and predicted volumes because the normality assumption was vio-lated in all samples.
RESULTS
DatasetIn 85 patients (58 women, 68%; 23– 84 years of age; mean, 56⫾13 years), 115 untreated aneurysms with a mean volume of 214.6⫾ 480.9 mm3(range, 6.4 – 4518.0 mm3) and a mean maximum
diam-eter of 7.1⫾4.4 mm (range, 2.1–37.0 mm) were identified as the ground truth. Intrarater reliability for manual aneurysm segmenta-tion was excellent (r⫽0.998; 95% CI, 0.988 – 0.999;P⬍.0001). In the dataset, large-sized aneurysms accounted for 39%; medium-sized aneurysms, for 50%; and small-medium-sized aneurysms, for 11%.
The locational proportion of aneurysms was as follows: Forty-two percent of all aneurysms were located in internal carotid ar-teries; 17%, in the anterior cerebral arteries, including the anterior communicating artery; 23%, in the middle cerebral arteries; and 19%, in the posterior circulation, including the vertebral, basilar, posterior, cerebral, and posterior communicating arteries.
For cross-validation, the dataset was split into 5 subgroups in a randomized fashion. Normality was violated for the diameter dis-tributions in the splits (P⬍.001). The mean maximum diameter values of the splits did not differ significantly (2[4]⫽6.195,P⫽
.19). The mean maximum diameters of the 5 splits were 7.6⫾3.7 mm, 7.9⫾6.8 mm, 5.3⫾2.4 mm, 7.6⫾4.1 mm, and 7.0⫾3.1 mm, respectively.
Sensitivity among Models
Comparing sensitivity values of the nearest neighbors’ prepro-cessing models (A0, B0, C0, and D0) yielded no significant differ-ences (P⫽1, binomial distribution used for all comparisons). Even the models showing the largest difference (A0 versus D0) did not approach significance (P⫽.29, binomial distribution used, uncorrected for multiple comparisons).
False-Positives per Case among Models
Analyses of false-positive rates between the preprocessing models revealed a significant difference among models (2[3]⫽136.144,
P⬍.001). Pair-wise comparisons indicated a significant differ-ence between models A0 and B0 (z⫽7.425, P⬍.001), but not B0 and C0 or C0 and D0 (z⫽1.878,P⫽.18 andz⫽0.991,P⫽.97, respectively).
Sensitivity within Models
For model A, no significant changes in sensitivity were found between detection thresholds 0, 5, 6, and 7 mm3(P⫽1, binomial
distribution used for all comparisons). For model B, a significant decrease in sensitivity was found between thresholds B0 and B5 (P⫽.05, binomial distribution used). Sensitivity did not differ
between thresholds B5 and B6, or B6 and B7 (P ⫽ 1, binomial distribution used for both comparisons). For model C, a significant decrease in sensitivity was found between thresholds C0 and C5 (P ⬍ .001, binomial distribution used). Sensitivity did not differ between thresholds C5 and C6 or C6 and C7 (P⫽
1, binomial distribution used for both comparisons). For model D, a signifi-cant decrease in sensitivity was found between thresholds D0 and D5 (P ⬍ .001, binomial distribution used). Sensi-tivity did not differ between thresholds D5 and D6 or D6 and D7 (P⫽1, bino-mial distribution used for both compar-isons). A consecutive decrease in sensi-tivity ranged between 2% (version A) and 10% (version C).
False-Positives per Case within Models
Normality was violated for all models without thresholding applied (P⫽.008 for A0,P⬍.001 for all other models).
For model A, significant changes were found in the number of FPs/case among detection thresholds A0 and A5 (z⫽8.14,P⬍.001), A5 and A6 (z⫽
6.16,P⬍ .001), and A6 and A7 (z ⫽
5.12,P⬍.001). For model B, significant changes were found in the number of FPs/case among detection thresholds B0 and B5 (z⫽7.89,P⬍.001), B5 and B6 (z ⫽ 4.12, P ⬍.001), and B6 and B7 (z⫽3.46,P⫽.001). For model C, sig-nificant changes were found in the num-ber of FPs/case among detection thresh-olds C0 and C5 (z⫽7.62,P⬍.001), C5 and C6 (z⫽3.61,P⬍.001), and C6 and C7 (z⫽2.83,P⫽.005). For model D, significant changes were found in the number of FPs/case among detection thresholds D0 and D5 (z ⫽7.64,P⬍
.001), D5 and D6 (z⫽2.45,P⫽.01), and D6 and D7 (z⫽2.83,P⫽.005).
Impact of Aneurysm Size
To evaluate the impact of aneurysm size on sensitivity, we divided aneurysms into 3 categories based on maximum di-ameter, as described above. Detection sensitivity was found to be dependent on aneurysm size (test statistics are shown inTable 1).
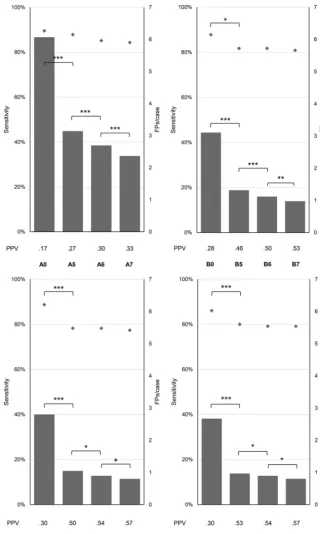
The Shapiro-Wilk test revealed that in all cases, normality as-sumption was violated by the ground truth volumes and/or the pre-dicted volumes of the models. The ground truth volume showed a negative correlation with the predicted volume of each preprocessing FIG 2. Impact of detection thresholds on sensitivity, the number of false-positives, and the
positive predictive value (PPV). Versions A, B, C, D without detection thresholds (A0, B0, C0, D0) and with thresholds of 5 mm3(A5, B5, C5, D5), 6 mm3(A6, B6, C6, D6), and 7 mm3(A7, B7, C7, D7).
[image:5.594.53.374.45.580.2]model for the group of small aneurysms. The highest correlation was found in preprocessing model A0 for large aneurysms. The correla-tion values for all aneurysm sizes combined were, in all models, sim-ilar to those of large aneurysms (Table 2).
Impact of Aneurysm Location
Sensitivity values among locations did not show a significant dif-ference (test statistics are shown inTable 3).
Accuracy of Segmentation: DSC and Hausdorff Distance
The distribution of DSCs violated normality for all models and thresholds (Pⱕ.001 for all models). DSCs differed significantly among preprocessing models A0, B0, C0, and D0 (2 [3] ⫽
50.228,P⬍.001). Pair-wise comparisons between nearest neigh-bors indicated that this difference originated from the difference between A0 and B0 (z⫽5.44,P⬍.001). DSCs did not differ among sessions B0, C0, and D0.
Hausdorff distances differed significantly among preprocess-ing models A0, B0, C0, and D0 (F[3, 255]⫽56.44,P⬍.001). Pair-wise comparisons between nearest neighbors indicated that this difference originated from the difference between A0 and B0 (P⬍.001). B0 and C0 did not differ significantly (P⫽.07), nor did C0 and D0 (P⫽.13).
DSC and Hausdorff distance values of the different prepro-cessing models are shown inTable 4. After we fine-tuned model A0, the DSC increased significantly from 0.47⫾0.28 to 0.50⫾ 0.30 (P ⬍ .001), and the Hausdorff distance changed from 90.16⫾22.25 to 85.6⫾22.69 (P⫽.004) without significant changes in sensitivity or the number of FPs/case.
Visual Inspection
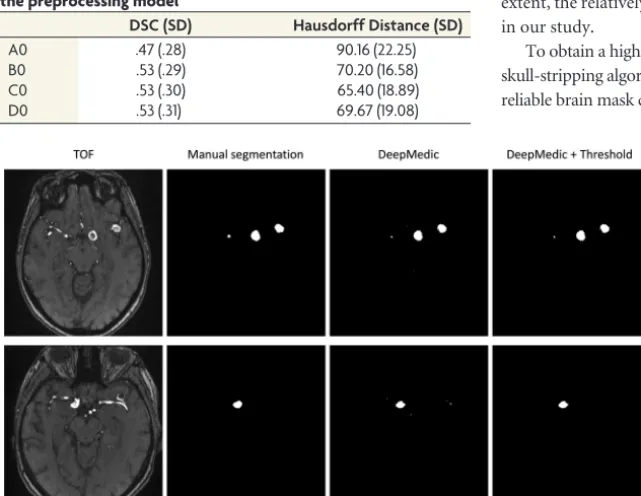
Two examples of our dataset are shown inFig 3. The model was able to detect aneurysms of small-to-large size, location, and regional in-tensity distribution in the 2 displayed volumes. By means of a post-processing step, false-positive components were removed.
DISCUSSION
Machine learning applications, in particular deep learning, have recently gained increased attention in the domain of medical im-aging. These types of algorithms, specifically CNNs, are top
per-formers in most medical-image analysis competitions. The ease of implementation of CNNs in processing pipelines13makes them accessible to a broad range of researchers. Machine learning is becoming a tool of growing importance in radiology and will probably change the way radiologists work.
In this study, we demonstrated the great potential of a CNN for reliable detection of intracranial aneurysms from 3D TOF-MRA. De-mand for radiologic imaging is constantly growing; therefore, the steadily increasing workload must be managed by radiology depart-ments.27Computer-aided detection tools may assist in preventing diagnostic errors that could occur due to a physician’s fatigue or lack of concentration. In a clinical setting, cranial imaging is performed for several diagnostic purposes. However, potentially relevant find-ings are often missed if a conspicuity corresponding to the primary diagnostic purpose of an examination is found.28This phenomenon termed “satisfaction of search” is frequently observed in radiologic practice and could potentially be reduced by sufficient computer-aided detection tools. To evaluate a realistic scenario, we included unspecified and therefore rather heterogeneous images (ie, different scanners, different field strengths) with varying image quality (signal-to-noise ratio, motion artifacts).
Solely in terms of overall sensitivity, the best model was A0, without application of skull-stripping or bias correction, with a sensitivity of 90%. However, this model also had a FPs/case value of 6.1, which is rather high. The highest positive predictive value of 0.57 was achieved with model D7, consisting of customized skull-stripping and N4 bias correction. A sensitivity of 79% was achieved with a FPs/case rate of 0.8⫾1.3. The amount of prepro-cessing had a significant impact on the rate of false-positives. In terms of sensitivity, no significant differences between prepro-cessing models were detected. Using a thresholding method that removes segmentation components below a distinct volume, we were able to further decrease the rate of false-positives.
Aneurysm size had a distinct impact on the performance of the CNN: For small aneurysms, a lower sensitivity value was mea-sured. These missed detections resulted in low correlation values between ground truth volumes and the model-predicted volumes for small aneurysm sizes. This correlation increased for medium-sized aneurysms, which were detected with a higher certainty but in some cases lacked segmentation precision. The correlation for large aneurysms and the overall correlation were high, the latter mainly due to a good segmentation capability for medium and large aneurysms. The DSC could be improved significantly by skull-stripping from 47%⫾28% to 53%⫾29%. The Hausdorff distance likewise improved from a value of 90⫾22 to 70⫾17.
Small aneurysms were underrepresented in the dataset; increas-ing this number would possibly improve the ability of the model to segment those aneurysms and predict their size better. A larger data-set would also decrease a possible overfitting of the model to the training data. We endeavored to address this issue using 5-fold cross-validation and flipping the image as a data aug-mentation concept.
The ground truth segmentation is sub-jective and may differ among radiologists. A similar study showed that intra- and in-teroperator variability of 20%⫾15% and 28%⫾12% was reported for the segmen-Table 1: Sensitivity depending on aneurysm size and
preprocessing model
≤3 mm (Small) (n= 13)
>3 and ≤7 mm (Medium)
(n= 57)
>7 mm (Large) (n= 45)
Fisher Exact Test Statistic
A0 .38 .93 1 29.00,P⬍.001
B0 .38 .91 .98 25.93,P⬍.001
C0 .23 .96 .98 38.43,P⬍.001
[image:6.594.53.284.553.629.2]D0 .08 .95 .98 49.89,P⬍.001
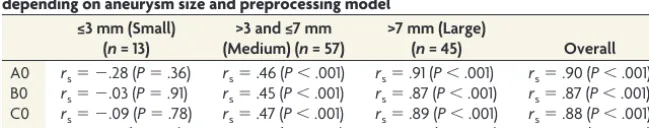
Table 2: Correlation between ground truth volume and model volume prediction depending on aneurysm size and preprocessing model
≤3 mm (Small) (n= 13)
>3 and ≤7 mm (Medium) (n= 57)
>7 mm (Large)
(n= 45) Overall
A0 rs⫽ ⫺.28 (P⫽.36) rs⫽.46 (P⬍.001) rs⫽.91 (P⬍.001) rs⫽.90 (P⬍.001)
B0 rs⫽ ⫺.03 (P⫽.91) rs⫽.45 (P⬍.001) rs⫽.87 (P⬍.001) rs⫽.87 (P⬍.001)
C0 rs⫽ ⫺.09 (P⫽.78) rs⫽.47 (P⬍.001) rs⫽.89 (P⬍.001) rs⫽.88 (P⬍.001)
D0 rs⫽ ⫺.31 (P⫽.31) rs⫽.43 (P⫽.001) rs⫽.89 (P⬍.001) rs⫽.88 (P⬍.001)
[image:6.594.53.378.660.724.2]tation of brain tumors.29We attempted to overcome this issue by evaluating our dataset through another radiologist.
Several approaches for automated detection of intracranial aneurysms from noninvasive cranial imaging have been reported previously.14,15,17However, most were limited by either the use of conventional computer-aided diagnosis algorithms or being ap-plicable only on 2D images. For instance, Miki et al14increased the number of detections of 2 radiologists using a computer-aided diagnosis tool for MRA images. Their system is based on different handcrafted features30and reached a sensitivity of 82% in source and reconstructed images of a 3T MR imaging device. Sˇtepa´n-Buksakowska et al15used a computer-aided diagnosis algorithm that applies global thresholding and region-growing schemes. They achieved a mean sensitivity of 83.6% by combining radiol-ogists’ examinations with their tool. Nakao et al17used a CNN for detecting aneurysms in 2D MIPs. Their tool detected aneurysms with a sensitivity of 94.2% with 2.9 FPs/case. However, their work is limited to 2D projections.
The main limitation of the presented algorithm is poor speci-ficity. We acknowledge that this issue currently limits clinical
util-ity. However, we demonstrated that an algorithm that was origi-nally developed for segmentation tasks is able to detect aneurysms reliably from noninvasive cranial imaging, and this requires only a very limited number of training samples. We observed that sev-eral, easily applicable postprocessing steps allow distinct reduc-tion of the number of false-positives. Because data augmentareduc-tion is already included, we assume that for further improvement of specificity, enlargement of the sample size would be necessary. Given the low number of untreated aneurysms in MRA, this would require a multi-institutional approach. Fine-tuning the network on a larger dataset with a modified training strategy for a more realistic distribution of classes might improve not only the DSC and Hausdorff distance but also sensitivity and specificity.
In this study, the performance of DeepMedic was validated in a clinical dataset, which was based on radiology reports. To fur-ther investigate whefur-ther our approach might contribute to an improvement of aneurysm detection in a clinical setting, the per-formance of DeepMedic should be compared with that of human readers. Another limitation is that the algorithm was trained solely on cases that had intracranial aneurysms. Because Deep-Medic works as a voxelwise classifier, this was done for methodo-logic reasons. The algorithm learns to differentiate between phys-iologic vessel anatomy and aneurysms by classifying each voxel within a volume as a positive (aneurysm) or negative (no aneu-rysm) prediction. Every dataset includes not only aneurysms but also physiologic vessels. Hence, every aneurysm-free voxel of a brain vessel could be considered a negative finding in a voxelwise classifier; therefore, one could argue that the algorithm can also learn to separate aneurysms from normal vessel anatomy using only pathologic cases. However, given the relatively low preva-lence of intracranial aneurysms in the general population, this approach might lead to overprediction, which explains, to some extent, the relatively high number of false-positive cases observed in our study.
To obtain a highly autonomous system, a robust and automated skull-stripping algorithm for TOF sequences is necessary to obtain a reliable brain mask comprising all relevant vessels without extracra-nial or nonbrain tissues. Most skull-strip-ping methods perform best with T1-weighted images and need to be adjusted manually for different acquisition se-quences.31Finally, in further research, it would be advantageous to compare the performance of DeepMedic in terms of aneurysm detection with that of other CNN architectures.
CONCLUSIONS
This study demonstrates that our CNN-based system can detect intracranial aneu-rysms with high sensitivity in a 3D TOF-MRA dataset. The dataset, comprising acquisitions of different field strengths and variable image quality, was created to eval-uate a scenario similar to clinical reality. Adequate pre- and postprocessing signifi-cantly reduced the number of false-posi-FIG 3. Results of the DeepMedic inference and thresholding method. Illustrated are 2 different
[image:7.594.54.285.319.384.2]subjects (top/bottom). In these volumes, aneurysms of different sizes with heterogenic and homogeneous intensity distributions are detected. After we remove small components below a certain volume, false-positives are removed sufficiently.
Table 3: Sensitivity of the different models depending on aneurysm location and preprocessing model
ICA (n= 48)
MCA (n = 26)
A (n= 19)
P (n= 22)
Fisher Exact Test Statistic
A0 .90 .92 .84 .91 .98,P⫽.86
B0 .88 .88 .79 .95 2.52,P⫽.48
C0 .85 .92 .84 .95 2.09,P⫽.59
D0 .83 .92 .79 .91 2.27,P⫽.53
[image:7.594.54.375.440.688.2]Note:—A indicates the anterior cerebral arteries (including the anterior communi-cating artery); P, posterior circulation (including vertebral, basilar, posterior, cerebral and posterior communicating arteries).
Table 4: Mean DSC and mean Hausdorff distance depending on the preprocessing model
DSC (SD) Hausdorff Distance (SD)
A0 .47 (.28) 90.16 (22.25)
B0 .53 (.29) 70.20 (16.58)
C0 .53 (.30) 65.40 (18.89)
tives. The predicted aneurysm volume correlated well with the ground truth volume for medium- and large-sized aneurysms; hence, the system could also serve as a tool to predict aneurysm size.
ACKNOWLEDGMENT
We thank Marguerite Mu¨ller for providing patient data to our dataset.
Disclosures: Anton Faron—UNRELATED:Employment: University Hospital Bonn Germany,Comments: employed as resident physician, Department of Radiology. Nikolas Teichert—UNRELATED:Employment: University Hospital of Aachen, Com-ments: work as a doctor in the Department of Diagnostic and Interventional Neuro-radiology. Martin Wiesmann—UNRELATED:Consultancy: Stryker Neurovascular;
Payment for Lectures Including Service on Speakers Bureaus: Bracco Imaging, Medtronic, Siemens, Stryker Neurovascular;Payment for Development of Educational Presentations: Abbott, ab medica, Acandis, Bayer Healthcare AG, Bracco Imaging, B. Braun Medical, Codman Neurovascular, Kaneka Pharma, Medtronic, Dahlhausen, Mi-croVention, Nvidia, Penumbra, phenox, Philips Healthcare, Route 92 medical, Siemens, Silk Road Medical, St. Jude, and Stryker Neurovascular*. Money paid to the institution.
REFERENCES
1. Vlak MH, Algra A, Brandenburg R, et al.Prevalence of unruptured intracranial aneurysms, with emphasis on sex, age, comorbidity, country, and time period: a systematic review and meta-analysis.
Lancet Neurol2011;10:626 –36CrossRef Medline
2. Kapsalaki EZ, Rountas CD, Fountas KN.The role of 3 Tesla MRA in the detection of intracranial aneurysms.Int J Vasc Med2012;2012: 792834CrossRef Medline
3. Nieuwkamp DJ, Setz LE, Algra A, et al.Changes in case fatality of aneurysmal subarachnoid haemorrhage over time, according to age, sex, and region: a meta-analysis.Lancet Neurol2009;8:635– 42
CrossRef Medline
4. Lindgren AE, Koivisto T, Bjo¨rkman J, et al.Irregular shape of intra-cranial aneurysm indicates rupture risk irrespective of size in a population-based cohort.Stroke2016;47:1219 –26CrossRef Medline
5. Thompson BG, Brown RD Jr, Amin-Hanjani S, et al; American Heart Association Stroke Council, Council on Cardiovascular and Stroke Nursing, and Council on Epidemiology and Prevention; American Heart Association; American Stroke Association.Guidelines for the management of patients with unruptured intracranial aneurysms: a guideline for healthcare professionals from the American Heart Association/American Stroke Association. Stroke 2015;46:2368 – 400CrossRef Medline
6. Wiebers DO, Whisnant JP, Huston J 3rd, et al; International Study of Unruptured Intracranial Aneurysms Investigators.Unruptured in-tracranial aneurysms: natural history, clinical outcome, and risks of surgical and endovascular treatment.Lancet2003;362:103–10
CrossRef Medline
7. Leffers AM, Wagner A.Neurologic complications of cerebral angiography: a retrospective study of complication rate and pa-tient risk factors.Acta Radiol2000;41:204 –10Medline
8. Wang S, Summers RM.Machine learning and radiology.Med Image Anal2012;16:933–51CrossRef Medline
9. McDonald RJ, Schwartz KM, Eckel LJ, et al.The effects of changes in utilization and technological advancements of cross-sectional imag-ing on radiologist workload.Acad Radiol2015;22:1191–98CrossRef Medline
10. Erickson BJ, Korfiatis P, Akkus Z, et al.Toolkits and libraries for deep learning.J Digit Imaging2017;30:400 – 05CrossRef Medline
11. Larson DB, Chen MC, Lungren MP, et al.Performance of a deep learn-ing neural network model in assesslearn-ing skeletal maturity on pediatric hand radiographs.Radiology 2018;287:313–322CrossRef Medline
12. Krizhevsky A, Sutskever I, Hinton GE.ImageNet classification with deep convolutional neural networks. Adv Neural Inf Process Syst
2012:1–9 https://papers.nips.cc/paper/4824-imagenet-classification-with-deep-convolutional-neural-networks.pdf. Accessed March 20, 2018
13. Litjens G, Kooi T, Bejnordi BE, et al.A survey on deep learning in medical image analysis.Med Image Anal2017;42:60 – 88CrossRef Medline
14. Miki S, Hayashi N, Masutani Y, et al.Computer-assisted detection of cerebral aneurysms in MR angiography in a routine image-reading environment: effects on diagnosis by radiologists.AJNR Am J
Neu-roradiol2016;37:1038 – 43CrossRef Medline
15. Sˇtepa´n-Buksakowska IL, Accurso JM, Diehn FE, et al. Computer-aided diagnosis improves detection of small intracranial aneu-rysms on MRA in a clinical setting.AJNR Am J Neuroradiol2014;35: 1897–902CrossRef Medline
16. Yang X, Blezek DJ, Cheng LT, et al.Computer-aided detection of intracranial aneurysms in MR angiography.J Digit Imaging2011;24: 86 –95CrossRef Medline
17. Nakao T, Hanaoka S, Nomura Y, et al.Deep neural network-based computer-assisted detection of cerebral aneurysms in MR angiog-raphy.J Magn Reson Imaging2018;47:948 –53CrossRef Medline
18. Kamnitsas K, Ledig C, Newcombe VF, et al.Efficient multi-scale 3D CNN with fully connected CRF for accurate brain lesion segmenta-tion.Med Image Anal2017;36:61–78CrossRef Medline
19. Kamnitsas K. GitHub-Kamnitsask/deepmedic. Efficient Multi-Scale 3D Convolutional Neural Network for Brain Lesion Segmen-tation. Published 2017. https://github.com/Kamnitsask/deepmedic. Accessed March 20, 2018
20. Jenkinson M, Pechaud M, Smith S.BET2: MR-based estimation of brain, skull and scalp surfaces.In:Eleventh Annual Meeting of the
Organization for Human Brain Mapping, Toronto, Ontario, Canada,
June 12–16, 2005
21. Tustison NJ, Avants BB, Cook PA, et al.N4ITK: improved N3 bias correction. IEEE Trans Med Imaging 2010;29:1310 –20 CrossRef Medline
22. Yushkevich PA, Piven J, Hazlett HC, et al.User-guided 3D active contour segmentation of anatomical structures: significantly im-proved efficiency and reliability. Neuroimage 2006;31:1116 –28
CrossRef Medline
23. Kamnitsas K, Chen LC, Ledig C, et al. Ischemic stroke lesion segmenta-tion.In:Proceedings of MICCAI-ISLES, Munich, Germany. October 5, 2015. 2015:13–16. www.isles-challenge.org. Accessed March 19, 2018 24. Taha AA, Hanbury A.Metrics for evaluating 3D medical image
segmentation: analysis, selection, and tool.BMC Med Imaging2015; 15:29CrossRef Medline
25. Tustison NJ, Avants BB, Cook PA, et al.N4ITK: improved N3 bias cor-rection.IEEE Trans Med Imaging2010;29:1310 –20CrossRef Medline
26. Li M, Zhu Y, Song H, et al.Subarachnoid hemorrhage in patients with good clinical grade: accuracy of 3.0-T MR angiography for detection and characterization.Radiology2017;284:191–99CrossRef Medline
27. MacDonald SL, Cowan IA, Floyd R, et al.Measuring and managing radiologist workload: application of lean and constraint theories and production planning principles to planning radiology services in a major tertiary hospital.J Med Imaging Radiat Oncol2013;57: 544 –50CrossRef Medline
28. Berbaum KS, Franken EA Jr, Dorfman DD, et al.Satisfaction of search in diagnostic radiology.Invest Radiol1990;25:133– 40CrossRef Medline
29. Mazzara GP, Velthuizen RP, Pearlman JL, et al.Brain tumor target volume determination for radiation treatment planning through automated MRI segmentation.Int J Radiat Oncol Biol Phys2004;59: 300 –12CrossRef Medline
30. Nomura Y, Masutani Y, Miki S, et al.Performance improvement in computerized detection of cerebral aneurysms by retraining classi-fier using feedback data collected in routine reading environment.
J Biomed Graph Comput2014;4:12–21CrossRef
31. Kalavathi P, Prasath VB.Methods on skull stripping of MRI head scan images: a review.J Digit Imaging2016;29:365–79CrossRef Medline