ISSN Online: 2153-0378 ISSN Print: 2153-036X
DOI: 10.4236/jbpc.2018.91001 Jan. 18, 2018 1 Journal of Biophysical Chemistry
Gradient Temperature Raman Spectroscopy of
Fatty Acids with One to Six Double Bonds
Identifies Specific Carbons and Provides
Systematic Three Dimensional Structures
C. Leigh Broadhurst
1,2*, Walter F. Schmidt
1, Julie K. Nguyen
1, Jianwei Qin
1, Kuanglin Chao
1,
Moon S. Kim
11Environmental Microbiology and Food Safety Laboratory, US Department of Agriculture Agricultural Research Service, Beltsville, MD, USA
2Department of Mechanical Engineering, University of Maryland Baltimore County, Baltimore, MD, USA
Abstract
Specialized pro-resolving mediators provide promising targets for new drugs and natural products. Much work has been accomplished on the structure/ function of the lipoxygenase and cyclooxygenase enzymes but not on the sub-strates. A better visualization of three-dimensional lipid structures will allow increased refinement of the interactions that produce the pro-resolving me-diators, and lead to improvements in synthetic pathways. We present syste-matic analysis of oleic (18:1n-9), linoleic (18:2n-6), alpha-linolenic (18:3n-3), arachidonic (20:4n-6), docosapentaenoic (22:5n-3), and docosahexaenoic (22:6n-3) acids. Continuous gradient temperature Raman spectroscopy (GTRS) applies the temperature gradients utilized in differential scanning calorimetry to Ra-man spectroscopy. GTRS can identify and differentiate specific carbon chain sites, finally allowing Raman analysis to explain why the long-chain polyun-saturated fatty acids (LC-PUFA) exhibit such extreme functional differences despite minimal changes in chemical structure. Detailed vibrational analysis
of the important frequency ranges 1450 - 1200 cm−1 (includes CH
2 bending and
twisting) and 1750 - 1425 cm−1 (includes C=C stretching and C-C stretching
plus H-C in-plane rocking) shows for the first time that each molecule has its own characteristic set of modes with only some redundancy/commonality. The number and frequency of modes correlates with three-dimensional mo-lecular structure, not the degree of unsaturation. The high degree of specificity of lipoxygenase and cyclooxygenase enzymes should be reconsidered in light of the fact that individual sites on the polyunsaturated fatty acid chain are
How to cite this paper: Broadhurst, C.L., Schmidt, W.F., Nguyen, J.K., Qin, J.W., Chao, K.L. and Kim, M.S. (2018) Gradient Temperature Raman Spectroscopy of Fatty Acids with One to Six Double Bonds Iden-tifies Specific Carbons and Provides Syste-matic Three Dimensional Structures. Journal of Biophysical Chemistry, 9, 1-14.
https://doi.org/10.4236/jbpc.2018.91001
Received: October 24, 2017 Accepted: January 15, 2018 Published: January 18, 2018
Copyright © 2018 by authors and Scientific Research Publishing Inc. This work is licensed under the Creative Commons Attribution International License (CC BY 4.0).
DOI: 10.4236/jbpc.2018.91001 2 Journal of Biophysical Chemistry
nonequivalent, and each LC-PUFA molecule has an individual, specific three dimensional structure incorporating torsion.
Keywords
Gradient Temperature Raman Spectroscopy, Raman Spectroscopy, Arachidonic Acid, Docosapentaenoic Acid, Docosahexaenoic Acid, Alpha-Linolenic Acid, N-3DPA, DHA, GTRS
1. Introduction
Continuous gradient temperature Raman spectroscopy (GTRS) has proven to be a simple, rapid technique for determining the unique structures of the
unsatu-rated fatty acids [1][2][3][4]. While conventional Raman analysis can be
use-ful, to first order the long-chain polyunsaturated fatty acids (LC-PUFA) appear nearly identical, with the vibrational modes of most moieties degenerate,
redun-dant or very broad [5][6][7] [8][9]. But logically this cannot be the case,
be-cause the LC-PUFA are so vastly different biochemically. Collecting spectra in a temperature gradient provides information not readily available in constant tem-perature measurements, because the dynamic nature of the vibrational structure can be observed in real time as the molecule changes conformation. Thus, GTRS can identify and differentiate specific carbon chain sites, finally allowing Raman analysis to explain why the LC-PUFA exhibit such extreme functional differenc-es. Recently we applied GTRS to oleic acid (OA, 18:1n-9), linoleic acid (LA, 18:2n-6), arachidonic acid (AA, 20:4n-6), N-3 docosapentaenoic acid (N-3DPA, 22:5n-3), N-6 docosapentaenoic acid (N-6DPA, 22:5n-6), docosahexaenoic acid (DHA, 22:6n-3), and AA and DHA stearic acid phosphatidylcholines, resulting in complete vibrational assignments and new three dimensional (3D) structures
for each molecule [1][2][3][4]. Readers are referred to these published texts for
the full datasets, contour plots and vibrational mode assignments for each of these molecules.
The importance of the LC-PUFA to biological and pharmaceutical sciences can-not be overstated. In particular, the emerging field of specialized pro-resolving mediators provides promising and exciting targets for new anti-inflammatory,
neuroprotective and anti-infective drugs and natural products [9][10][11][12]
[13]. Specialized pro-resolving mediators are highly interesting in that
metabo-lites of not just DHA and EPA, but also n-3DPA and n-6DPA can actively resolve inflammation at very low concentrations, proving new insight into the numerous health benefits epidemiologically associated with diets high in fish and/or total
LC-PUFA [14][15][16][17].
All five of the PUFA we present are metabolized by cyclooxygenase and
li-poxygenase enzymes into an extensive suite of oxylipin metabolites [18]-[24].
DOI: 10.4236/jbpc.2018.91001 3 Journal of Biophysical Chemistry
the various enzymes, it remains largely empirical: there is no systematic
explana-tion as to why conversion rates vary at least 10-fold among PUFA species [23].
One reason for this is that the structure of substrates has been taken for granted beyond the obvious distinction of n-6 vs. n-3. We believe that a better under-standing and visualization of the 3D lipid structures will allow increased refine-ment of the substrate and enzyme interactions that produce the pro-resolving mediators, and lead to improvements in synthetic pathways. Herein we present a detailed, comprehensive vibrational analysis of six fatty acids with 1, 2, 3, 4, 5, and 6 double bonds (OA, LA, alpha-linolenic acid (ALA, 18:3n-3), AA, N-3DPA, and DHA. With the improved GTRS spectroscopic technique, second derivatives can be utilized to resolve and identify vibrational modes which previously were not completely assigned. We show that individual sites on the LC-PUFA chain are nonequivalent although they are technically identical moieties.
2. Materials and Methods
The GTRS system utilizes a 785-nm laser module (I0785MM0350MF-NL, Inno-vative Photonic Solutions, Monmouth Junction, NJ) as the excitation source. A fiber optic Raman probe (RPB, InPhotonics, Norwood, MA) is used to focus the laser and acquire the Raman signals. A bifurcated fiber bundle with a 16-bit CCD camera (1024 × 256 pixels; Newton DU920N-BR-DD, Andor Technology, South Windsor, CT) delivers the laser radiation to the probe and transmits the Raman signals to the spectrometer at 0.2˚C increments. The spectrometer
de-tects a Raman shift range of 102.2 to 2538.1 cm−1 with a minimum spectral
reso-lution of 3.7 cm−1.
OA (cis-9 octadecenoic acid), LA (cis-9, 12 octadecadienoic acid), ALA cis-9,
12, 15 octadecatrienoic acid), AA (cis-5, 8, 11, 14 eicosatetraenoic acid) and
DHA (cis-4, 7, 10, 13, 16, 19 docosahexaenoic acid) > 99% purity were
pur-chased from Sigma Chemical Co., St. Louis, MO. N-3DPA (cis-7, 10, 13, 16, 19
docosapentaenoic acid) 98% purity was purchased from Santa Cruz Biotechnol-ogy Inc., Dallas, TX. Materials were stored sealed in a freezer until immediately prior to use. Samples were placed in aluminum pans which were then placed on large copper heat sinks with a sample platform on the upper surface. The heat
sink and sample holder are chilled in a LN2 bath, but the sample itself does not
come in direct contact with LN2 or atmospheric water vapor condensate. A
ce-ramic hotplate is used for controlled heating of samples and as stable insulating platform for analysis. The copper heat sinks are placed directly on the ceramic heat surface and serve to buffer the rate of temperature increase. Two K-type thermocouple probes (range −200˚C to 1350˚C) are attached to two sides of the sample area and connected to a dual-input thermometer (Easy View EA15, Ex-tech Instruments, Nashua, NH). The sample temperature is defined as the aver-age value of the two probes. The thermocouple calibration based on test
resis-tance provided by the manufacturer was utilized as well as calibration in LN2.
DOI: 10.4236/jbpc.2018.91001 4 Journal of Biophysical Chemistry
box to avoid ambient light. Raman spectra can be acquired from −180˚C to 320˚C.
The heating gradient was approximately 1˚C∙min−1 for these mainly cryogenic
in-vestigations. We did not use a set time schedule for spectral acquisition, but rather acquired spectra each time the sample temperature increased either 1˚C or 0.2˚C, depending on the analysis. System software was developed using Lab VIEW (Na-tional Instruments, Austin, TX) to fulfil functions such as camera control, data acquisition, temperature measurement, signal/noise threshold and
synchroniza-tion [25]. All Raman samples were run in triplicate and each dataset analyzed
in-dependently to ensure reproducibility.
Sigma Plot 13 (Systat Software, Inc.) generated three-dimensional contour plots (frequency, temperature, signal intensity). Software counting statistics ensure that only data with 99% certainty of true signal are utilized. First derivative intensity
contour plots were calculated using a three-point running average, i.e. the first
and last points calculate the slope of the middle point. The contour plots for the second derivative intensity were calculated using the three-point running aver-age data from the first derivative spectra. Relative intensity is normalized to C=C
stretch region circa 1650 cm−1. Maximum to minimum intensity colors are red >
orange > yellow > green > blue > black. Each contour data array contains about 20 Mb.
3. Results
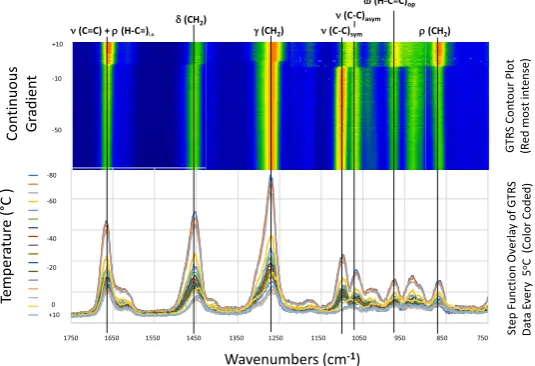
GTRS collects Raman spectra continuously in an applied thermal gradient without the discontinuity in temperature intrinsic in steady state experiments. In the gradient, the contour plot signal is greatest for molecular sites which are the
most elastic and respond most quickly to thermal stress. Figure 1 shows an
ex-ample (ALA) of how the contour plot data are generated for each molecule. Each
contour plot contains hundreds of measurements. Figure 2 shows details of the
Figure 1. Composite overlay line spectra for ALA detailing how stacked spectra are
transformed to generate contour plots. Selected temperatures are shown for clarity. The discontinuity circa −3˚C represents melting.
750 850 950 1050 1150 1250 1350 1450 1550 1650 1750 -79.9 -75.1 -70.2 -60 -55 -50 -45 -40 -35 -29.9 -20 -15.1 -9.9 -5 0 5 10
δ(CH2)
γ(CH2) ν(C-C)sym
ν(C-C)asym
ω(H-C=C)op
ρ(CH2)
ν(C=C) + ρ (H-C=)i.p.
-80 -60 -40 -20 0 +10
Wavenumbers (cm-1) +10
-10
-50
1750 1650 1550 1450 1350 1250 1150 1050 950 850 750
Te mp er at ur e ( °C ) St ep F unct io n Ov er la y o f G TR S Da ta E ve ry 5
oC (C
[image:4.595.242.510.496.679.2]DOI: 10.4236/jbpc.2018.91001 5 Journal of Biophysical Chemistry
(a)
[image:5.595.264.489.64.689.2](b)
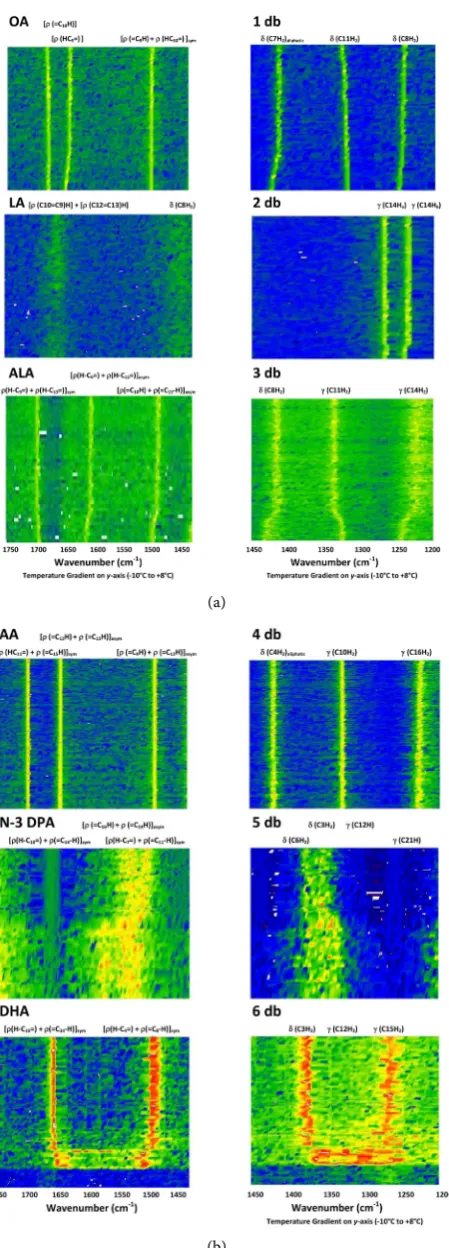
Figure 2. Details of the second derivative data contour plots for the six fatty acids from
DOI: 10.4236/jbpc.2018.91001 6 Journal of Biophysical Chemistry
second derivative data contour plots for the six fatty acids. In two ranges given all six would be expected to have nearly identical vibrational spectra under steady-state conditions, but with the refined spectroscopy of GTRS this is clearly not the case. The temperature ranges are chosen to provide a clear compari-son of the six lipids—not all ranges can accommodate the huge variation in melting temperatures that exists—but vibrational modes are not restricted to this range.
The frequency range 1450 to 1200 cm−1 includes CH
2 bending and twisting;
the range 1750 to 1425 cm−1 includes the C=C-C moiety: C=C stretching and
C-C stretching plus H-C in-plane rocking. The ranges include 1450 cm−1 to 1425
cm−1 twice to show the vibrational modes that occur close to 1425 cm−1.
Struc-tures of the double bond regions and frequency assignments for their carbon
sites are given in Figure 3.
(a)
(b)
C8H2 C11H2
CH2bending at C7 1410 cm-1
CH2 twisting at C11 1321 cm-1
CH2 twisting at C8 site 1243 cm-1
OA 1db
CH2 twisting at C2-C6 not detected
CH2 twisting at C12-17 not detected
C-C stretching + H-C rocking i.p.
= [1678 cm-1]
= [1639 cm-1]
= [1490 cm-1] asym
Carbonyl (C1) chain ended Methyl (C18) chain ended
C8H2
C11H2
C14H21
Methyl (C18) chain ended
CH2bending at C8 1448 cm-1
CH2 twisting at C15-C17 not detected Carbonyl (C1) chain ended
LA 2db
CH2 twisting at C14 1265 cm-1
C-C stretching + H-C rocking i.p.
= [1655 cm-1] sym
CH2 bending at C2-C7 not detected
CH2 twisting at C11 not detected
C8 C11
C14
C17
CH2bending at C8 1410 cm-1
CH2 twisting at C11 1321 cm-1
CH2 twisting at C14 1243 cm-1
CH2 twisting at C17 1223 cm-1
ALA 3db
CH2 twisting at C2-7
not detected C-C stretching + H-C rocking i.p.
= [1695 cm-1]asym
= [1601 cm-1] sym
= [1485 cm-1] asym
Carbonyl (C1) chain ended Methyl (C18) chain ended
CH2 twisting at C16 1226 cm-1
CH2 twisting at C10 1327 cm-1
CH2bending at C7 1418 cm-1in AA
C10
C13
AA 4db
C-C stretching + H-C rocking i.p.
= [1696 cm-1] asym
= [1651 cm-1] sym
= [1484 cm-1]asym
CH2 twisting at C2-C3 not detected
DOI: 10.4236/jbpc.2018.91001 7 Journal of Biophysical Chemistry
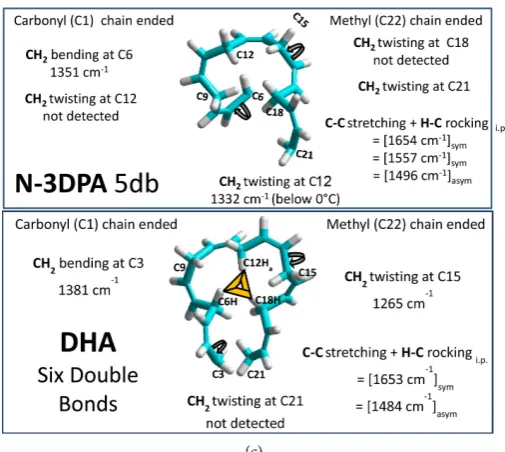
Figure 3. Structures of the double bond regions and frequency assignments for their
car-bon sites. (a) OA, LA; (b) ALA, AA; (c) n-3DPA, DHA.
The 1489 ± 5 cm−1 frequency is observed in all the lipids analyzed except LA
and is the most important in understanding PUFA lipid conformations. This
es-sential vibrational mode can be generated from OA data: (1658 cm−1 + 1321
cm−1)/2 = 1490 cm−1. The 1650 ± 7 cm−1 frequency, assignable to the (H-C=
C-H)-CH moiety in which all atoms are co-planar, is observed in all the lipids
presented except ALA. The Raman frequency 1690 ± 10 cm−1 is observed in only
half the lipids: AA, ALA and OA. The average of the two C-C and C=C
stret-ching modes in OA [(1678 cm−1 + 1639 cm−1/2 = 1658 cm−1)] is similar to the
1655 cm−1 mode in LA.
Despite having a different number of double bonds, OA, ALA and AA do have three critical vibrational modes in common: 1486 ± 3, 1413 ± 5, and 1323 ±
4 cm−1. The assignments are three H-C in-plane rocking on the C=C-C moiety;
CH2 bending on the Ca end of the CaH2-(H-C=C-H)-CbH2 moiety, and CH2
twisting at the Cb end of this same moiety. A difference is that ALA has two
oth-er CH2 twisting frequencies (1243 and 1223 cm−1) whereas OA has only the one
(1223 cm−1) and AA has only the other (1243 cm−1). An unusual assignment in
ALA is 1601 cm−1, which corresponds to a difference of two H-C in-plane
rock-ing frequencies, whereas 1695 cm−1 equals a difference of four.
The CH2 bending assignment in OA at C8 (1408 cm−1) is similar to the C8
as-signment in ALA (1413 cm−1). Twisting at C8 in OA and C14 in ALA occurs at
the same frequency. This shifts the CH2 bending assignment from C8 in ALA to
C7 in OA; both are at 1410 cm−1.
LA has four discrete vibrational modes arising from two double bonds and
three CH2 sites adjacent to C=C sites. C8H2 bending occurs at 1448 cm−1 and is
DOI: 10.4236/jbpc.2018.91001 8 Journal of Biophysical Chemistry
The bending torsion from the six other CH2 groups on the carbonyl ended
ali-phatic chain (C2-C7) is minimal. Since C11H2 twisting near 1327 cm−1 is not
observed, torsion from adjacent CH2 groups in the H-C9=C10-H moiety is
mi-nimal. Torsion due to the C14H2 site results in the twisting modes at 1266 and
1237 cm−1. In the first case, H
a-C twisting is relative to the C14-C13=C12 plane.
In the second case, Hb-C twisting is relative to the C14-C13=C12 plane. The
ali-phatic C14-C15-C16-C17-C18 moiety can be twisted to the right or twisted to the left relative to the planar C9=C10-C11-C12=C13 moiety. No net twist from
CH2 sites adjacent to either the C12=C13 or the C9=C10 moiety was found; LA
in this temperature range is flat.
AA has the identical structural moieties as LA but twice the number of double
bonds with five CH2 sites adjacent to C=C sites. Unexpectedly, six (not three)
vi-brational modes are detected. The three that are not observed in the LA data can be assigned to a conformational change at C10. The relative broadness of the LA contour plots reflects a more diffusely distributed elasticity over non-localized molecular conformations. In contrast, the sharp peaks at C4, C10, and C16 in
AA are that evidence elasticity is localized at these three sites: i.e. at the
begin-ning, middle and end of the repeating five carbon atom moieties.
In AA, the three frequencies (1651, 1489, and 1327 cm−1) are not independent
variables. The middle one is the average of the other two [(1651 cm−1 + 1327
cm−1)/2 = 1489 cm−1]. The difference between the first two results in a constant
[(1651 cm−1 − 1487 cm−1) = 164 cm−1]. From the three CH
2 between the double
bonds, three in plane H-C rocking modes can occur with a frequency shift of 55
cm−1 per each H-C in-plane rocking site between the double bonds. H-C in plane
rocking vibrational modes, depending upon how they add or subtract in rela-tionship to each other, can correspondingly increase or decrease C=C and C-C stretching.
For DHA, twisting towards the methyl-ended chain (1266 cm−1) occurs at site
C14, at the same frequency as C14Ha in LA. DHA with six double bonds has two
CH2 twisting/bending modes whereas AA with four double bonds has three. In
AA, these are assignable to CH2 sites adjacent to the beginning (C4), end (C16)
and middle (C10) of the double bond region. In DHA, the beginning site (C3) is
shifted about 50 cm−1 lower that the corresponding site in AA (C4). The second
site (C14) is shifted about 25 cm−1 higher than from that in AA (C16). A
vibra-tional mode at C12H2 in DHA would be near its center of mass. C14H2 is
how-ever three carbon atoms past its center of mass.
Four double bonds equal one loop from C6 to C18; the geometry of a self- consistent twist in the same relative direction from C6 to C18 (with no twist at
C12) would result in such a loop forming [3]. For DHA (labeling each pattern
Ca=Cb), all Ca= sites could be 1653 cm−1 and all =Cb sites could be 1484 cm−1.
This would explain why for DHA, only two vibrational modes in this spectral region (neither three nor one) are observed.
DOI: 10.4236/jbpc.2018.91001 9 Journal of Biophysical Chemistry
in N-3 DPA and in ALA are at C6 (1360 cm−1) and at C8 (1420 cm−1); twisting
modes adjacent to the last double bonds are at C21 (1208 cm−1) and C14 (1225
cm−1). Further, N-3DPA and DHA both include similar CH
2 bending modes at
C3 (1380 cm−1 versus 1375 cm−1) despite the fact that in DHA, the C4=C5 double
bond is present. N-3DPA is unique among the six: it is the only one that has
vi-brational modes in the region 1575 and 1500 cm−1 but no vibrational mode near
1250 cm−1.
4. Discussion
The C-CH2-C=C-CH2-C moiety occurs in all six of these lipids, once in OA, but
six times in DHA. Over all six lipids this moiety is repeated 21 times, and the question is which of these are actually identical structurally? The Fisher
projec-tions (Figure 4) at these moieties explain the critical larger 3D structure present
in OA and the LC-PUFA.
(a)
DOI: 10.4236/jbpc.2018.91001 10 Journal of Biophysical Chemistry
(c)
(d)
[image:10.595.239.509.73.690.2](e)
Figure 4. Fischer projections of the double bond regions. (a) OA, LA; (b) ALA; (c) AA;
DOI: 10.4236/jbpc.2018.91001 11 Journal of Biophysical Chemistry
The backbone geometry in LC-PUFA structures C8-C9=C10-C11-C12=C13- C14 is a non-repeating moiety because C11 does not repeat twice. The critical structural question of such lipids is redundancy versus symmetry. Symmetry in reference to a molecular site means a conformation and its mirror images are identical. For lipids with an even number of double bonds, the CH2 group in the middle of them is reference site. For those with an odd number of double bonds, the middle of the C=C bond is the reference site. Overall symmetry means that C8-C9=C10-C11 is indistinguishable from C11-C12=C13-C14 or C8-C9= C11- C12.
Redundancy arises from the same structural moiety having identical proper-ties regardless of symmetry. C8-C9=C10 and C11-C12=C13 would be the same and C9=C10-C11 and C12=C13-C14 would be the same; but C8-C9=C10 and C9=C10-C11 (or C11-C12=C13 and C12=C13-C14) need not be.
In LA with two double bonds (C9=C10 and C12=C13), only four spectral lines are observed. All frequencies containing the C-C= and =C-C moiety overlap
(1655 cm−1). C8H
2 bending before C9= is a single vibrational mode whereas C14
torsion after =C13 has two modes. The CH2 structure at the carbonyl end of LA
is symmetrical; the C14 sites towards the methyl end of the lipid are not equally elastic. The eclipsed conformation of the Fisher projection indicates that C8 to C13 are coplanar and C14 twisting above this plane is unequal to C14 twisting below the plane.
In AA with four double bonds (C5=C6, C8=C9, C11=C12, and C14=C15),
only six vibrational modes are observed. Despite five CH2 sites adjacent to a
C=C, only three CH2 bending/twisting modes are detected and symmetrical
about C10: C4H2 before C5, C16H2 after C15 and C10H2. The three spectral lines
cannot be divided symmetrically among four sets of two double bonds. The Fisher projection resolves this dilemma: the sequence C5=C6-C7-C8 is not
pla-nar; C7-C8=C9-C10 is plapla-nar; the sequence C9-C10=C11-C12 is not planar and
is in a conformation different than the first one. Moreover, C6 to C11 is the same conformation as C9 to C14, and the conformations C3 to C8 and C12 to
C17 are similar. Thus, AA is symmetrical about C12H2 and clearly not
symme-trical about either C8=C9 or C11=C12.
In DHA with six double bonds (C4=C5, C7=C8, C10=C11, C13=C14, C16=C17, and C19=C20), the four vibrational modes observed can only occur because of
redundancy. The absence (above −6˚C) of a C12H2 twisting mode precludes the
symmetry observed in AA. In the DHA Fisher projection, the identical gauche
(left) cis conformations occurs in three locations (C2 to C7, C11 to C16, and C17
to C22) whereas the other three (C5 to C10, C8 to C13, and C14 to C19) occur as
trans conformations. The co-addition curvature at three structurally equivalent
cis double bond sites plus the symmetrical trans conformation at the remaining
three double bond sites results in a planar “C” shaped molecular structure com-posed from redundancy in two forms of the C=C-C moieties. The Fisher
projec-tions for the gauche (right) cis double bonds in AA are also not identical to the
DOI: 10.4236/jbpc.2018.91001 12 Journal of Biophysical Chemistry
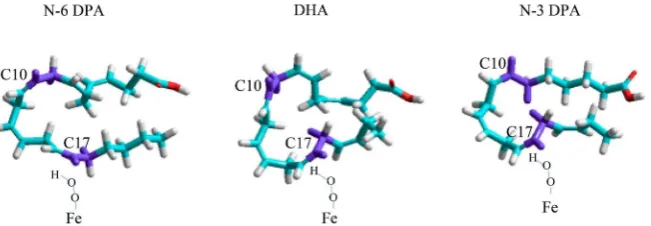
Figure 5. Comparison of energy minimized 3D structures for n-3DPA, n-6DPA and DHA
based on [1][2][3]. The position of Fe-O-O-H within the C17 oxidation site can be as-sumed constant, however the Fe-O-O-H site could equally be towards the inside of the C17 site as towards the outside of the lipid chain. N-6DPA has the cleanest fit at C17 of the three lipids (see purple area). Since n-6DPA has no C19=C20 bond, torsion is due only to previous double bond sites—especially C13=C14. For the C18H2 site, the hydro-gen inside the U-shape of the lipid (purple) is in a spatially very different conformation as the hydrogen on the outside (white).
Previously we noted that biochemical energy is more than sufficient to not
only recognize, but actually induce nonequivalence among CH and CH2 groups
[4]. Our improved lipid spectroscopy and 3D structures likely have bearing on
the enzymatic oxidation processes which form specialized pro-resolving media-tors. For example, at 0˚C soybean 15-lipoxygenase oxidizes C17 to its hydrope-roxy derivative with 100% efficiency for n-6 DPA, 85% for n-3DPA and 50% for DHA [9]. Figure 5 gives a view of these LC-PUFA in the critical area. While full analysis is beyond the scope of this spectroscopic contribution, we hope that this visualization will promote further understanding of the enzymatics involved. The
high degree of specificity of lipoxygenase and cyclooxygenase enzymes [18]-[24]
should be reevaluated in light of the fact individual sites on the polyunsaturated fatty acid chain are nonequivalent, and each LC-PUFA molecule has an individ-ual, specific structure incorporating torsion.
References
[1] Broadhurst, C.L., Schmidt, W.F., Kim, M.S., Nguyen, J.K., Qin, J., Chao, K., Bau-chan, G.L. and Shelton, D.R. (2016) Continuous Gradient Temperature Raman Spectroscopy of N-6DPA and DHA from −100 to 20˚C. Chemistry and Physics of
Lipids, 200, 1-10. https://doi.org/10.1016/j.chemphyslip.2016.06.003
[2] Broadhurst, C.L., Schmidt, W.F., Kim, M.S., Nguyen, J.K., Qin, J., Chao, K., Bau-chan, G.L. and Shelton, D.R. (2016) Continuous Gradient Temperature Raman Spectroscopy of Oleic and Linoleic Acids from −100 to 50˚C. Lipids, 51, 1289-1302. https://doi.org/10.1007/s11745-016-4194-1
[3] Broadhurst, C.L., Schmidt, W.F., Nguyen, J.K., Qin, J., Chao, K., Aubuchon, S.R. and Kim, M.S. (2017) Continuous Gradient Temperature Raman Spectroscopy and Differential Scanning Calorimetry of N-3DPA and DHA from −100 to 10˚C.
Che-mistry and Physics of Lipids, 204, 94-102.
DOI: 10.4236/jbpc.2018.91001 13 Journal of Biophysical Chemistry
Yields New Molecular Models of Arachidonic Acid and 2-Arachidonoyl-1-stearoyl- sn-glycero-3-phosphocholine. Prostaglandins, Leukotrienes and Essential Fatty Ac-ids, 127, 6-15. https://doi.org/10.1016/j.plefa.2017.09.019
[5] Olsen, E.F., Rukke, E.-O., Flåtten, A. and Isaksson, T. (2007) Quantitative Determi-nation of Saturated, Monounsaturated, and Polyunsaturated Fatty Acids in Pork Adi-pose Tissue with Non-Destructive Raman Spectroscopy. Meat Science, 76, 628-634. https://doi.org/10.1016/j.meatsci.2007.02.004
[6] Bekhit, M.Y., B. Grung, B. and Mjøs, S.A. (2014) Determination of Omega-3 Fatty Acids in Fish Oil Supplements Using Vibrational Spectroscopy and Chemometric Methods. Applied Spectroscopy, 68, 1190-1200. https://doi.org/10.1366/13-07210 [7] Toledo, D.A., Roque, N.R., Teixeira, L., Milán-Garcés, E.A., Carneiro, A.B.,
Almei-da, M.R., Andrade, G.F., Martins, J.S., Pinho, R.R., Freire-de-Lima, G.C., Bozza, P.T., D’Avila, H. and Melo, R.C. (2016) Lipid Body Organelles within the Parasite
Trypanosoma cruzi: A Role for Intracellular Arachidonic Acid Metabolism. PLoS
ONE, 11, e0160433. https://doi.org/10.1371/journal.pone.0160433
[8] Killeen, D.P., Marshall, S.N., Burgess, E.J., Gordon, K.C. and Perry, N.B. (2017) Raman Spectroscopy of Fish Oil Capsules: Polyunsaturated Fatty Acid Quantitation plus Detection of Ethyl Esters and Oxidation. Journal of Agricultural and Food
Chemistry,65, 3551-3558. https://doi.org/10.1021/acs.jafc.7b00099
[9] Dangi, B., Obeng, M., Nauroth, J.M., Teymourlouei, M., Needham, M., Raman, K. and Arterburn, L.M. (2009) Biogenic Synthesis, Purification, and Chemical Charac-terization of Anti-Inflammatory Resolvins Derived from Docosapentaenoic Acid (DPAn-6). The Journal of Biological Chemistry, 284, 14744-14759.
https://doi.org/10.1074/jbc.M809014200
[10] Kohli, P. and Levy, B.D. (2009) Resolvins and Protectins: Mediating Solutions to In-flammation. British Journal of Pharmacology, 158, 960-971.
https://doi.org/10.1111/j.1476-5381.2009.00290.x
[11] Weylandt, K.-H. (2016) Docosapentaenoic Acid Derived Metabolites and Media-tors—The New World of Lipid Mediator Medicine in a Nutshell. European Journal
of Pharmacology, 785, 108-115. https://doi.org/10.1016/j.ejphar.2015.11.002
[12] Serhan, C.N. (2017) Discovery of Specialized Pro-Resolving Mediators Marks the Dawn of Resolution Physiology and Pharmacology. Molecular Aspects of Medicine, 58, 1-11. https://doi.org/10.1016/j.mam.2017.03.001
[13] Hansen, T.V., Dalli, J. and Serhan, C.N. (2017) The Novel Lipid Mediator PD1n-3 DPA: An Overview of the Structural Elucidation, Synthesis, Biosynthesis and Bioactions.
Prostaglandins & Other Lipid Mediators, 133,103-110.
https://doi.org/10.1016/j.prostaglandins.2017.06.003
[14] Zheng, J.S., Huang, T., Yang, J., Fu, Y.Q. and Li, D. (2012) Marine N-3 Polyunsatu-rated Fatty Acids Are Inversely Associated with Risk of Type 2 Diabetes in Asians: A Systematic Review and Meta-Analysis. PLoS ONE, 7, e44525.
https://doi.org/10.1371/journal.pone.0044525
[15] Zheng, J.S., Hu, X.J., Zhao, Y.M., Yang, J. and Li, D. (2013) Intake of Fish and Ma-rine N-3 Polyunsaturated Fatty Acids and Risk of Breast Cancer: Meta-Analysis of Data from 21 Independent Prospective Cohort Studies. BMJ, 346, e3706.
https://doi.org/10.1136/bmj.f3706
DOI: 10.4236/jbpc.2018.91001 14 Journal of Biophysical Chemistry
[17] Wan, Y., Zheng, J., Wang, F. and Li, D. (2017) Fish, Long Chain Omega-3 Polyun-saturated Fatty Acids Consumption, and Risk of All-Cause Mortality: A Systematic Review and Dose-Response Meta-Analysis from 23 Independent Prospective Co-hort Studies. Asia Pacific Journal of Clinical Nutrition, 26, 939-956.
[18] Kuhn, H., Walther, M. and Kuban, R.J. (2002) Mammalian Arachidonate 15-Li- poxygenases Structure, Function, and Biological Implications. Prostaglandins &
Other Lipid Mediators, 68-69, 263-290.
[19] Andreou, A. and Feussner, I. (2009) Lipoxygenases: Structure and Reaction Me-chanism. Phytochemistry, 70, 1504-1510.
https://doi.org/10.1016/j.phytochem.2009.05.008
[20] Neau, D.B., Bender, G., Boeglin, W.E., Bartlett, S.G., Brash, A.R. and Newcomer, M.E. (2014) Crystal Structure of a Lipoxygenase in Complex with Substrate: The Arachidonic Acid-Binding Site of 8R-Lipoxygenase. The Journal of Biological
Che-mistry, 289, 31905-31913. https://doi.org/10.1074/jbc.M114.599662
[21] Kobe, M.J., Neau, D.B., Mitchell, C.E., Bartlett, S.G. and Newcomer, M.E. (2014) The Structure of Human 15-Lipoxygenase-2 with a Substrate Mimic. The Journal of
Biological Chemistry, 289, 8562-8569. https://doi.org/10.1074/jbc.M113.543777
[22] Kuhn, H., Banthiya, S. and van Leyen, K. (2015) Mammalian Lipoxygenases and Their Biological Relevance. Biochimica et Biophysica Acta, 1851, 308-330.
[23] Gabbs, M., Leng, S., Devassy, J.G., Monirujjaman, M. and Aukema, H.M. (2015) Advances in Our Understanding of Oxylipins Derived from Dietary PUFAs.
Ad-vances in Nutrition, 6, 513-540. https://doi.org/10.3945/an.114.007732
[24] Liao, X., Wang, W., Fan, C., Yang, N., Zhao, J., Zhang, Y., Gao, R., Shen, G., Xia, S. and Li, G. (2017) Prokaryotic Expression, Purification and Characterization of Hu-man Cyclooxygenase-2. International Journal of Molecular Medicine,40, 75-82. https://doi.org/10.3892/ijmm.2017.3007
[25] Qin, J., Chao, K. and Kim, M.S. (2010) Raman Chemical Imaging System for Food Safety and Quality Inspection. Transactions of theAmerican Society of Agricultural