ORIGINAL RESEARCH
Multiparametric MR Imaging of Sinonasal
Diseases: Time-Signal Intensity Curve– and
Apparent Diffusion Coefficient–Based
Differentiation between Benign and Malignant
Lesions
M. Sasaki M. Sumi S. Eida Y. Ichikawa T. Sumi T. Yamada T. Nakamura
BACKGROUND AND PURPOSE: The sinonasal region is a platform for a broad spectrum of benign and malignant diseases, and image-based differentiation between benign and malignant diseases in this area is often difficult. Here, we evaluated multiparametric MR imaging with combined use of TICs and ADCs for the differentiation between benign and malignant sinonasal tumors and tumorlike diseases.
MATERIALS AND METHODS: TICs obtained from dynamic contrast-enhanced MR imaging and ADCs were analyzed on a lesion-by-lesion (overall TIC and ADC) and pixel-by-pixel (TIC and ADC mapping) basis in patients with benign (n⫽21) or malignant (n⫽23) sinonasal tumors and tumorlike diseases. The TICs were semiautomatically classified into 5 distinctive patterns (flat, slow uptake, rapid uptake with low washout ratio, rapid uptake with high washout ratio, and miscellaneous). ADCs were determined by using b-values of 500 and 1000 s/mm2.
RESULTS: Malignant sinonasal tumors had small (⬍25%) areas of the type 1 flat TIC profile as determined by pixel-by-pixel TIC analysis and large (ⱖ50%) areas of low or extremely low ADCs (ⱕ1.2⫻10⫺3mm2/s) as determined by ADC mapping. Consequently, stepwise classification on the basis of TICs and ADCs successfully (at 100% accuracy) discriminated malignant from benign sino-nasal diseases in the present patient cohort.
CONCLUSIONS:Multiparametric MR imaging by using TICs and ADCs may help differentiate benign and malignant sinonasal diseases.
ABBREVIATIONS:ADC⫽apparent diffusion coefficient; DCE⫽dynamic contrast-enhanced; ROI⫽ region of interest; SCC⫽squamous cell carcinoma; SPAIR⫽spectral attenuated with inversion recovery; SPIR⫽spectral presaturation with inversion recovery; TIC⫽time-signal intensity curve; Tpeak⫽time to peak; TSE⫽turbo spin-echo; WR⫽washout ratio
T
he sinonasal region is a platform for a broad spectrum of benign and malignant diseases. Malignant tumors in the sinonasal region include SCCs; undifferentiated carcinomas; and small round blue cell tumors, such as neuroendocrine carcinoma, olfactory neuroblastoma, malignant melanoma, and lymphoma.1,2However, some inflammatory and benign diseases in the sinonasal area, such as rhinosinusitis, fungal sinusitis, polyps, and angiofibromas may exhibit tumorlike growths that resemble malignant tumors. Therefore, differen-tiation between benignity and malignancy in the sinonasal area is often difficult.Recent studies have shown that ADCs are significantly dif-ferent between benign and malignant diseases in the head and neck region, including the lymph nodes and salivary glands.3-5 However, a significant overlap of ADC was observed between benign and malignant diseases. TIC studies showed that DCE MR imaging contributed little to predicting malignancy of
head and neck lesions.6However, challenging studies demon-strated that combined uses of DCE and diffusion-weighted MR imaging successfully discriminated malignant from be-nign salivary gland tumors.4,7,8
Here, we tested the possibility that a similar strategy by using TICs and ADCs might be applicable to differentiation between benign and malignant sinonasal diseases.
Materials and Methods
Patients
The protocol of this prospective study was approved by the Ethic Committee of our hospital, and informed consent was obtained from all of the patients. From March in 2003 to October in 2010, 49 con-secutive patients underwent diffusion-weighted and DCE MR imag-ing examinations; all these patients were known to have masslike le-sions in the sinonasal area on clinical examination, conventional imaging including CT, or both. Of these, 5 cases were omitted from the present study; MR images revealed that 3 were cysts (2 postoper-ative maxillary cysts and 1 mucocele), and MR images were poor in the other 2 cases due to severe artifacts and patient movement. Con-sequently, we studied 44 patients with histologically proved sinonasal tumors or tumorlike diseases (14 women and 30 men; average age, 63⫾17 years) who received both DCE and diffusion-weighted MR imaging examinations. The study cohort comprised 21 benign lesions and 23 malignant tumors; the benign lesions included 12 inflamma-Received February 15, 2011; accepted after revision March 28.
From the Department of Radiology and Cancer Biology, Nagasaki University School of Dentistry, Nagasaki, Japan.
Please address correspondence to Takashi Nakamura, DDS, PhD, Professor and Chief, Department of Radiology and Cancer Biology, Nagasaki University School of Dentistry, 1-7-1 Sakamoto, Nagasaki 852-8588, Japan; e-mail: [email protected]
Indicates article with supplemental on-line tables.
tory diseases (5 rhinosinusitis, 4 inflammatory polyps, and 3 fungal rhinosinusitis) and 9 benign tumors and tumorlike diseases (3 in-verted papillomas, 3 organized hematomas, 2 hemangiomas, and 1 angiofibroma); malignant tumors included 10 squamous cell carci-nomas, 10 small round blue cell tumors (5 malignant lymphomas, 2 undifferentiated carcinomas, 1 malignant melanoma, 1 olfactory neuroblastoma, and 1 pleomorphic rhabdomyosarcoma), 2 adenoid cycstic carcinomas, and 1 metastatic renal cell carcinoma.
DCE MR Imaging
MR imaging was performed by using a 1.5-T MR imager (Gyroscan Intera 1.5T Master; Philips Healthcare, Best, the Netherlands) with a 140 mm⫻170 mm Synergy Flex M coil (Philips Healthcare). For DCE studies, axial T1-weighted images (TR/TE/number of signal in-tensity acquisitions⫽252 ms/10 ms/1) were obtained by using a TSE sequence (TSE factor⫽3), 200-mm FOV, 5-mm section thickness, 0.5-mm section gap, and a 256⫻175 matrix size. The scan time for each patient was 3 minutes. Gadolinium (meglumine gadopentatate, Magnevist; Bayer HealthCare Pharmaceuticals, Wayne, New Jersey) was injected intravenously at a dose of 0.2 mL/kg body weight and at an injection rate of 1.5 mL/s, followed by a 20-mL saline flush. In each patient, 19 scans were obtained at an interval of 10 seconds (0⬃180 seconds). We obtained 3 sections for DCE analysis from the mid-portion of each sinonasal lesion. We performed the gadolinium-enhanced MR imaging based on the institutional guideline that gad-olinium should not be used in patients with estimated glomerular filtration rate⬍30 mL/min/1.73 m2.
TIC Analysis
The sequential dynamic MR images in a DICOM format were transferred onto a personal computer and then analyzed by using ImageJ (National Institutes of Health, Bethesda, Maryland; http:// rsweb.nih.gov/ij/index.html) and Mathematica (Wolfram Re-search, Champaign, Illinois) software. Once an ROI was manually placed onto a sinonasal lesion area so that it included as much diseased area as possible on a pre-enhanced (⫽0 seconds) T1-weighted MR image, the same ROIs were automatically placed onto the subsequent 18 dynamic MR images by repeatedly copying and pasting the initial ROI by using the ImageJ software. Then, the diseased areas were extracted by using the ImageJ software. The TIC analysis was performed by using the Mathematica software on a lesion-by-lesion (overall TIC) and pixel-by-pixel basis (TIC mapping) as described previously.8
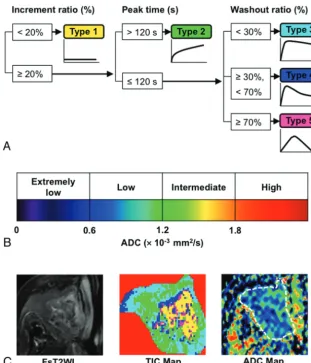
Each of the obtained TICs was automatically classified on the basis of the increment ratio, the Tpeak, and the WR into 5 types (types 1–5;
Fig 1). These TIC parameters were calculated by the following equa-tions: increment ratio (%)⫽(signal intensity at peak – signal inten-sity of pre-enhancement)⫻100/signal intensity of pre-enhancement; Tpeak⫽time required to reach the intensity peak; and WR (%)⫽
[(signal intensity at peak) – (signal intensity 180 seconds after the start of contrast medium injection)]⫻100/[(signal intensity at peak)⫺ (signal intensity of pre-enhancement)].
The TIC patterns were referred to as flat (type 1), slow uptake (type 2), rapid uptake with low WR (type 3), rapid uptake with high WR (type 4), or miscellaneous (type 5). Type 1 TICs are those
Fig 1.TIC and ADC categorization.A, Computer-aided TIC type analysis was performed on a lesion-by-lesion (overall TIC) and pixel-by-pixel basis (TIC mapping) by using 3 TIC parameters (increment ratio, Tpeak, and WR).8
B, ADC levels of sinonasal diseases were categorized on the lesion-by-lesion (overall ADC) or pixel-by-pixel basis (ADC mapping) into 4 types (extremely low, low, intermediate, and high).C, TIC and ADC maps demonstrate 2D distributions of 4 distinc-tive TIC profiles and 4 ADC-level categories in sinonasal lesions. Panels show axial fat-suppressed T2-weighted im-age (FsT2WI, left), and TIC (middle) and ADC (right) maps of a 65-year-old man with moderately differentiated SCC in the right maxillary sinus. Overall TIC, type 2; overall ADC, 0.80⫻
10⫺3 mm2
/s; TIC mapping, 10% type 1, 40% type 2, 35% type 3, 9% type 4, and 6% type 5 areas; ADC mapping, 17% extremely low, 78% low, 5% intermediate, and 0% high ADC areas. ROIs are indicated by masking extralesional area (red) on TIC map and by a broken line on ADC map.
HEAD
&
NECK
ORIGINAL
[image:2.594.52.364.42.405.2]with increment ratios⬍20% (Fig 1). Type 2 TICs are those with increment ratiosⱖ20% and Tpeak⬎120 seconds. Type 3 TICs are those having increment ratiosⱖ20%, with Tpeakⱕ120 seconds
and with WRs⬍30%. Type 4 TICs are those displaying increment ratiosⱖ20%, with Tpeakⱕ120 seconds and with WRsⱖ30% and ⬍70%. Type 5 TICs are those that were not categorized into any of the above-mentioned types. The TIC criteria for type 1–5 curves were prospectively applied to the obtained data on the basis of the previous study.8The percentage areas corresponding to each of the
5 TIC patterns of the total nodal area were calculated and pre-sented as TIC maps.
For pixel-by-pixel analysis, the percentage lesion areas corre-sponding to each of the 5 TIC patterns were calculated. The 2D dis-tributions of the distinct TIC patterns in the sinonasal lesions were displayed as color TIC maps.
Diffusion-Weighted MR Imaging
Axial diffusion-weighted images (TR/TE/numbers of signal intensity acquisition⫽3058 ms/93 ms/4) were obtained by using a single-shot, spin-echo echo-planar imaging. We used 200-mm FOV, 4-mm sec-tion thickness, 0.4-mm secsec-tion gap, and 112⫻88 matrix size. To minimize the influence of tissue perfusion on the ADC determina-tion, we used 2 b-values (500 and 1000 s/mm2).
Image Analysis for Diffusion-Weighted MR Imaging
We classified the sinonasal lesions by using ADC levels on the lesion-by-lesion (overall ADC) or pixel-by-pixel (ADC mapping) basis into 4 categories (Fig 1): extremely low ADC (⬍0.6⫻10⫺3mm2/s), low
ADC (0.6⫻10⫺3mm2/sⱕADC⬍1.2⫻10⫺3mm2/s), intermediate
ADC (1.2⫻10⫺3mm2/sⱕADC⬍1.8⫻10⫺3mm2/s), or high ADC Fig 2.TIC and ADC analyses of sinonsal benign and malig-nant diseases. Axial fat-suppressed T2-weighted images (left), TIC maps (middle), and ADC maps (right). Reference colors for TIC and ADC maps are shown in Fig 1.A, 37-year-old man with organized hematoma in right maxillary sinus. Overall TIC, type 2; overall ADC, 1.20⫻10⫺3
mm2 /s; TIC mapping, 60% type 1, 33% type 2, 6% type 3, 1% type 4, and 0% type 5 areas; ADC mapping, 13% extremely low, 35% low, 40% intermediate, and 12% high ADC areas.B, 76-year-old woman with fungal rhinosinusitis. Overall TIC, type 2; overall ADC, 1.18⫻10⫺3mm2/s; TIC mapping, 14% type 1, 44% type 2, 17% type 3, 15% type 4, and 10% type 5 areas; ADC mapping, 17% extremely low, 30% low, 44% interme-diate, and 9% high ADC areas.C, 86-year-old man with poorly differentiated SCC in right maxillary sinus. Overall TIC, type 2; overall ADC, 1.04⫻10⫺3
mm2
[image:3.594.53.372.42.539.2](ⱖ1.8⫻10⫺3mm2/s). The ADC criteria were prospectively used on
the basis of the previously reported results.4
Sequential gray-scale ADC map images that spanned a whole le-sion, except for the upper- and lowermost sections, were saved in DICOM format. Freehand ROIs along the margins of the lesions were manually placed onto diffusion-weighted images obtained atb⫽0 by using the corresponding fat-suppressed T2-weighted MR images as references for placing the ROIs. Then, average ADCs of the whole lesions were determined (overall ADCs). For ADC mapping, the per-centage of tumor areas corresponding to each of the 4 ADC categories were calculated on the pixel basis. For illustrating ADC mapping, the gray-scale ADC maps were converted to color ADC map images after setting the window level of gray-scale ADC map images at 1200 and window width at 2400 (Fig 1). These procedures were performed on a personal computer by using the OsiriX software (http://www.osirix-viewer.com/).
Susceptibility artifacts due to the air–soft tissue interface or dental fillings were minimal if present, and all the MR images used in the present study were good in quality.
Conventional MR Imaging
We obtained axial T1-weighted (TR/TE/number of signal intensity acquisitions⫽500 ms/15 ms/2) and fat-suppressed (SPIR or SPAIR) T2-weighted (TR/TE/number of signal intensity acquisition⫽4784 ms/80 ms/2 for SPIR; 6385 ms/80 ms/2 for SPAIR) MR images of the sinonasal lesions by using a TSE sequence with TSE factor of 3 (T1-weighted) or 15 (SPIR and SPAIR). We used 200-mm FOV, 256⫻ 224 scan, and 512⫻512 reconstruction matrix sizes, 4-mm section thickness, and 0.4-mm section gap.
Results
TICs and ADCs of Sinonasal Lesions
Overall TIC distributions, TIC mapping results, overall ADCs, and ADC mapping results are shown in On-line Tables 1 and 2. We found that many TIC and ADC parameters differed
significantly between benign lesions and malignant tumors and even between some histologic subtypes of benign and ma-lignant diseases (bottom panels of On-line Tables 1 and 2). However, significant overlaps in the parameters were present between the 2 distinctive sinonasal disease types. Therefore, we sought to differentiate between benign lesions and malig-nant tumors by using a stepwise TIC and ADC approach.
Discrimination of Benign Sinonasal Lesions with Large Type 1 TIC Areas
Of the 44 sinonasal lesions, 6 benign lesions contained large (ⱖ25%) areas of type 1 TIC profile (Figs 2Aand 3) but exhib-ited type 2 overall TIC patterns. However, the remaining 15 benign lesions and 23 malignant tumors contained smaller (⬍25%) areas of type 1 TIC profile (Fig 3).
Differentiation between Benign and Malignant Sinonasal Lesions on the Basis of Overall TIC Pattern
Of the 38 sinonasal lesions with small (⬍25%) areas of the type 1 TIC profile, 22 displayed type 2 overall TIC patterns (13 benign lesions and 9 malignant tumors) and 16 showed type 3 or 4 overall TIC patterns (2 benign lesions and 14 malignant tumors) (Fig 2B-D). Therefore, differentiation based on TIC pattern alone was unsatisfactory.
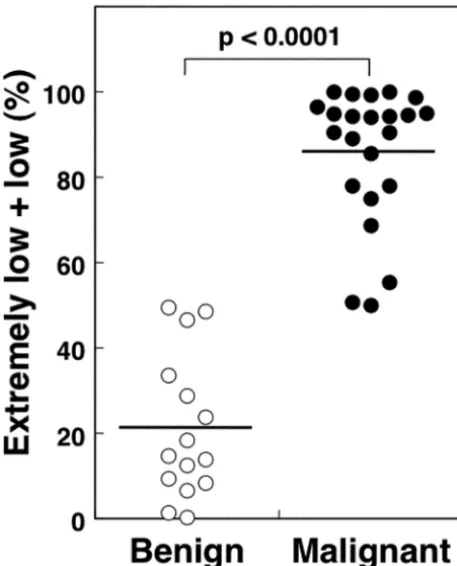
[image:4.594.55.374.45.308.2]and 4). In contrast, all 23 malignant tumors with such TIC properties containedⱖ50% ADC mapping areas with low or extremely low ADCs (Figs 2C-,D, and 4). Consequently, this approach successfully differentiated between the 15 benign lesions and the 23 malignant tumors with small (⬍25%) areas of the type 1 TIC profile (Fig 3).
Diagnostic Flow Chart Based on the Multiparametric MR Imaging
Consequently, malignant tumors were depicted as being sino-nasal lesions with small (⬍25%) areas of the type 1 TIC profile as determined by pixel-by-pixel TIC analysis when these were associated with large (ⱖ50%) areas of low or extremely low ADCs (ⱕ1.2⫻10⫺3mm2/s) as determined by ADC mapping (Fig 3).
Discussion
The physiologic properties of lesions can be estimated by ki-netic studies after contrast-medium injection. The use of the TIC is the most conventional method of assessing a DCE MR study. In the extracranial head and neck region, DCE MR im-aging has been applied to differentiate between normal and metastatic or lymphoma nodes in the neck, and between be-nign and malignant salivary gland tumors.8-11Furthermore, the DCE MR technique may provide a useful predictor of re-sponse to radio- or chemotherapy for head and neck carcino-mas, and it has been used to distinguish posttherapeutic changes from recurrent tumors.12However, many lesions are
composed of distinctive tissues that have different TIC char-acteristics. Therefore, large discrepancies may be present be-tween TIC profiles and corresponding histologic findings. To improve correlations between TIC results and histology, the use of TIC analysis on a pixel-by-pixel basis has been pro-posed. Recently, Eida et al8applied a pixel-based TIC analysis to salivary gland tumors by using surface coils and successfully correlated TIC patterns with tumor histology. Here, we ap-plied this technique to deep lesions without significantly di-minishing image resolution.
Diffusion-weighted imaging also has been employed for diagnosing extracranial head and neck lesions.13-15A small ADC indicates limited diffusion of water molecules in tissues. Theoretically, therefore, a disease area with small ADCs con-tains a greater number of cells than that with greater ADCs. Consistent with this notion, the ADC map demonstrated that lymphomas had smaller ADCs than did well-differentiated SCCs14and that cell-rich areas had lower ADC values than matrix-dominant areas in benign salivary gland tumors.15In the latter study, ADC mapping based on a pixel-by-pixel anal-ysis of the whole tumor volume facilitated the differentiation between benign and malignant salivary gland tumors.
Type 1 TIC or nonenhanced lesions in sinonasal diseases are variable in area (Table 1). Some malignant tumors, such as malignant melanoma, SCCs, and undifferentiated carcino-mas, contained small but substantial areas of the type 1 TIC profile; however, these type 1 TIC areas did not exceed 25% of the malignant tumor area. Discrimination between tumors with large and small areas of the type 1 TIC minimizes the possibility that presence of a large area with the type 1 TIC profile would affect the overall TIC and ADC results of such tumors.4However, further differentiation between the benign and malignant sinonasal diseases was not effective on the basis of overall TICs only, a finding that was consistent with the previous study.6
The second differentiation step was based on ADC charac-teristics (ADC mapping) of sinonasal diseases. White et al5 showed some ability of diffusion-weighted imaging to distin-guish benign from malignant sinonasal lesions, though with some overlap. We found that benign and malignant sinonasal diseases were successfully differentiated on the basis of ADC mapping (Fig 3). It should be noted that malignant tumors having small areas of the type 1 TIC profile exhibited different overall TIC profiles (ie, types 2, 3, or 4). However, the follow-ing process of differentiation in these groups with different overall TIC profiles was achieved on the basis of the same ADC criteria, ie, large (ⱖ50%) percentage areas with⬍1.2⫻10⫺3 mm2/s ADCs. Therefore, the presence of large disease areas with low or extremely low ADC levels may be a critical factor for differentiation between benign and malignant sinonasal lesions as well as other head and neck diseases.13-16
Many of the sinonasal malignant tumors showed type 2 overall TIC patterns (9/23) and were associated with large per-centage areas of the type 2 TIC patterns (41⫾20%). These TIC characteristics are different from those found in carcino-mas and lymphocarcino-mas in the other head and neck regions, where the type 3 or 4 TIC patterns were dominant and the type 2 TIC patterns were rarely seen in the malignant tumors.4,7-11 The present study demonstrated that the type 2 TIC pattern is characteristic of sinonasal inflammatory diseases (On-line Ta-Fig 4.ADC-based differentiation between benign and malignant sinonasal diseases. Plot
[image:5.594.54.283.45.328.2]ble 1). These findings suggest that sinonasal diseases may be greatly affected by persistent inflammation in the surrounding sinonasal tracts. The function of ciliated cells in the sinonasal region is to preserve the mucus drainage system. However, mucus flow may be interrupted when a tumor or tumorlike mass occupies the sinonasal tract, which inevitably leads to the long-standing stagnation associated with inflammation.17 Therefore, the presence of a type 2 pattern is a marker for a large inflammatory component of the mass, with associated false elevation of overall ADC, making the ADC histogram analysis a more accurate measurement of the true lesion ADC. Sinonasal organized hematoma can be potentially aggres-sive, mimicking malignant lesions.1,2 Consistent with their histologic structures, all of the 3 organized hematomas in this study exhibited dominant areas of nonenhanced (type 1) or slowly enhanced (type 2) tumor areas on pixel-based TIC analysis, and were thus discriminated as benign lesions at the first step of multiparametric MR imaging (Fig 3).
Fungus infections were discriminated as benign lesions at this first step on the basis of the presence of large areas of the type 1 TIC profile or as those with small areas of the type 1 TIC profile, type 2 overall TICs, and⬍50% areas of extremely low or low ADC. However, on average, fungal lesions had type 2 overall TIC patterns with approximately 50% low or ex-tremely low ADCs (Table 2). These imaging features may po-tentially lead to false-positive results for malignancy. Intral-esional calcification was detected as very low T2 signals in all 3 fungus lesions, and this finding may be useful in differentiat-ing between these lesions and other benign sinonasal lesions. However, intralesional calcification also was noted in one of the organized hematomas in this study.
Small round blue cell tumors share common histologic characteristics and comprise 20%–30% of tumors of the sino-nasal region. We found that the SRBCTs displayed a wide range of the TIC profiles (On-line Table 1). However, their ADC levels were low, reflecting their cellular characteristics (high cell attenuation, with relatively small-sized nuclei and scant cytoplasm).18
A significant flaw of this study is that the multiparametric MR imaging was not successfully correlated with the histo-logic features of the excised specimens; this was mainly be-cause the histologic specimens needed for correlation with the MR images that spanned broad disease area were, in many cases, unavailable.
An additional limitation of this study is that each lesion was incompletely sampled, because only 3 sections could be ob-tained through the midportion of each lesion for TIC analysis. Lesions are often heterogeneous, varying degrees of trapped secretions and inflamed mucosa may be included in a given section, and there is likely potential for inter- and intraob-server variation in the manual segmentation of a mass from adjacent inflamed mucosa and trapped secretions. The com-bination of these factors may result in positives and false-negatives. The small cohort size of the present study is
appar-ently another major flaw. The multiparametric MR imaging– based differentiation conducted in this study was achieved after a lot of trial and error, and it may not be effective in another large study cohort. Therefore, this study does not pro-pose rigid criteria for diagnosing benign and malignant sino-nasal diseases.
Conclusions
Here, we demonstrated that multiparametric MR imaging by using ADCs and TICs efficiently differentiated between be-nign and malignant sinonasal diseases. Together with a previ-ous study by using a similar MR imaging strategy in diagnos-ing salivary gland tumors,4 the present results suggest the feasibility of the multiparametric MR imaging technique in differentiating between benign and malignant diseases in the head and neck region.
References
1. Som PM, Brandwein M.Sinonasal cavities: inflammatory diseases, tumors, fractures, and postoperative findings.In: Som PM, Curtin HD, eds.Head and Neck Imaging, 3rd ed. St. Louis: Mosby; 1996:126 –315
2. Harnsberger HR.Diagnostic Imaging Head and Neck. Salt Lake City: Amirsys; 2004
3. Vandecaveye V, De Keyzer F, Vander Poorten V, et al.Head and neck squamous cell carcinoma: value of diffusion-weighted MR imaging for nodal staging.
Radiology2009;251:134 – 46
4. Eida S, Sumi M, Nakamura T.Multiparametric magnetic resonance imaging for the differentiation between benign and malignant salivary gland tumors.
J Magn Reson Imaging2010;31:673–79
5. White ML, Zhang Y, Robinson RA.Evaluating tumors and tumorlike lesions of the nasal cavity, the paranasal sinuses, and the adjacent skull base with diffu-sion-weighted MRI.J Comput Assist Tomogr2006;30:490 –95
6. Takashima S, Noguchi Y, Okumura T, et al.Dynamic MR imaging in the head and neck.Radiology1993;189:813–21
7. Yabuuchi H, Matsuo Y, Kamitani T, et al.Parotid gland tumors: can addition of diffusion-weighted MR imaging to dynamic contrast-enhanced MR imaging improve diagnostic accuracy in characterization?Radiology2008;249:909 –16 8. Eida S, Ohki M, Sumi M, et al.MR factor analysis: improved technology for the assessment of 2D dynamic structures of benign and malignant salivary gland tumors.J Magn Reson Imaging2008;27:1256 – 62
9. Shah V, Fischbein NJ, Gandhi D, et al.Dynamic contrast-enhanced MR imag-ing.Top Magn Reson Imaging2004;15:71–77
10. Fischbein NJ, Noworoiski SM, Henry RG, et al.Assessment of metastatic cer-vical adenopathy using dynamic contrast-enhanced MR imaging.AJNR Am J Neuroradiol2003;24:301–11
11. Yabuuchi H, Fukuya T, Tajima T, et al.Salivary gland tumors: diagnostic value of gadolinium-enhanced dynamic MR imaging with histologic correlation.
Radiology2003;226:345–54
12. Kim S, Loevner LA, Quon H, et al.Prediction of responses to chemoradiation therapy in squamous cell carcinomas of the head and neck using dynamic contrast-enhanced MR imaging.AJNR Am J Neuroradiol2010;31:262– 68 13. Sumi M, Sakihama N, Sumi T, et al.Discrimination of metastatic cervical
lymph nodes with diffusion-weighted MR imaging in patients with head and neck cancer.AJNR Am J Neuroradiol2003;24:1627–34
14. Sumi M, Nakamura T.Diagnostic importance of focal defects in the apparent diffusion coefficient-based differentiation between lymphoma and squa-mous cell carcinoma nodes in the neck.Eur Radiol2009;19:975– 81 15. Eida S, Sumi M, Sakihama N, et al.Apparent diffusion coefficient mapping of
salivary gland tumors: prediction of the benignancy and malignancy.AJNR Am J Neuroradiol2007;28:116 –21
16. Sumi M, Ichikawa Y, Nakamura T.Diagnostic ability of apparent diffusion coefficients for lymphomas and carcinomas in the pharynx.Eur Radiol
2007;17:2631–37
17. Eggesbø HB.Radiological imaging of inflammatory lesions in the nasal cavity and paranasal sinuses.Eur Radiol2006;16:872– 88