ISSN Online: 2161-6663 ISSN Print: 2161-6620
DOI: 10.4236/ajmb.2018.81003 Dec. 22, 2017 26 American Journal of Molecular Biology
Data Analysis of Multiplex Sequencing
at SOLiD Platform: A Probabilistic
Approach to Characterization
and Reliability Increase
Fábio Manoel França Lobato
1*, Carlos Diego Damasceno
2,3, Daniela Soares Leite
4,
Ândrea Kelly Ribeiro-dos-Santos
5, Sylvain Darnet
5, Carlos Renato Francês
2,
Nandamudi Lankalapalli Vijaykumar
6, Ádamo Lima de Santana
21Engineering and Geoscience Institute, Federal University of Western Pará (UFOPa), Santarém, Brazil 2Technological Institute, Federal University of Pará (UFPa), Belém, Brazil
3Institute of Mathematical and Computer Sciences, University of São Paulo (USP), São Carlos, Brazil 4Department of Morphology and Physiological Sciences, State University of Pará, Marabá, Brazil 5Biological Science Institute, Federal University of Pará (UFPa), Belém, Brazil
6Laboratory of Computing and Applied Mathematics, National Institute for Space Research (INPE), São José Dos Campos, Brazil
Abstract
New sequencing technologies such as Illumina/Solexa, SOLiD/ABI, and 454/Roche, revolutionized the biological researches. In this context, the SOL-iD platform has a particular sequencing type, known as multiplex run, which enables the sequencing of several samples in a single run. It implies in cost reduction and simplifies the analysis of related samples. Meanwhile, this se-quencing type requires an additional filtering step to ensure the reliability of the results. Thus, we propose in this paper a probabilistic model which con-siders the intrinsic characteristics of each sequencing to characterize multiplex runs and filter low-quality data, increasing the data analysis reliability of mul-tiplex sequencing performed on SOLiD. The results show that the proposed model proves to be satisfactory due to: 1) identification of faults in the se-quencing process; 2) adaptation and development of new protocols for sample preparation; 3) the assignment of a degree of confidence to the data generated; and 4) guiding a filtering process, without discarding useful sequences in an arbitrary manner.
Keywords
Probabilistic Modeling, Health Informatics, SOLiD Barcoding System, Statistical Analysis, Multiplex Sequencing
How to cite this paper: Lobato, F.M.F., Damasceno, C.D., Leite, D.S., Ribei-ro-dos-Santos, Â.K., Darnet, S., Francês, C.R., Vijaykumar, N.L. and de Santana, Á.L. (2018) Data Analysis of Multiplex Sequencing at SOLiD Platform: A Proba-bilistic Approach to Characterization and Reliability Increase. American Journal of Molecular Biology, 8, 26-38.
https://doi.org/10.4236/ajmb.2018.81003
Received: May 17, 2017 Accepted: December 19, 2017 Published: December 22, 2017
Copyright © 2018 by authors and Scientific Research Publishing Inc. This work is licensed under the Creative Commons Attribution International License (CC BY 4.0).
DOI: 10.4236/ajmb.2018.81003 27 American Journal of Molecular Biology
1. Introduction
New sequencing technologies such as Illumina/Solexa, SOLiD/ABI and 454/ Roche, revolutionized biological researches [1] [2]. A large amount of data gen-erated by these platforms, combined with the sequencing cost reduction, further increased investigations in the fields of genome, proteome, and transcriptome. New applications, such as Personalized Medicine, have emerged as a result of the discovery and drugs development [3]. Moreover, works related to personalized cancer diagnosis and treatment also gained attention [4]. Due to this significant capillarity, researchers started focusing on the New Generation Sequencers. They represent a challenge in computational tractability, regarding memory and performance, as a result of the large volume of data generated, usually above 100 million of short readings (32 - 400 base pairs in length) per run [5].
Initially, most studies in the area of bioinformatics tools focused only on soft-ware development, attempting to balance memory consumption and processing, to reduce the execution time of biological analysis, especially the task of alignment with a reference [6]. Currently, several tools are consolidated for Next-Generation Sequencing (NGS) platforms. Therefore, the efforts were directed to optimize the analysis process as a whole, considering the intrinsic platforms characteristics.
The SOLiD platform has a particular sequencing type called Multiplex Run, which enables the sequencing of several samples in a single execution. This fea-ture is important to biomedical areas as it reduces costs and time for sequencing several samples. It occurs because the samples are prepared and submitted to the sequencer at the same time, thus minimizing the use of reagents and working hours of researchers. Besides, the multiplex run becomes more useful to the analysis of related samples. For example, it is possible sequencing a particular tumor tissue at different stages to compare gene expressions.
This research was motivated due to some gaps found in quality measurement tools for this sequencing type. Moreover, the area has only one proprietary tool that manipulates data from Multiplex Run, which is the Corona Lite Pipeline from Applied Biosystem. This tool is unable to perform investigations on the data quality and consistency. Aiming to tackle the gaps presented, we present in this paper a probabilistic approach to increase the reliability of data analysis from multiplex sequencing carried out on SOLiD, assigning a degree of confi-dence to the data generated. The proposed model can be used to guide the fil-tering process that respects the characteristics of each sequencing, without arbi-trarily discarding useful sequences.
The remainder of this paper is organized as follows: a briefly theoretical back-ground is given in Section 2; related works are discussed in Section 3; Section 4 describes the paper proposal; results and final remarks are presented in Sections 5 and 6, respectively.
2. Multiplex Sequencing on SOLiD System
pre-DOI: 10.4236/ajmb.2018.81003 28 American Journal of Molecular Biology sented, emphasizing the samples markup system technology.
2.1. SOLiD System
SOLiD (Sequencing by Oligonucleotide Ligation and Detection) is an NSG plat-form developed by Thermo Fisher Scientific (plat-former Life technologies) launched in 2007. It uses a technology based on the ligation of fluorescently labeled hybri-dization probes to determine the sequence of a template DNA strand [2]. The developer claims that the feature of check two bases at a time increases the se-quencing reliability [7].
The sample preparation is done by fragmentation, adaptor ligation, hybridiza-tion to beads and emulsion PCR, similarly for the 454 systems [2]. The beads are then immobilized on a glass slide. The preparation proceeds adding a universal primer and fluorescently labeled oligonucleotide probes. The ligation reaction is based on probe recognition. As mentioned before, the probes used in SOLiD system interrogate two bases per reaction [8]. Four colored dyes are used in the SOLiD System, representing the four possible two-base combinations. The first base in the sequence is always from the universal primer. Then, the rest of the sequence can be infered from the color data obtained. Despite the benefits of this strategy, [9] states that this sequencing method has limited read lengths. Moreo-ver, the computational infrastructure required is expensive.
2.2. Multiplex Sequencing
The SOLiD platform supports multiplex sequencing up to 256 samples in a sin-gle run in its second version. This task is performed by combining individual slides and a proprietary barcodes markup system from Applied Biosystem [7] [8]. Although the use of slides equipped with sites make the data retrieving process more reliable, they restrict the space for the beads containing the sam-ples to be sequenced, thus, reducing the sequencing coverage.
To increase the density of the beads, and thereby to improve its coverage, SOLiD uses markers that are attached to the samples to allow data differentia-tion. Since physical separators are not employed, this process maximizes the se-quencing space [7] [10]. In SOLiD, the markers presented [8] consist of six nuc-leotides, starting with Guanine. The systems uses only 16 out of the 1024 possi-ble sequences, which were chosen based on their same melting temperature, low error rate and unique orthogonality in colorspace [7]. Table 1 presents the Bar-codes available, represented both in colorspace and base space.
3. Related Works
DOI: 10.4236/ajmb.2018.81003 29 American Journal of Molecular Biology
Table 1. The sixteen barcodes of standard library.
Barcode Colorspace Basespace
1 “0032” GGGCCT
2 “0111” GGTGTG
3 “0200” AAGGGG
4 “0323” CCGATG
5 “1013” CAACGA
6 “1130” GTGCCC
7 “1221” GTCTGG
8 “1302” ACGGAG
9 “2020” GAAGGG
10 “2103” GACCGC
11 “2212” CTCAGG
12 “2331” AGCGTT
13 “3001” CGGGTC
14 “3122” CGTCTG
15 “3233” TAGCGT
16 “3310” GCGTTA
following reasons: 1) they are smaller, being directly proportional to the processing cost; 2) the sequences are in the second stage of sequencing, under-going a unique degeneration process, different from sequences of interest. Con-sequently, the markup system reflects the sequencing quality as a whole.
Among the works that examine the SOLiD output reliability, [14] deserves at-tention. The authors analyzed the quality decay pattern, concluding that there is a high error probability from 20 bp, and the average Quality Value (QV) is less than 15. In order to improve data reliability, [14] developed a framework based on heuristics that filters readings with quality lower than 10.
Heuristics are useful for analyzing large sequences since algorithms based on it usually have less complexity. As a consequence, heuristics require less processing time compared to analytical algorithms. In contrast, analytical solu-tions improve reliability since they generate more accurate results [15] [16]. Another point that should be emphasized is that heuristic-based approaches are not indicated for analysis of ancestors or transcribed samples, which are more susceptible to degeneration time of DNA molecules [17] and have a greater con-taminants presence[10] [18].
DOI: 10.4236/ajmb.2018.81003 30 American Journal of Molecular Biology can develop their own applications and analysis workflows [20]. There are also open source solutions for NGS data analysis that can be implemented in cloud services such as Amazon Elastic Compute Cloud (EC2) [22].
Therefore, the development of a scalable approach to allow data quality evalu-ation in Multiplex Runs represents a gap in state of the art and state of practice models. Besides, the approach should identify exogenous agents responsible for degrading the process, and in which stages they act. Aiming to fill these gaps, we proposed in this paper a probabilistic model which considers the intrinsic cha-racteristics of each sequencing to characterize multiplex runs and filter low- quality data, increasing the data analysis reliability of multiplex sequencing per-formed on the SOLiD platform.
4. Char Barcoding
4.1. Case Study
The biological material used to characterize the SOLiD markup system was de-rived from five cancer patients, with two samples extracted from each. From these ten samples, two sequencing activities were performed. Due to a systemic failure, the second run was divided in two. On average, 300 Gigabytes (GB) of text-files were produced in these sequencings process.
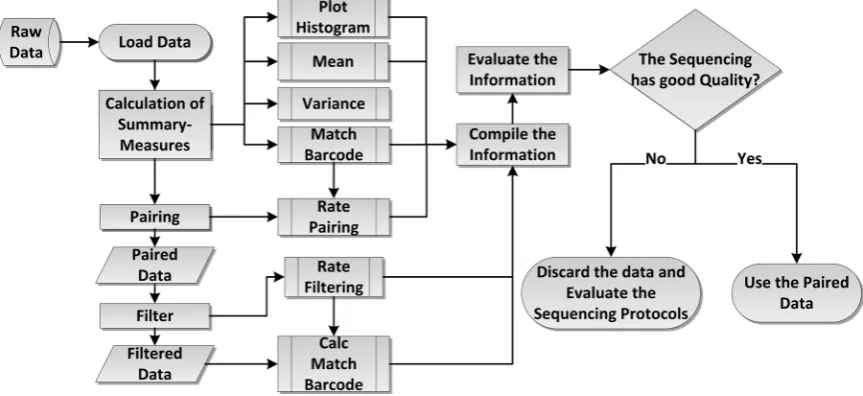
[image:5.595.106.538.510.708.2]The multiplex sequencing output consists of four files. Two containing the markup and interest sequences, and two with their qualities. The output files should present an equivalence in terms of readings amount with the proportion of samples labeled with barcodes. However, some failures were observed. More specifically, regarding the discrepancy in samples proportion and the presence of unused barcodes in the experiment [23], aiming to tackle these issues, we pro-posed a probabilistic model that can increase the reliability of analyses involving multiplex sequencing. Figure 1 presents the basic workflow of the proposed ap-proach, showing the multiplex sequencing characterization, and filtering method
DOI: 10.4236/ajmb.2018.81003 31 American Journal of Molecular Biology developed for further analysis.
4.2. Probabilistic Model
The model proposed is based on the Quality Values (QV) associated with di- base transitions. The QV ranges from −1 to 35, and for proprietary reasons, Ap-plied Biosystem doesn’t provide details on how this value is obtained nor the mapping function between the QV and the associated probability. Through an extensive literature review and exhaustive tests, we perceived that the following Equation (1) can be used to map the quality-probability and adapt the range of QVs reported by the SOLiD platform:
( )
= 1 10 101Q
P Q − − +
(1) As the range of the QVs includes a negative number, it was necessary to adjust it for further normalizing between zero and one, adding a unit (Q + 1). The re-sult obtained by Equation (1) represents the probability associated with di-base detection. In other words, the probability of the sequence has not been an event of chance.
The readings were modeled as a Markov Chain to evaluate the degree of a se-quences confidence. The first sequence nucleotide and the subsequent transi-tions represent states with transition probability P(Q). For better comprehension of the approach used, an example is given for the colorspace sequence: G00, with Quality Values 10 24, by the proposed quality-probability mapping, the transi-tions probabilities are 0.92057 and 0.99684, as shown in Figure 2.
To calculate the degree of confidence of each sequence (θ), the probabilities of all existing transitions are multiplied, as shown in Equation (2). For example in Figure 2, the degree of confidence of “G00” is 0.91766.
( )
=( )
P θ ΠP Q (2)
This probabilistic model allows: 1) the discovery of summary measures able to characterize the sequence from the markup system; 2) guide a flexible filtering process, respecting the intrinsic sequencing characteristics; 3) evaluate and im-prove the sequencing protocols used.
4.3. Sequencing Characterization
[image:6.595.264.484.608.708.2]The search for summary measures of a given number of samples is a non-trivial
DOI: 10.4236/ajmb.2018.81003 32 American Journal of Molecular Biology task. After obtaining the degree of confidence, it was possible to calculate several statistical measures, including the mean and the variance, representing the con-centration and dispersion to characterize the sequencing. However, this infor-mation is not sufficient to describe a multiplex sequencing in the SOLiD plat-form. Thus, the rate of sequences obtained that match with the standard library of barcodes, and the rate of unpaired sequences between files was also used to evaluate the sequencing quality.
As shown previously, the output of multiplex sequencing held in SOLiD is di-vided as follows: two files with information about the markup system, and two files with information on the sequences of interest. The platform pre-filters these data during the sequencing process on real-time. Due to the large volume of data and processing time constraints, there are some flaws in the file pairing, which must be treated in a posterior analysis.
One example of an insight that the proposed model can give is related to sam-ples contaminants or reagents used to attach the marker analyzing the rate of obtained marked sequences that match to the standard library barcodes. Anoth-er example is when the model shows a significant numbAnoth-er of unpaired readings. It can be interpreted as sequencing failures and may involve the beads cloning steps or the deposit on the slides. For a better visualization of the sequencing behavior, the probability density function histogram was also generated in addi-tion to the abovemenaddi-tioned measures. The histograms for the case studies are presented in the Results and Discussion section.
4.4. Filtering
Despite the filtering scheme that uses as a threshold based directly on the Quali-ty Value, the proposed model accepts as input a minimum value of the degree of confidence. It enables a better fit, since changes in the degree of confidence are more sensitive when compared to changes in the filtering methods that use the QV directly.
The use of the degree of confidence as an input parameter is also important to multiplex sequencing. For example, for a sequencing which presents a good av-erage but a low matching rate, it is necessary to consider a higher threshold. Whereas, in sequencing with optimal rates, it is possible to relax the threshold to maximize the recovery of readings. To evaluate the proposed approach, several filtering were performed using the QV and the degree of confidence as input parameters. As assessment criterion, the rate of filtered sequences was used, which represents the number of sequences number that were above the thre-shold, and the match with barcodes used in the experiment.
5. Results and Discussion
DOI: 10.4236/ajmb.2018.81003 33 American Journal of Molecular Biology
5.1. Multiplex Sequencing Evaluation
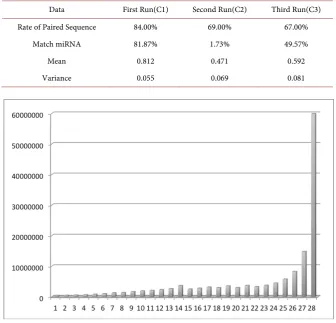
The summary measures calculated for the case study data are shown in Table 2. The Rate of Paired Sequence aims to evaluate issues in the pre-filtering step, which is performed by the SOLiD platform during the sequencing. A low pairing rate characterizes a low quality of readings. In this scenario, the readings are the sequences of interest and the markup used in the multiplex sequencing. As shown in Table 2, C2 and C3 runs presented this kind of issue. Another relevant information to evaluate the sequencing is the rate of matches with the barcodes used in the experiments.
Even though it is possible to analyze the measures separately, it is more ad-vantageous to correlate them. For instance, if there is a good match with the barcodes of the kit and low match with the barcodes used in the experiments, there were probable failures in the protocols and possible contamination. Another pertinent scenario it is the low match in the last two sequencings, it can be concluded that problems occurred in the beads amplification stages or con-tamination in the barcodes preparation.
[image:8.595.205.542.389.712.2]To improve the sequencing characterization, Probability Density Function (PDF) histograms were generated by Sturges interval. The graphs for runs C1, C2 and C3 are, respectively, Figures 3(a)-(c).
Table 2. Information of the Analyzed Sequencing.
Data First Run(C1) Second Run(C2) Third Run(C3)
Rate of Paired Sequence 84.00% 69.00% 67.00%
Match miRNA 81.87% 1.73% 49.57%
Mean 0.812 0.471 0.592
Variance 0.055 0.069 0.081
DOI: 10.4236/ajmb.2018.81003 34 American Journal of Molecular Biology (b)
[image:9.595.208.541.53.545.2](c)
Figure 3. Analyzed Sequencing Probability Density Functions. (a) C1 Probability Density
Function; (b) C2 Probability Density Function; (c) C3 Probability Density Function.
The graphs present the expected behavior given the statistical information contained in Table 2. Figure 3(a) shows C1 showing a large number of readings with the degree of confidence close to 1, and a low variability, while Figure 3(b) and Figure 3(c) shows the shows the C2 and C3 sequencing behavior. It should be noted that C2 and C3 are part of the same sequencing—the same samples were used. However, due to a systemic power failure during the process, the run was divided in two, in which C2 being the most affected by the power surges.
DOI: 10.4236/ajmb.2018.81003 35 American Journal of Molecular Biology preparation and sequencing, the greater the natural decay of the magnetic metal beads, to which the sequences are attached. It decreases the light intensity de-tected by the fluorochromes and, therefore, the quality of the readings. These facts explain the larger presence of low-quality readings in C3 when compared to C1 and justify the need to filter the data with low quality.
5.2. Filtering Results
The first filtering was conducted using QV as input. It was observed that small variations in the input parameter imply in discrepancies in the number of se-quences that did not pass the filters threshold. However, as the degree of confi-dence was used, the changes are less abrupt, especially for lower conficonfi-dence val-ues. These changes are shown in Table 3.
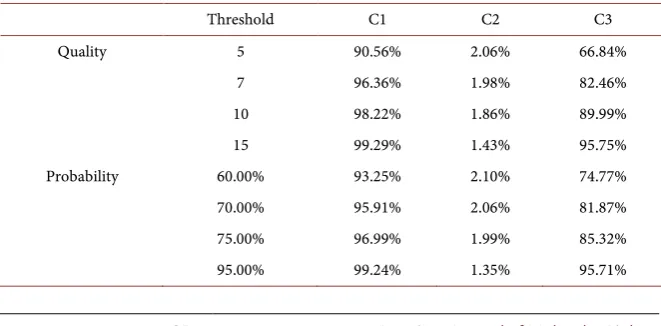
[image:10.595.208.540.386.552.2]Analyzing the data obtained by the model application, it was possible to ob-serve that the C2 and C3 filtered sequences rate are lower and in line with the cha-racteristics identified previously. As one of the requirements of the approach is sca-lability, filtering based on Degree of Confidence is more useful, given that for large sequences (e.g. sequences of interest) the fine-tuning provides a better filter control. As criteria for assessing the filtering, the Match with Barcodes used in the expe-riment was selected as a parameter. Table 4 presents the results obtained.
Table 3. Filtered rate sequences using Quality Value and Degree of Confidence.
Threshold C1 C2 C3
Quality 5 84.17% 43.69% 61.80%
7 72.10% 20.49% 39.00%
10 63.00% 9.12% 27.51%
15 46.28% 1.64% 13.54
Probability 60.00% 80.52% 34.56% 52.08%
70.00% 74.38% 22.36% 41.76%
75.00% 70.93% 16.90% 36.63%
80.00% 67.43% 12.30% 31.93%
95.00% 47.49% 1.58% 13.98%
Table 4. Information on Match with Barcodes used in experiments after filtering.
Threshold C1 C2 C3
Quality 5 90.56% 2.06% 66.84%
7 96.36% 1.98% 82.46%
10 98.22% 1.86% 89.99%
15 99.29% 1.43% 95.75%
Probability 60.00% 93.25% 2.10% 74.77%
70.00% 95.91% 2.06% 81.87%
75.00% 96.99% 1.99% 85.32%
[image:10.595.207.538.581.744.2]DOI: 10.4236/ajmb.2018.81003 36 American Journal of Molecular Biology The results are consistent with the expected: there were no large differences between the filtering schemes. In both cases, the anomaly of C2 was proved, while C1 and C3 showed the expected behavior: when the threshold filtering in-creases, the match also increases.
6. Summary and Conclusion
Multiplex sequencing allows the analysis of many samples at the same time, re-ducing costs, and also becoming more useful to the analysis of related samples. Despite the advantages of this kind of sequencing, it requires a careful evaluation of the markers in order to assure that the readings will not be interchanged among the multiple samples sequenced. Given the importance of a high reliabil-ity in this kind of analysis, we present in this paper a probabilistic model suitable to evaluate the quality of multiplex sequencing runs performed on the SOLiD platform. Besides, we also propose a filtering strategy using the degree of confi-dence obtained from the proposed model.
The experimental results showed that the proposed model is suitable to assess multiplex sequencing. Moreover, the adoption of our filtering strategy has been proven more useful because it provides softer cutoff points. In summary, the main contributions of this work rely on what the model allows: 1) identification of faults in the sequencing process; 2) adaptation and development of new pro-tocols for sample preparation; 3) assignment of a degree of confidence to the da-ta generated; 4) and having potential to guide a filtering process that respects the characteristic of each sequencing, without discarding useful sequences in an ar-bitrary manner.
Acknowledgements
The authors would like to thank CNPQ and CAPES for supporting this research. The funders had no role in study design, data collection and analysis, decision to publish, or preparation of the manuscript. This study did not receive any sup-port or had any involvement with Life Technologies or Thermo Fisher Scientific companies.
References
[1] Ma, R., Gong, J. and Jiang, X. (2017) Novel Applications of Next-Generation Se-quencing in Breast Cancer Research. Genes & Diseases, 4, 149-153.
https://doi.org/10.1016/j.gendis.2017.07.003
[2] Mardis, E.R. (2013) Next-Generation Sequencing Platforms. Annual Review of Analytical Chemistry, 6, 287-303.
https://doi.org/10.1146/annurev-anchem-062012-092628
[3] Dopazo, J. (2014) Genomics and Transcriptomics in Drug Discovery. Drug Discov-ery Today, 19, 126-132. https://doi.org/10.1016/j.drudis.2013.06.003
DOI: 10.4236/ajmb.2018.81003 37 American Journal of Molecular Biology
https://doi.org/10.1016/j.critrevonc.2017.05.005
[5] David, M., Dzamba, M., Lister, D., Ilie, L. and Brudno, M. (2011) Shrimp2: Sensitive Yet Practical Short Read Mapping. Bioinformatics, 27, 1011-1012.
https://doi.org/10.1093/bioinformatics/btr046
[6] Li, H. and Homer, N. (2010) A Survey of Sequence Alignment Algorithms for Next-Generation Sequencing. Briefings in Bioinformatics, 11, 473-483.
https://doi.org/10.1093/bib/bbq015
[7] Applied Biosystem, SOLiD(TM) System Barcoding, Application Note (2008). [8] Applied Biosystem, SOLiD(TM) Fragment Library Barcoding Kit Module 1{16
Protocol, Tech. rep., Thermo Fisher Scientific Inc. (2010)
[9] Ambardar, S., Gupta, R., Trakroo, D., Lal, R. and Vakhlu, J. (2016) High Through-put Sequencing: An Overview of Sequencing Chemistry. Indian Journal of Microbi-ology, 56, 394-404. https://doi.org/10.1007/s12088-016-0606-4
[10] Parameswaran, P., Jalili, R., Tao, L., Shokralla, S., Gharizadeh, B., Ronaghi, M. and Fire, A.Z. (2007) A Pyrosequencing-Tailored Nucleotide Barcode Design Unveils Opportunities for Large-Scale Sample Multiplexing. Nucleic Acids Research, 35, e130. https://doi.org/10.1093/nar/gkm760
[11] Farrer, R.A., Henk, D.A., MacLean, D., Studholme, D.J. and Fisher, M.C. (2013) Using False Discovery Rates to Benchmark SNP-Callers in Next-Generation Se-quencing Projects. Scientific Reports, 3, 1512.
[12] Parker, D.J., Ritchie, M.G. and Kankare, M. (2016) Preparing for Winter: The Transcriptomic Response Associated with Different Day Lengths in Drosophila Montana. G3: Genes, Genomes, Genetics, 6, 1373-1381.
[13] Richardson, R., Mitchell, K., Hammond, N.L., Mollo, M.R., Kouwenhoven, E.N., Wyatt, N.D., Donaldson, I.J., Zeef, L., Burgis, T., Blance, R., van Heeringen, S.J., Stunnenberg, H.G., Zhou, H., Missero, C., Romano, R.A., Sinha, S., Dixon, M.J. and Dixon, J. (2017) p63 Exerts Spatio-Temporal Control of Palatal Epithelial Cell Fate to Prevent Cleft Palate. PLOS Genetics, 13, 1-24.
https://doi.org/10.1371/journal.pgen.1006828
[14] Sasson, A. and Michael, T.P. (2010) Filtering Error from SOLiD Output. Bioinfor-matics, 26, 849-850.https://doi.org/10.1093/bioinformatics/btq045
[15] Pearl, J. (1984) Heuristics: Intelligent Search Strategies for Computer Problem Solving. Addison-Wesley Longman Publishing Co., Inc., Boston.
[16] Russell, S.J. and Norvig, P. (2003) Artificial Intelligence: A Modern Approach. 2nd Edition, Pearson Education.
[17] Poinar, H.N., Schwarz, C., Qi, J., Shapiro, B., MacPhee, R.D.E., Buigues, B., Tikho-nov, A., Huson, D.H., Tomsho, L.P., Auch, A., Rampp, M., Miller, W. and Schuster, S.C. (2006) Metagenomics to Paleogenomics: Large-Scale Sequencing of Mammoth DNA. Science, 311, 392-394.https://doi.org/10.1126/science.1123360
[18] Longo, M.S., O’Neill, M.J. and O’Neill, R.J. (2011) Abundant Human DNA Conta-mination Identified in Non-Primate Genome Databases. PLoS ONE, 6, e16410. https://doi.org/10.1371/journal.pone.0016410
[19] Thakur, R.S., Bandopadhyay, R., Chaudhary, B. and Chatterjee, S. (2012) Now and Next-Generation Sequencing Techniques: Future of Sequence Analysis using Cloud Computing. Frontiers in Genetics, 3, 280.
DOI: 10.4236/ajmb.2018.81003 38 American Journal of Molecular Biology
[21] Zhao, S., Watrous, K., Zhang, C. and Zhang, B. (2017) Cloud Computing for Next-Generation Sequencing Data Analysis. In: Sen, J., Ed., Cloud Compu-ting-Architecture and Applications, InTech, Rijeka, Ch. 2, 29-51.
https://doi.org/10.5772/66732
[22] Amazon Web Services LLC, Amazon Elastic Compute Cloud (Amazon EC2) (2017).
http://aws.amazon.com/ec2/