0 INTRODUCTION
In an era of increasingly growing energy demands and concern regarding the massive consumption of fossil fuel to satisfy energy needs, any alternative energy source is indispensable. Moreover, the growing concern regarding climate change has brought several nations to a common consensus to pursue cutting the amount of greenhouse gas emissions, which demands an urgent reduction of fossil-fuel consumption as a significant energy source and promoting carbon
capture [1]. To balance those concerns, sustainable
and renewable energy sources are more critical in this period than at any time before. Since hydropower resources are the most accessible sources of renewable energy, small and micro-scale hydropower generations are undeniably essential to contributing a considerable portion to this effort. In addition, these hydro turbines undisputedly play a significant role in providing off-grid power generation to small-scale enterprises, hospitals, telecommunications facilities, residential
buildings and other public institutions located in remote areas and are more feasible particularly for developing and less developed countries. As studies by Kaunda et al. [2] and Paish [3] show, however, the benefits of the application of these kinds of turbines are not limited to developing and less-developed countries only but to some extent also for developed countries. Off-grid power generation contributes to the effort of reducing power loss in the power transmission process, most importantly, for scattered power distribution systems in rural areas. Moreover, unlike large-scale hydropower generators, small scale turbines generate power without significant impact on the ecosystem [3].
A micro-scale turbine type called a cross-flow turbine, also known as Michell-Banki’s turbine, is economically efficient and simple design compared to other conventional micro-turbines. Fig. 1 illustrates such a turbine called the International Assistance
Mission (IAM) [4]. Apart from its simplicity, this
Numerical Simulation-Based Effect Characterization
and Design Optimization of a Micro Cross-Flow Turbine
Woldemariam, E.T. – Lemu, H. G.
Endashaw T. Woldemariam – Hirpa G. Lemu*
University of Stavanger, Faculty of Science and Technology, Norway
In this era of high power demand along with a need for sustainability, small and micro-scale hydro turbines are indispensable, especially for off-grid power generation. These hydro-turbines are more appealing, particularly for small-scale enterprises, hospitals, telecommunication facilities, residential buildings, and other public institutions located in remote areas that have rich hydropower potential. Due to their simple design, manufacturability, and maintainability, micro cross-flow turbines are more feasible and applicable for power generation in undeveloped and developing countries with scattered hydropower resources. Such hydropower generation is environmentally friendly as their construction and operations have no significant effect on the surrounding ecosystem. To extract the highest possible power, however, the power generation efficiency of cross-flow turbines are is yet well optimized. In this paper, a numerical-based investigation on 3D numerical models and a design optimization study that is aimed at improving the turbine’s performance has been studied and reported. A numerical simulation-based metamodel assisting optimization approach is deployed to carry out the optimization after the characterization of the design parameters, following a previous experimental study on a similar model. The benefits of the approach with regard to computational costs and outcome of the optimization are discussed. Responses from the optimized design are compared against the original design responses at different magnitudes of design parameters. Published experimental test results based on similar conditions are used to verify the models at each stage. The approach is found effective, and the optimized model shows better performance and efficiency than the original models at similar working condition.
Keywords: crossflow turbine, micro hydro turbine, numerical simulation, metamodel based optimization
Highlights
• A numerical simulation based investigation of a 3D model of a micro cross-flow turbine is conducted. • A metamodel-assisted optimization approach is deployed to carry out the design optimization.
• The benefits of the numerical simulation approach in terms of computational costs and the outcome of the optimization are discussed.
• The response of the optimized design is compared with the original design responses at different magnitudes of design parameters.
turbine type incurs relatively low manufacturing, operation, and maintenance costs [5].
Fig. 1. IAM turbine assembly drawing adopted from [4]; a) 3D isometric view, and b) sectional view with the adjusting part
Moreover, its favourable run-of-the-river application and the power generation efficiency at part load conditions attract more research interest. Despite all those benefits over other conventional hydro turbines, however, the power-generating performance and efficiency of the turbine are not yet well optimized. In efficiency research on cross-flow turbines, experimental works dominate earlier studies while recent works mostly adopted numerical methods. This is partly due to the powerful and reliable computational tools and partly due to the accompanying high costs of experimental works. To improve the efficiency, for
instance, Olgun [6] conducted an experimental study
on effect of geometric parameters of the nozzle and the runner such as diameter ratios, throat-width ratios and gate-opening size on the efficiency and reported that micro cross-flow turbines can be operated with a wider range of gate opening compared with other turbines having maximum efficiency. Acharya et
el. [7] conducted numerical research involving the
modification of nozzle radius, varying the guide vane
angle, and changing the number of runner blades. From this study, it has been observed that the highest efficiency of 76.6 % was obtained with 22 blades.
Similarly, Choi et al. [8] studied the efficiency and flow characteristics numerically by varying the shape of the nozzle and the runner blade. However, most of the reported theoretical studies [9] to [11]
and experimental investigations [12] and [13] show
massive inconsistency in the results of their efficiency computation. Most theoretical research reports, for instance, in [11], [14], and [15], show that the contribution from the second stage ranges from 18 % to 30 % of the total power generated. An overview of achieved efficiencies by different researchers in [16]
show variations from 66 % to 88 %.
In cross-flow turbines, the water jet from a penstock initially passes through a nozzle, which is controlled by a valve. Once the jet exits the nozzle, it then strikes the rotor blades from the outer and inner periphery for first and second stage power generation, respectively. More details on operating principles of cross-flow turbines and the detail description of the main parts are discussed in a previous related work by the authors [17].
The main objective of this paper is to instigate a numerical simulation-based approach to the study of the effects of selected design parameters on the optimized performance, and thus improved the output of the turbine utilizing the parameters. It aims to obtain a turbine with better performance, and thus with better hydraulic efficiency.
Following this introduction section, a brief discussion of the methodology and the approaches employed are presented. Sections 2 and 3 are devoted to the theoretical power computation and numerical models, the chosen governing numerical models and their validation through sensitivity analyses. In Section 4, the optimization approach and brief comparison with other tools are discussed, followed by a discussion of the results in Section 5. Finally, conclusions are drawn in the last section.
1 METHODOLOGIES AND APPROACHES
selected micro cross-flow turbine model. In a previous
related work [17], a similar approach was discussed
but with limited study on a 2D numerical model whose results have been published. This extended version of the work focuses on the 3D model analysis of the turbine for numerical model verification and comparison of the performance against the original model using time-dependent (transient) analyses. The numerical models and computational tools are
verified using experimental test results in [4]. The
thesis reported in [4] aims to study the fluid flow
characteristics and measurements of the relative moment using a laboratory setup that enables collecting relative load responses on the rotor blade design (Fig. 1). The experimental test was carried out at different head and rotational speeds of the rotor. Our numerical simulation based study, however, focuses on a 5-meter net fluid head input at rotational speeds of 250 and 350 revolutions per minute [rpm] because stable experimental test results are obtained in these range of load conditions.
Table 1. Original turbine geometric parameter values
Parameter Description Value [unit] R Outer radius of the rotor 13.5 cm r Inner radius of the rotor 9.366 cm rc Entry arc curvature 15.3 cm β1 Blade angle at rotor outer circle 30 degrees β2 Blade angle at rotor inner circle 90 degrees rs Rotor shaft radius 2.25 cm b Depth (width) of the turbine 20.4 cm N Number of blades 24
A detailed description of the deployed numerical simulation-based metamodel-assisted optimization (NSBMAO) approach and the alleviated number of function evaluation reports are introduced in Section
4. A commercial ANSYS workbench tool [18] was
interfaced with the optimization tool, which served for modelling and computational fluid dynamics (CFD) simulation in both the 2D and 3D analyses. The single objective global optimization (SOGO) algorithm of the metamodel assisted optimization tool, from Optimization Assisted System Integrated
Software (OASIS) tool [19], which is designed for
computationally expensive black box problems
[20], is deployed to perform the optimization. In
the investigations, parameters assumed appealing for the turbine performance improvement from previous studies are considered (Table 1). Two of the parameters, i.e. valve angle and the entry wall arc, are assumed to have a significant impact on the 1st stage
power generation, while the rotor shaft diameter has an impact mainly at the 2nd stage.
2 THEORETICAL POWER COMPUTATION IN CROSS-FLOW TURBINES
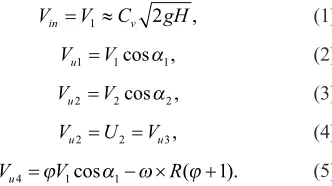
Due to the turbine’s configuration and power transfer characteristic condition inside the turbine, crossflow turbines are mostly assumed to be impulse turbines. The theoretical power conversion computation, therefore, is carried out through fluid velocity differences at the rotor’s entry and exit blades using Euler’s turbomachinery equations. From the given hydraulic head subject to the turbine inlet, Eq. (1), the theoretical power computation, therefore, uses the theoretical fluid jet velocities at four points, two at the first stage, and two at the second stage (Eqs. (2) to (5)).
Vin=V C1 ≈ v 2gH, (1) Vu1=V1cosα1, (2)
Vu2 =V2cosα2, (3)
Vu2 =U2=Vu3, (4)
Vu4 =ϕV1cosα ω1− ×R(ϕ+1). (5)
The theoretical torque and power calculations then follow Euler’s turbomachinery equations (Eqs. (6) to (9)).
F=ρQ dv
∫
=ρQ V V−2 1
1 2
( ), (6)
T F R= × =ρQ V V R( 1− 2) , (7)
Pout = ×ω,T (8)
Pin=Q P( r in_ −Pr out_ ) /ρ, (9) where Pr_in and Pr_out are the pressure at the inlet due
to the head of the water and at the outlet of the turbine model, respectively.
Fig. 2a shows the peripheral velocities tangent to the outer and inner diameters, ui (i = 1 to 2), the
actual fluid velocities, vj (j = 1 to 4) and the relative
velocities, wk (k = 1 to 4), corresponding to points 1
are utilized (Fig. 4). One section of the turbine, which is one third of the actual depth of the design, is used considering symmetry in that direction and that it could represent the problem well. Each domain of the models is divided into three zones: (1) housing, (2) rotor, and (3) stationary. The interfacing surfaces between the zones are recognized and coupled automatically in the simulation tool while generating the grid to smoothly transfer results between the moving and other zones at the interfaces. The turbulent Navier Stokes equation (Eq. (10)) is simplified in different viscous models and tested for sensitivity analysis [18].
∂
∂ + ∇ ⋅ =
∂
∂ + ∇ ⋅ = −∇ + ∇ ⋅ + ∇ ⋅ −
=
ρ ρ
ρ ρ ρ τ ρ
τ µ
t V S
t V VV P v v
m
T i iT
( ) ,
( ) ( ) ( ) ( ),
((∇ + ∇ )− ∇ ⋅ ,
V VT 2 VI
3
(10)
where Smis the source term and τ is the stress tensor
given in Eq. (10), the term −ρv vi iT is the Reynolds stresses term, V is the velocity vector representing the sum of the average and the fluctuating components (i.e., V V v= + i), μ and I are the molecular viscosity of the fluid and the unit tensor respectively.
3.1 3D Numerical Model Grid Validation
The grid qualities of all numerical models both in the transient and steady-state analyses are controlled so that the parameters that ensure the quality fall in the acceptable range so as to obtain realistic results. Some of the important parameters considered to ensure the grid qualities are orthogonal skewness, aspect ratio and orthogonal quality of the elements in the grid domain. Table 2 shows the details of the grid node and element sizes of one of the models after the
a)
b)
Fig. 2. Fluid velocity components: a) velocity positions at the rotor, and b) velocity triangles at each points
and exit of the rotor blades. In the theoretical power calculations, some studies use the entry arc curvature angle, for instance in [21], but others use the nozzle valve angle [22] as an attack angle (location illustrated in Fig. 3 of the fluid at the entry.
3 MODEL VALIDATION & SENSETIVITY ANALYSIS
To obtain realistic responses from the numerical simulation, it is essential to validate the model grid, the numerical turbulence model, and the algorithms employed to study both the steady-state and transient analysis and the CFD simulation-based optimisation. For the analyses, 3D numerical models with one-to-one scale as the IAM turbine design, except the depth,
quality validation that is utilized in the 3D numerical analysis. The model grid qualities are also validated while comparing the trends of the numerical moment coefficient responses from one of the rotor blade’s front wall against the relative moment signal from experimental test results of the sensitivity analysis in the following section. The voltage signals from the experimental tests are collected from a mechanical strain gage carefully attached to one of the front walls of the rotor’s blade.
Table 2. Mesh measurements and qualities of the 80 % opened model
Housing Rotor Stationary Total Nodes 633368 1967512 320251 2921131 Elements 594920 1620087 307160 2522167
Responses are collected from the gage while the model is subject to a five-metre water head, and the rotor is controlled at 350 rpm [4]. The numerical moment coefficient responses on the front face of a selected blade are collected at each time step from the
transient numerical simulation. The post-processing tool of the research version solver tool used, ANSYS Fluent, computes the moment coefficients after solving the turbulent Navier Stokes equation. The moment coefficient computations use the moment response and the reference values set in the tool.
The total numerical moment response, Eq. (11), is the combined effect of both the pressure force and viscous force, Eq. (12), from the transient numerical simulation analysis result on one of the rotor’s blade’s wall.
M r F= × p+ ×r Fv
, (11)
F P P Anref
i n
= −
=
∑
( ) ,1
(12)
where M is the total moment in [N·m] due to the
pressure and viscous forces, Fp and Fv
respectively. Both forces are computed based on Eq. (10). r is the moment arm from the moment centre of the wall to the rotational axis of the rotor. P and Pref are the total
and the reference pressures computed, respectively. A
and n are the area and the normal vector to the surface.
Moreover, to compute the hydraulic efficiency
(η) of the turbine model from numerical analysis,
the output hydraulic power computed from the total moment response and the rotational speed subject on the rotor. While the input power is computed from the hydraulic input head, the numerical flow rate is computed at the inlet of the turbine (Eq. (13)).
η ω
ρ
= ⋅
− M
Q P( r in_ Pr out_ ) / , (13)
where ω is the rotational speed [rad/s], Q is the mass flow rate; and ρ is the fluid density.
The noisy data collected from the transient analysis per time step at different inputs and boundary conditions are carefully filtered to obtain a smooth average graph without losing the property of the data. After various trials in the MATLAB tool, a cut-off frequency of 80 Hz with 850 Hz data sample frequency with Lowpass Filter gave us a smooth curve that better retain the characteristics of the original data (Fig. 5). Note that all graphs in the paper are generated using the MATLAB programming tool.
3.2 Sensitivity Analysis of Numerical Models for Computational Analysis
To make the sensitivity analysis and investigate the model that better represents the turbulent flow problem inside the turbine, three different well-known viscous models have been tested in the numerical computation:
1. standard k–epsilon (k – ɛ) with scalable wall
functions for near wall treatment,
2. k–omega (k – ω) with a shear flow correction
k–omega option, and
3. large eddy simulation (LES) with WALE
sub-grid-scale model for high turbulence test purposes. In all the three model tests, the same solution algorithms are employed to solve the pressure-velocity coupling, and the momentum and turbulent kinetic energy in the spatial discretization. The sensitivity test is carried out comparing the trends of the moment coefficient responses from each numerical model against the relative moment signal from the experimental test result on a similar model design at the same valve opening, net inlet fluid head, and rotational speed.
Based on the gradient diffusion hypothesis, the k – ɛ model relates the Reynolds stresses to the
mean velocity gradients and the turbulent viscosity in solving the kinetic energy and the turbulent dissipation. This model is found to be robust, computationally cheap and widely used even though it performs poorly for complex flows that involve a strong streamline curvature, severe pressure gradient, and separation. In contrast, the k – ω model allows for
better near-wall treatment and performs well in low Reynolds number flows, but it requires intense mesh resolution near walls [23] and [24]. Unlike the other two models, the LES model better allows explicitly solving large eddies and accounts for the selected small eddies using the sub-grid-scale model. It is more popular in simulating highly turbulent flows but gives only a fair enough solution near walls [25].
Fig. 5. Curves from original unfiltered data and filtered data on 80 % opened valve model at 350 rpm
Fig. 6. Moment coefficient responses’ graph from three viscous models vs. experimental test moment signal from strain gages
on a blade face
As observed in Fig. 6, the relative moment
test signal from experimental test results [4] and
the numerical responses show a good agreement
with regard to showing the 1st and 2nd stage power
expected to match with the experimental test as the experimental study signal is not calibrated to give the moment response, hence the objective was to study the relative load at the two stages. However, the setup and the result were later calibrated to obtain the total torque on the rotor, as reported in [26]. In both the transient simulation and the experimental test results, the first stage of power generation has shown a better output than the second stage power output did, as was
expected. Since the result from the k-ɛ model shows a
better stable response cycle in both stages compared to the other models (Fig. 6), it is chosen to better represent the problem for further analyses.
3.3 Sensitivity Analysis of Numerical Solution Methods
In this section, two of the widely used solution schemes in CFD, the SIMPLE and the PISO algorithms, are tested. Both algorithms are fundamentally used to drive a pressure correction equation in the Pressure-Velocity Coupling scheme in solving the turbulent
Navier-Stokes equation [27]. The fundamental
difference between them is that PISO uses the velocity correction from adjacent cells while solving the continuity equation, whereas SIMPLE does not. Thus, SIMPLE leads to a simpler solution procedure that directly uses the pressure correction terms to the velocity correction. Even though the standard SIMPLE algorithm is initially developed for steady analysis, it can provide a realistic solution with smaller time step size in the time discretization. Thus, in both cases, a relatively smaller time step size of 0.001 is used in the transient analyses, as a compromise between the computational cost and accuracy. Second-order upwind methods are employed to solve the momentum, turbulent kinetic energy models and specific dissipation rate in the spatial discretization. Both time-discretized PISO and SIMPLE algorithms
gave stable moment coefficient’s response cycle and
showed a good agreement with experimental test [4]
with respect to relative 1st and 2nd stage cycles (Fig.
7). However, the result from the later converged faster than the former without showing a significant difference in the moment coefficient response. Thus, it is used in both the transient and steady-state analyses of the hydraulic efficiency computation.
4 ALGORITHM EMPLOYED IN THE OPTIMIZATION
In most simulation-based global optimization problems where the objective function is a result of an expensive implicit modelling and analysis tool or black-box function, applying standard optimization tools is computationally expensive and requires extensive tool-interfacing effort. Intelligent algorithms and optimization techniques are, however, being developed and employed to reduce the costs without significantly reducing the accuracy of the outcome. Thus, metamodel-assisted optimization approaches contribute significantly in this regard.
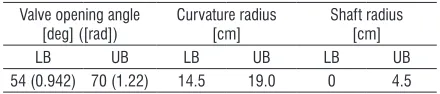
In our numerical simulation-based optimization approach, the objective function returns the average weighted total moment on the rotor walls about the Z-axis passing through the shaft centre from the implicit analysis tool (Workbench 17.1). The selected design variables and objective functions are parametrized prior to the simulation in the design modeller and ANSYS Fluent. Moreover, the design space bounds, the lower bounds (LB) and upper bounds (UB), of each of the three selected design variable are given in Table 3. The bounds are given considering the actual turbine design geometry and their validity on the numerical model.
Table 3. Lower and Upper bounds of parameters Valve opening angle
[deg] ([rad])
Curvature radius [cm]
Shaft radius [cm]
LB UB LB UB LB UB
54 (0.942) 70 (1.22) 14.5 19.0 0 4.5
The problem is formulated in a simple form as in Eq. (14). To carry out the optimization, a 2D model is utilized, aiming to further reduce the computational cost. Note that the 2D model is validated using the mesh quality control and response trends before applying the optimization.
A metamodel-assisted design optimization (MADO) approach was employed to interface with the 2D numerical model using the OASIS optimization tool, which was developed mainly to
solve computationally intensive numerical problems. From the different MADO strategies discussed in [28], this tool employs a direct sampling approach. In this approach, the metamodel is used to generate samples toward the optimum value while the metamodel is adaptively updated using each function evaluation results obtained from the black-box function. The most important benefit of the approach is that it is less dependent on the accuracy of the metamodel. The entire NSBMADO framework is shown in Fig. 8.
Fig. 8. An adaptive direct sampling meta-model based design optimization framework using OASIS tool
For this particular problem, the Single Objective Global Optimization (SOGO) algorithm is employed to solve the numerical simulation-based design optimization problem.
Minimize
Constraints
F x g x x x xL U
( ),
( ) ,
, ,
≤
∈
[
]
0 (14)
where the F(x) is the objective function that returns the total moment on the rotor walls including the shaft wall from the simulation tool as a function of g(x),
where x = [α, ra, rs], is the constraint function and XL
and XU are the lower and upper bounds of the design
variables in the variable vector X.
The optimization was run with a stopping criterion set to 80 function evaluations, which is selected based on the authors’ experience on the tool after carrying out optimizations on similar models. Note that since the tool searches minimum values, the output response should be adjusted to give a negative response.
5 RESULTS AND DISCUSSION
5.1 Optimization Results
After establishing a clear interface between the MADO and the simulation tool, the optimization elapsed a total of 18 hours and 55 minutes with an average single function evaluation time of around 14 minutes. The total overhead time of the optimization tool is 2 minutes and 47 seconds. In a simple calculation deploying a regular Genetic Algorithm, the tool would take around 116 hours for 1000 iteration analyses on the same model with a simulation that takes 14 minutes on a similar machine assuming the problem converges at 500 iterations.
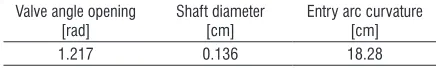
The convergence history of the NSBMADO optimization process per number of function evaluation is given in Fig. 9. The corresponding results of the design parameters of the optimized model are also given in Table 4. Note that the shaft size shows the stepped size of the shaft passing through the rotor, some designs have shafts to support at the sides only attached to the side plates.
Fig. 9. Optimum moment’s convergence history from OASIS per number of function evaluation
Table 4. Values of optimized model parameters Valve angle opening
[rad]
Shaft diameter [cm]
Entry arc curvature [cm] 1.217 0.136 18.28
5.2 Comparative Analysis with Optimization Results
optimum model gives better performance especially at most time steps for 250 rpm rotor speed (Figs. 10 and 11).
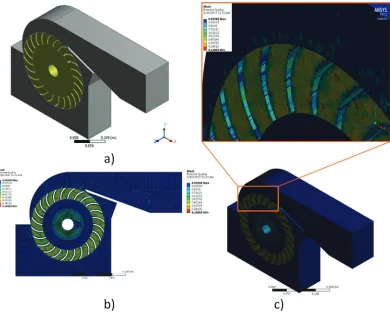
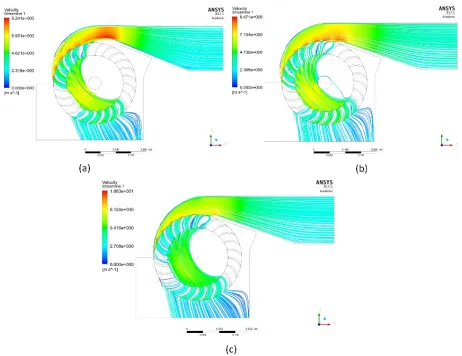
The velocity streamline contour diagrams in Figs. 12 and 13, particularly at 100 % opened the valve, also could give a visual understanding of how the shaft
Fig. 12. Velocity streamlines inside the turbines body at 350 rpm at: a) 80 % valve opening, b) 100 % opening, and c) optimized model
Fig. 10. Entire rotor’s moment response comparison of the optimized, 80 % and 100 % valve opening model at 350 rpm
rotation of the rotor
Fig. 11. Entire rotor’s torque response comparison of the optimized, 80 % and 100 % valve opening model at 250 rpm
Fig. 13. Velocity streamlines inside the turbines body at 250 rpm at: a) 80 % valve opening, b) 100 % opening, and c) optimized model
Table 5. Numerical steady state analysis response values and hydraulic efficiencies at 350 rpm
No. Nozzle opening Pressure at outlet [N·m] Mass flow rate [kg/s] Moment response [N·m] Numerical efficiency [%] 1 80 % 1541.67 37.76 21.831 (31.78 coeff) 44.60 2 100 % 1998.33 47.91 39.02 (63.70 coeff) 60.85 3 Optimized model 2112.34 44.93 37.16 (60.70 coeff) 61.80
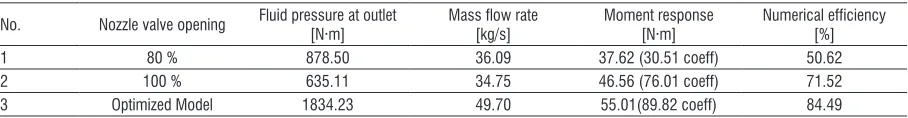
Table 6. Numerical steady state analysis response values and hydraulic efficiencies at 250 rpm
No. Nozzle valve opening Fluid pressure at outlet [N·m] Mass flow rate [kg/s] Moment response [N·m] Numerical efficiency [%]
1 80 % 878.50 36.09 37.62 (30.51 coeff) 50.62 2 100 % 635.11 34.75 46.56 (76.01 coeff) 71.52 3 Optimized Model 1834.23 49.70 55.01(89.82 coeff) 84.49
at the centre of the rotor could obstruct a significant portion of the fluid passing through the second stage power generation. This obscuring of the shaft would also produce a disturbance on the streamlines of the neighbouring fluids, which would result in more loss on the hydraulic power due to turbulence. Thus, design optimization is required.
maximum numerical hydraulic efficiency at 100 % valve opening in both cases. It is discussed in the
results from the experimental test in [4] that the
maximum efficiency was obtained from the 80 % opening at 350 rpm.
Moreover, using the average pick values from the transient graphs for a rough estimation of the relative loads, the second stage contributes 23.42 % to 25.89 % of the total power in both cases. However, results from the experiment shown in the range from 36.4 % to 53.7 %. The later shows a massive deviation from most of the theoretical study reports on this kind of microturbine, which ranges from 26 % to 30 % only.
6 CONCLUSION
The numerical simulation based study reported in this article turns out to be effective and appealing for further study on similar turbomachinery. The separate simulation studies, both the transient and steady state, on the numerical models at different parametric values returned valid and sound results. Thus, the investigation significantly attributed in the relative load trend studies on the blades’ front wall and the characterization of the flow inside the turbine. It is observed that the entry arc curvature and the nozzle opening angle played a significant role in determining the attack angle of the flow stream at the entry to the first stage. It is also observed, from the velocity streamline diagrams, in three out of four cases, that the shaft diameter obstructed the fluid flow heading to the second stage therewith increasing the turbulence, which results in a relatively lower percentage power contribution from the stage. Thus, the optimization returned a highly reduced shaft size.
The optimized design outperformed the original model at different rotational speeds and valve openings including the 80 % opening at which the experimental test result, utilized for the model validation in the text, observed to have the maximum efficiency. As a result, the overall output power and efficiency are improved with the optimized model. Meanwhile, it is studied that the percentage power generated from the second stage fall close to the range other researchers reported through theoretical analysis unlike the experimental test, whose report showed a huge deviation. Using the optimized model, the efficiency is improved by 17.88 % compared to the maximum efficiency obtained from the original model at 250 rpm. Moreover, the adaptive direct sampling metamodel assisted optimization tool deployed, unlike any other global optimization tools, highly
reduced computational cost that would otherwise be incurred. The numerical simulation based analysis and optimization approach could thus be employed for further studies on the same and similar turbomachinery applications. The optimization tool, in particular, is appealing for high dimensional numerical simulation-based optimization problems.
7 NOMECLATURE
H head of entering fluid at the inlet, [m]
ρ density of the fluid, [kg/m3]
Cv constant coefficient to account loss
in the nozzle
g gravitational acceleration, [m/s2]
Vu1, Vu2, Vu3 and Vu4
peripheral velocity components at point 1, 2, 3 and 4 respectively of the rotor, [m/s]
ω the rotational velocity of the rotor
ϕ constant empirical coefficient that accounts
loss inside rotor blade
R, r outer and inner radiuses of rotor, [m]
Q volume flow rate of fluid inside the turbine,
[m3/s]
F force on blades respectively due to hydraulic
power, [N]
T torques on blades respectively due to
hydraulic power, [N·m]
Pin, Pout input and output theoretical hydraulic powers
respectively, [kW]
α, β actual and relative velocities angles from the tangents to the periphery
8 REFERENCES
[1] UNFCCC (2014). The Paris Agreement. United Nations Framework Convention on Climate Change, from http:// unfccc.int/paris_agreement/items/9444.php, accessed on 2018-11-15.
[2] Kaunda, C.S., Kimambo, C.Z., Nielsen, T.K. (2012). Potential of small-scale hydropower for electricity generation in Sub-Saharan Africa. ISRN Renewable Energy, vol. 2012, art ID 132606, DOI:10.5402/2012/132606.
[3] Paish, O. (2002). Small hydro power: technology and current status. Renewable and Sustainable Energy Reviews, vol. 6, no. 6, p. 537-556, DOI:10.1016/S1364-0321(02)00006-0.
[4] Walseth E.C. (2009). Investigation of the Flow through the Runner of a Cross-Flow Turbine. MSc Thesis, Norwegian University of Science and Technology, Trondheim.
[5] Anagnostopoulos J.S., Papantonis D.E. (2007). Optimal sizing of a run-of-river small hydropower plant. Energy Conversion and Management. vol. 48, no. 10, p. 2663-2670,
[6] Olgun, H. (1998). Investigation of the performance of a cross-flow turbine. International Journal of Energy Resources, vol. 22, no. 11, p. 953-964, DOI:10.1002/(SICI)1099-114X(199809)22:11<953::AID-ER418>3.0.CO;2-1.
[7] Acharya, N.l., Kim, C.-G., Thapa, B., Lee, Y.-H. (2015). Numerical analysis and performance enhancement of a cross-flow hydro turbine. Renewable Energy, vol. 80, p. 819–826,
DOI:10.1016/j.renene.2015.01.064.
[8] Choi, Y.-D., Lim, J.-I., Kim, Y.-T., Lee, Y.-H. (2008). Performance and internal flow characteristics of a cross-flow hydro turbine by the shapes of nozzle and runner blade. Journal of Fluid Sciences and Technology, vol. 3, no. 3, p. 398-409,
DOI:10.1299/jfst.3.398.
[9] Durgin, W., Fay, W. (1984). Some fluid flow characteristics of a cross-flow type hydraulic turbine. Small Hydro Power Fluid Machinery: The Winter Annual Meeting of ASME, New Orleans, p. 77-83.
[10] Khosrowpanah, S., Fiuzat A.A., Albertson, M.L. (1988). Experimental study of cross-flow turbine. Journal of Hydraulic Engineering, vol. 114, no. 3, p. 299-314, DOI:10.1061/ (asce)0733-9429(1988)114:3(299).
[11] Andrade, J.D., Curiel, C., Kenyery, F., Aguillón, O., Vásquez, A., Asuaje, M. (2011). Numerical investigation of the internal flow in a Banki Turbine. International Journal of Rotating Machinery, vol. 2011, Art. ID 841214, DOI:10.1155/2011/841214.
[12] Aziz, N.M., Desai, V.R. (1991). An experimental study of the effect of some design parameters on cross-flow turbine efficiency. Engineering Report, Department of Civil Engineering, Clemson University, Clemons.
[13] Fiuzat, A.A., Akerkar, B. (1989). The use of interior guide tube in cross flow turbines. Waterpower. ASCE, p. 1111-1119.
[14] Balje, O. (1981). Turbomachines- A Guide to Design, Selection, and Theory. John Wiley & Sons, New York.
[15] Korpela, S.A. (2011). Principles of Turbomachinery. Wiley, Hoboken.
[16] Kaunda, C.S., Kimambo, C.Z., Nielsen, T.K. (2014). A numerical investigation of flow profile and performance of a low cost crossflow turbine. International Journal of Energy and Environment, vol. 5, no. 3, p. 275-296.
[17] Woldemariam, E.T., Lemu, H.G., Wang, G.G. (2017). Geometric parameters’ effect characterization and design optimization of a micro scale cross-flow turbine for an improved performance.
Proceedings of the International Offshore and Polar Engineering Conference, San Francisco.
[18] ANSYS Fluent user’s Guide. (2011). from
http://148.204.81.206/Ansys/readme.html, accessed on 2018-11-30.
[19] Empower Operation C (2016). Integrate and Optimize. Empower Operation Corp. from: http://empoweroperations. com/en/oasis/ accessed on 2018-11-30.
[20] Cheng, G.H., Younis, A., Hajikolaei, K.H., Wang, G.G. (2015). Trust region based mode pursuing sampling method for global optimization of high dimensional design problems.
Journal of Mechanical Design, vol. 137, no. 2, p. 021407,
DOI:10.1115/1.4029219.
[21] Sammartano, V., Aricò, C., Carravetta, A., Fecarotta, O., Tucciarelli, T. (2013). Banki-Michell optimal design by computational fluid dynamics testing and hydrodynamic analysis. Energies, vol. 6, no. 5, p. 2362-2385, DOI:10.3390/ en6052362.
[22] Sammartano, V., Filianoti, P., Morreale, G., Sinagra, M., Tucciarelli, T. (2016.) Banki-Michell micro-turbines for energy production in water distribution networks. Proceedings of the 4th European IAHR Conference, Liedge, DOI:10.1201/b21902-159.
[23] Menter, F.R. (1992). Performance of popular turbulence models for attached and separated adverse pressure gradient flows. AIAA Journal, vol. 30, no. 8, p. 2066-2072,
DOI:10.2514/3.11180.
[24] Menter, F.R. (1994). Two-equation eddy-viscosity turbulence models for engineering applications. AIAA Journal, vol. 32, no. 8, p. 1598-1605, DOI:10.2514/3.12149.
[25] Kaunda, C.S. (2015). Crossflow Turbine in Micro Hydropower Technology: Design and Performance Characterization with Respect to Internal Flow Profile. University of Dar es Salaam, Dar es Salaam, DOI:10.5406/ illinois/9780252038792.003.0003.
[26] Argyropoulos, C.D., Markatos, N.C. (2015). Recent advances on the numerical modelling of turbulent flows. Applied Mathematical Modelling, vol. 39, no. 2, p. 693-732,
DOI:10.1016/j.apm.2014.07.001.
[27] Patankar, S.V., Spalding, D.B. (1983). A calculation procedure for heat, mass and momentum transfer in three-dimensional parabolic flows. Numerical Prediction of Flow, Heat Transfer, Turbulence and Combustion, p. 54-73. DOI:10.1016/B978-0-08-030937-8.50013-1.
[28] Wang, G.G., Shan, S. (2007). Review of metamodeling techniques in support of engineering design optimization.
Journal of Mechanical Design, vol. 129, no. 4, p. 370-380,
![Fig. 1. IAM turbine assembly drawing adopted from [4]; a) 3D isometric view, and b) sectional view with the adjusting part](https://thumb-us.123doks.com/thumbv2/123dok_us/8948072.1857440/2.598.90.284.119.425/fig-turbine-assembly-drawing-adopted-isometric-sectional-adjusting.webp)