Online at http://jdesert.ut.ac.ir
DESERT 17 (2013) 129-135
Relationship between Soil Characteristics and Vegetation Types
in Damghan
M. Jafari
a, M. Biniaz
b, E. Janfaza
*c, M.J. Nematolahi
d, M. Karimpour Reyhan
ea
Professor, Faculty of Natural Resources, University of Tehran , Karaj, Iran
b
Instructor, Hormozgan University, Bandar Abbas, Iran
c
MSc Graduate, Faculty of Natural Resources, University of Tehran , Karaj, Iran
d
Instructor, Shiraz University, Shiraz, Iran
e
Associate Professor, International Desert Research Center, University of Tehran, Tehran, Iran
Received: 22 April 2008; Received in revised form: 27 April 2009; Accepted: 10 November 2009
Abstract
Relationships between soil factors and vegetation types in playa of Damghan was investigated. Six vegetation types including Artemisia.sieberi, Arundo. sp, Artemisia.sieberi-Peganum.harmala, Alhagi.cammelerom,
Artemisia.sieberi-petropyron.sp, Tamarix.passerinoides-Halocnemum strobilaceum. One bare land was recognized in the study area and the research was conducted within mentioned types. Canopy percentage of plant in different types was estimated based on randomized-systematic sampling method, within 1 m2 quadrats. Along four transects 300 m each, 15 m2 quadrats established for estimating cover percentage in each type. Soil sampling was performed from 0-15 and 0-15-50 Depths at the starting and end points of transect. Measured soil factors included EC, pH, texture, Ca2+, Na+, Mg2+, Co32-, HCO3
-, Cl-, CaSO4, CaCO3. In order to find the relationship between soil factors and vegetation
properties, multivariate analysis was used. The results showed that separation of understudy types was mainly related to soil characteristic including texture, Ec, Na+, Mg2+, Cl-.
Keywords: Multivariate analysis; Iran; factor; Semnan; Quadrat; Axis; Ordination
1. Introduction
The investigating the relationship between different plants with biotic and abiotic component, which are in an ecosystem, is usually a part of the ecological studies. The results of these studie help to improve our knowledge of each plant community by environmental factors such soil, topography and climate. In fact, this factors cause the establishing of the different kind of plant species in different habitats (Jafari et al., 2003) Without an exhaustive understanding of saline land ecosystems, we cannot have a logical and correct use of these areas. Every kind of changes in the existent components of a natural ecosystem, especially plants and soil, finally
Corresponding author. Tel.: +98 917 8270028, Fax: +98 26 32227765.
E-mail address: [email protected]
In the arid regions of the middle East, Jafari et al. (2003), Heshmati (2003), Hillel and Tadmor (1962), Kassas and Girgis (1965), olsvig-whittaker et al. (1983), stahr et al (1985) and AbdEl-Ghani (1997; 1998, 2000) worked in this direction. These investigations include large areas and therefore they reported striking gradients referring to soil conditions and vegetations. Different studies have revealed that although competition influences the growth and distribution of the plants, but soil characteristics are of high importance in distribution of salt land plants.
Several studies have provided qualitative assessments of the distribution of plant species and associations in relation to physiographic factors in different areas of the world (Moustafa and Zaghloul, 1996; Jafari et al., 2003; Danin, 1983; Batanouny, 1985; Migahid et al., 1959; Abd oEl-Ghani (1998, 1999, 2000), Heshmati, 2003; shaltout et al., 1995 and springule et al., 1997). The approach in some this study (Danin, 1983; Batanouny, 1985) was to provide subjective description of ecological conditions based on the field experience and interpretation of the author. Modern synecological research has preferred a more subjective methodology for use at the local and sometimes regional scale, seeking to reduce the complexity of a field data set either by classification and/or ordination of floristic data and then relating results to environmental data, or by deriving vegetation- habitat relationships from a single analysis of a combined floristic and environmental variable
set (Ter Braak, 1987 c). These more objective approaches include some the mentioned above studies, e.g. springuel et al. 1997; Moustafa and Zaghloul; 1996 and Jafari et al., 2003. The main purpose of this research was to investigate the relationship between soil characteristics with plant species to determine the most important factors affecting the separation of vegetation types. Second aim was to identify the soil characteristics that are indicator of specific species. By knowing the relationship between soil and vegetation of a given area, it will be possible to apply these results for other similar regions and recommend the suitable guidance for management, reclamation and utilization of saline lands.
2. Materials and Methods
2.1. Study area
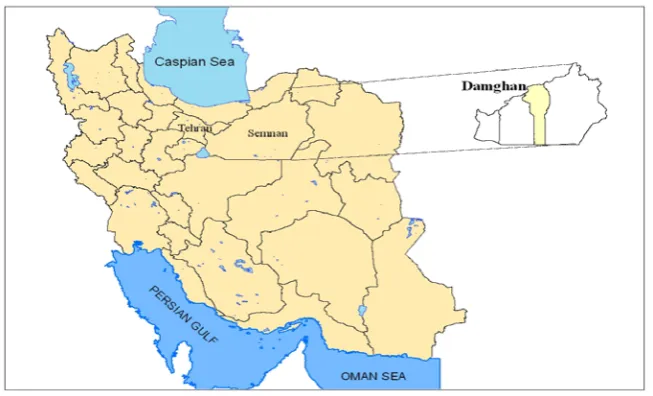
The study area is marginal lands of Damghan, approximately 100 km of Semnan, in north of Iran, between longitude 36° 09´ 26˝ to 36° 18´ 42˝and latitude of 54° 36´ 40˝ to 54° 49´ 02˝ with an area of 41200 ha (figure 1). Mean elevation of the region is 1180 m. mean slope of the region is 2 %. The mean average of annual precipitation is 127 mm, The maximum of annual temperature is recorded 42°c while the minimum temperature is -16°c. The soil temperature regime is thermic and the soil moisture regime is aridic.
Fig. 1. Study area
2.2. Data- collection
Based on field surveys, 6 dominant vegetation types were distinguished. Sampling
vegetation and environmental variables fifteen 1 m2 plots in each vegetation type with a distance of 50m from each other were established. Floristic list and canopy cover percentage were recorded. Soil samples were taken from 0-15 cm and 15-50 cm layers. Measured soil factors included pH (using pH meter), Ec (USING Ec meter), texture (determined by Bouy oucus hydrometer), Soluble calcium and magnesium (determined by titration with solution EDTA method), Soluble chlorine (determined by titration with AgNO3), Soluble Carbonate and
bicarbonate (determined by titration with H2SO4
using metilorange and phenolphthalein respectively), Soluble Sodium and Potassium (determined by flame photometry method), Gypsum (determined by Aceton method) and lime (determined by collin,s Calcimeter).
2.3. Data analysis methods
Data matrix of environmental factors and vegetation types was made. The windows of PC-ORD (ver.3.3) (McCune and Mefford, 1997) were used for ordination of vegetation types in gradient of soil characteristics. Principal component analysis (PCA) was used to analyze the data. PCA is ordination technique that constructs the theoretical variable that minimizes the total residual sum of squares after fitting straight lines to species data. PCA does so by choosing the best values for the sites (Jafari et al., 2003). To apply PCA, data standardization is necessary if we are analyzing variables that are measured in different units. Also, species with high variance, often the abundant ones, therefore dominate the PCA method, where as species with low variance, often the rare ones, have only minor influence on the method. These may be reasons to apply standardized PCA, in which all species receive equal weight (Jafari et al. 2003). Therefore, data were standardized by centered and standard deviation (Jongman, 1987). Eigenvalues for each principal component was compared to a broken- stick eigenvalue to determine if the captured variance summarized more information than expected by chance. Broken-Stick
eigenvalus have been shown to be a robust method for selection of nontrivial components in PCA (Jackson, 1993).
3. Results
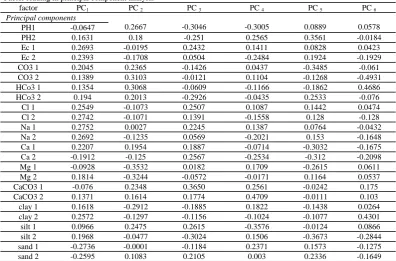
In order to find the most effective factors on the separation of vegetation types, PCA was used. Table 1 shows the ordination results of the PCA analysis. As it is shown in Table 1, PC 1 and PC 2 are accounted for 67.93% of vegetation variations that is caused by soil characteristics, which From 67.93% of variations, PC 1 and PC 2 include 43.02% and 24.90%, respectively. According to correlation coefficients between factors and components, the factors of PC 1 are sand in the first soil layer (0-15cm) and EC, Cl-, Na+ in the second layer (15-50 cm). PC2 includes Mg2+and clay at depth
0-15cm and only Mg2+ at depth 15-50cm (second layer). Therefore, PC 1 can be considered as an indicator of soil Salinity, texture and Nutrient characteristics of soil. In face, these factors are the most effective factors on the separation of plant types. Fig 2 represents the diagram of types distribution in relation to soil variables in PC 1 and PC 2.
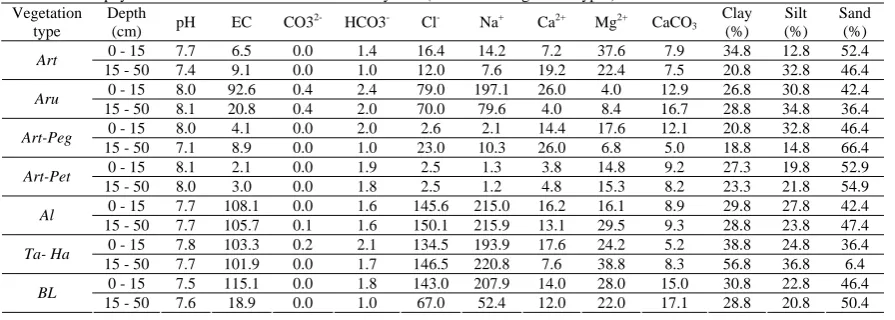
According to the diagram and interpretation of the vegetation types spatial distribution, in addition to the soil characteristics (soil characteristics of each of the seven vegetation types are summarized in Table 2) we can refer to some points as follows:
1. Distance between the indicator points of vegetation types shows the degree of similarity and dissimilarity of soil characteristics.
2. Considering PC 1, all coefficients of the soil characteristics that were significant except for sand are positive.
Therefore, plant sites situated in positive direction of 1 axis have direct relationship with PC 1 factors. In the second principal component (PC 2), coefficients of all factors are negative. 3. The distance between indicator points of the vegetation types with axis is representative of the relationship power in explanation of variations.
Table 1. PCA applied to the correlation matrix of the environmental factors in the study area
AXIS Eigenvalue %of Variance Cum.% of Var. Broken-stick Eigenvalue
1 10.326 43.024 43.024 3.776
2 5.974 24.894 67.917 2.776
3 3.215 13.396 81.314 2.276
4 2.442 10.174 91.488 1.943
5 1.328 5.534 97.022 1.693
Artemisia
Arundo sp
Artemisia-peganum
Artemisia-petropyron
Alhaji cammelerum
Tamarix-Halocnemum Bareland
Axis 1
Axis 2
Factor loading in principal component analysis
factor PC1 PC 2 PC 3 PC 4 PC 5 PC 6
Principal components
PH1 -0.0647 0.2667 -0.3046 -0.3005 0.0889 0.0578
PH2 0.1631 0.18 -0.251 0.2565 0.3561 -0.0184
Ec 1 0.2693 -0.0195 0.2432 0.1411 0.0828 0.0423
Ec 2 0.2393 -0.1708 0.0504 -0.2484 0.1924 -0.1929
CO3 1 0.2045 0.2365 -0.1426 0.0437 -0.3485 -0.061
CO3 2 0.1389 0.3103 -0.0121 0.1104 -0.1268 -0.4931
HCo3 1 0.1354 0.3068 -0.0609 -0.1166 -0.1862 0.4686
HCo3 2 0.194 0.2013 -0.2926 -0.0435 0.2533 -0.076
Cl 1 0.2549 -0.1073 0.2507 0.1087 0.1442 0.0474 Cl 2 0.2742 -0.1071 0.1391 -0.1558 0.128 -0.128
Na 1 0.2752 0.0027 0.2245 0.1387 0.0764 -0.0432
Na 2 0.2692 -0.1235 0.0569 -0.2021 0.153 -0.1648 Ca 1 0.2207 0.1954 0.1887 -0.0714 -0.3032 -0.1675 Ca 2 -0.1912 -0.125 0.2567 -0.2534 -0.312 -0.2098
Mg 1 -0.0928 -0.3532 0.0182 0.1709 -0.2615 0.0611
Mg 2 0.1814 -0.3244 -0.0572 -0.0171 0.1164 0.0537 CaCO3 1 -0.076 0.2348 0.3650 0.2561 -0.0242 0.175 CaCO3 2 0.1371 0.1614 0.1774 0.4709 -0.0111 0.103 clay 1 0.1618 -0.2912 -0.1885 0.1822 -0.1438 0.0264 clay 2 0.2572 -0.1297 -0.1156 -0.1024 -0.1077 0.4301
silt 1 0.0966 0.2475 0.2615 -0.3576 -0.0124 0.0866 silt 2 0.1968 -0.0477 -0.3024 0.1506 -0.3673 -0.2844 sand 1 -0.2736 -0.0001 -0.1184 0.2371 0.1573 -0.1275
sand 2 -0.2595 0.1083 0.2105 0.003 0.2336 -0.1649
Whatever the length of vector loading that indicates the vegetation types is bigger and angle between vectors with axis is smaller, there is more correlation between vegetation types, with axis and relation power. As it shown in fig.1, the location of types in 4 quarters is different. This means that different types presence in different sites is affected by different environmental factors. Aru. type is equally affected by axis 1 and 2. This type is lied in fires quarter, so it has a direct relationship with heavy Texture, high acidity. Generally with attention to the position of this type in the first quarter, can say that environmental condition. In this type differ from each other.
In relation to two types of Ar.Si-Pe.ha and
Ar.Si-Pe, this type showed noticeable positive correlation with sand (light texture), while EC, Cl-, Na+ have reverse relationship with this types.
As it is shown in Fig.2 Al.Ca and Ta.-Ha
types are located in fourth quarter and equally affected by axis 1 and 2, So this types have a negative relationship with clay, Sand and Mg2+ while it has seen a positive relationship among this types and EC, Cl-, Na+.
BL and Ar.si has been located in negative side of Axis 1 and 2, therefore, it has a positive tendency to Mg2+, Sand and Clay, while this type are reversely influenced by Cl-, EC, Na+. Appendix: Units and abbreviations of the vegetation types and soil characteristics in the figures and tables.
4. Discussion and Conclusion
Soils of the study area are considered as saline soils, which might be the reason for low plant diversity in the area. It is because of that plants can absorb their necessary ions only when there is a constant ionic ratio among existing ions in the soil, otherwise roots will not be able to absorb soil ions and this causes a disturbance in plant growth and distribution. Low diversity of plant in the study area is an evidence for this material. In addition, high salinity is other reason that makes difficulty in the establishment and regeneration plants in saline lands. Only high adapted plants can grow
under such conditions. Halocnemum
strobilaceum, Tamarix passerinoides and
Artemisia sieberi are examples of plants that grow in saline soils of the study area. Results demonstrate that there is a specific relationship between soil characteristics and the separation of the vegetation types. Soil Salinity and texture are the two main factors that cause separation of
the types in the study area. This result are supported by the works of Flowers (1975); Kassas (1957); Ungar (1968); Caballero et al. (1994); Jafari (1989); Moghimi (1989); Maryam
et al. (1995); Zahran et al. (1989); Jafari et al. (2003, 2004); Heshmati (2003), Monier et al. (2003). These researchers found that distribution of plants in a given region is a function of soil salinity. Abu-Ziada (1980) showed that there is a strong relationship between plant distribution pattern with soil salinity and moisture. In the current study, it was revealed that soil salinity and its variation are of the most important factors in the classification of vegetation. As noted earlier, soil texture was found as an effective variable on the vegetation types separation. This is due to texture influence on the amount of moisture (Monier et al., 2003) and available nutrient of soil (Jafari et al., 2004) that can influences on growth and distribution of plants. In addition, nutrients have been strongly correlated with vegetation (wales, 1975; Pregitzer and Barnes, 1982; Pregitzer et al., 1983).
PCA analysis indicates that Ar.Si-Pe.ha and
Ar.Si- Pet types show a negative relationship with salinity nutrients of soil. These types are indicators of soil with low salinity and nutrients. By contrast, Al.ca and Ta.pa – Ha.st types are indicators of soil with higher salinity and nutrients.
Generally, each plant species has specific relations with environmental variables. These relations are because of habitat condition, plant ecological needs and tolerance range. Understanding the indicator of environmental factors of a given site leads us recommend adaptable species for reclamation and improvement of that site and similar sites.
Appendix A
Units and abbreviations of the vegetation types and environmental factors in the figures and tables.
2 3
Co Carbonate (meq/ li)
3
HCo Bicarbonate (meq/li)
2
Mg Magnesium (meq/li)
Cl Chlorine (meq/li)
Ca Calcium ion(meq/li)
Table 2. Soil physical and chemical characteristic of study area (in different vegetation types) Vegetation
type
Depth
(cm) pH EC CO3
2- HCO3- Cl- Na+ Ca2+ Mg2+ CaCO 3 Clay (%) Silt (%) Sand (%) 0 - 15 7.7 6.5 0.0 1.4 16.4 14.2 7.2 37.6 7.9 34.8 12.8 52.4 Art
15 - 50 7.4 9.1 0.0 1.0 12.0 7.6 19.2 22.4 7.5 20.8 32.8 46.4 0 - 15 8.0 92.6 0.4 2.4 79.0 197.1 26.0 4.0 12.9 26.8 30.8 42.4 Aru
15 - 50 8.1 20.8 0.4 2.0 70.0 79.6 4.0 8.4 16.7 28.8 34.8 36.4 0 - 15 8.0 4.1 0.0 2.0 2.6 2.1 14.4 17.6 12.1 20.8 32.8 46.4 Art-Peg
15 - 50 7.1 8.9 0.0 1.0 23.0 10.3 26.0 6.8 5.0 18.8 14.8 66.4 0 - 15 8.1 2.1 0.0 1.9 2.5 1.3 3.8 14.8 9.2 27.3 19.8 52.9 Art-Pet
15 - 50 8.0 3.0 0.0 1.8 2.5 1.2 4.8 15.3 8.2 23.3 21.8 54.9 0 - 15 7.7 108.1 0.0 1.6 145.6 215.0 16.2 16.1 8.9 29.8 27.8 42.4 Al
15 - 50 7.7 105.7 0.1 1.6 150.1 215.9 13.1 29.5 9.3 28.8 23.8 47.4 0 - 15 7.8 103.3 0.2 2.1 134.5 193.9 17.6 24.2 5.2 38.8 24.8 36.4 Ta- Ha
15 - 50 7.7 101.9 0.0 1.7 146.5 220.8 7.6 38.8 8.3 56.8 36.8 6.4 0 - 15 7.5 115.1 0.0 1.8 143.0 207.9 14.0 28.0 15.0 30.8 22.8 46.4 BL
15 - 50 7.6 18.9 0.0 1.0 67.0 52.4 12.0 22.0 17.1 28.8 20.8 50.4
References
Abd El-Ghani, M.M., 1997. Vegetation analysis and species diversity along an altitudinal gradient in the central Hijaz Mountains of Saudi Arabia. Arab Gulf Journal of Scientific Research 15(2), 399-414. Abd El-Ghani, M.M., 1998. Environmental correlates of species distribution in arid desert ecosystems of eastern Egypt. Journal of Arid Environments 38, 297- 313.
Abd El-Ghani, M.M., 2000. Vegetation composition of Egyptian inland salt marshes, Bull. Acad. Sin., 41: 305-314.
Abu- Ziada, M.E.A., 1980. Ecological studies on the flora of Kharage and Dakhla Oases of the Westem Desert of Egypt.Ph. D Thesis,Fac.Sci., Mansoura Univ.,342pp.
Batanouny, K.H., 1985. Botanical exploration of Sinai. Qatar University Science Bulletin 5, 187–211. Breckle, S.W., 1986. Studies of halophytes from iran and Afghanistian, proceeding of royal society of Edinbub, 89(b) 203-215.
Caballero J.M., Esteve, M.A., Calvo, J.F., Pujol, J.A., 1994. Structure of the vegetation of salt steppes of Guadelenitin (Murcia,Spain). .Stud. Oecol., 10-11, 171-183.
Danin, A., 1983. Desert Vegetation of Israel and Sinai. Cana Publishing House, Jerusalem, 148pp.
Flowers, T.J., 1975. Halophytes.ln D. A.Barker and J. L. Hall (eds), lon transport in cells and tissues, North Holland, Amesterdam, pp: 309-334.
Heshmati, Gh., 2003. Investigating of affect of environmental parameters on range species by multivariate analysis. Journal of natural resources 56(3), 309-320 (Persian).
Hillel, D., Tadmor, N., 1962. Water regime and vegetation in the Central Negev Highlands of Israel. Journal of Ecology 43, 33–41.
Hoveizeh, H., 1997. Study of the vegetation cover and ecological characteristics in saline habitats of Hoor-e- Shadegan. Journal of Pajouhesh and Sazandegi (Persian) 34, 27-31.
Jackson, D.A., 1993. Stopping rules in principal component analysis–A comparison of huristic and statistical approaches. Journal of Ecology 74, 2204- 2214.
Jafari, M., 1989. Survey of relationship between salinity agents and distribution of plants in Damghan region.MSc.Thesis in Natural Resources College of Tarbiat Modarres university. 320pp. (Persian).
Jafari, M., Zare Chahouki, M.A., Tavili, A., Azarnivand, H., 2003. Soil- Vegetation relationship in hoz-e- soltan region of Qom province, Iran, Journal of Nutrition 2:6:329-334.
Jafari, M., Zare Chahouki, M.A., Tavili, A., Azarnivand, H., Zahedi Amiri, Gh., 2004. Effective environmental factors in the distribution of vegetation types in Poshtkouh rangelands of Yazd Province (Iran). Journal of Arid Environments 56, 627–641.
Jongman, R.H.G., TerBreak, C.J.F., Van Tongeren, O.F.R., 1987. Data Analysis in community and landscape ecology. Center Fire Agricultural Publishing and Documentation, Wageningen. 342pp. Kassas, M., 1957. On the ecology of the Red Sea coastal land. Journal of Ecolo 45, 187-203.
Kassas, M., Girgis, W.A., 1965. Habitat and plant communities in the Egyptian desert. IV. The units of a desert ecosystem. Journal of Ecology 53, 715–728. Mabbutt, J.A., 1977. Desert Landforms. MIT Press, Cambridge, MA. 357pp.
Maryam, H., lsmail, S., Alaa, F., Ahmed, R., 1995. Studies on growth and salt regulation in some halophytes as influenced by edaphic and climatic conditions.Pak. Journal of Botany 27, 151-163. McCune, B., Mefford, M.J., 1997. PC-ORD. Multivariate Analysis of Ecological Data Version 3.0. MjM Software Design. Gleneden Beach, OR. 125pp. Migahid, A.M., El-Shafei, A.M., Abdel Rahman, A.A., 1959. Ecological observations in Western and Southern Sinai. Bulletin de la Societe de Geographie D’Egypte 32, 165–206.
Moghimi, J., 1989. Survey of relationship between vegetation, salinity and water ground table in Hoz-e- Soltan playa in Qom province, MSc. thesis in Natural Resources College of Tehran university. 172pp. (Persian).
Monier, M.A.E., Wafaa, M.A., 2003. Soil–vegetation relationships in a coastal desert plain of southern Sinai, Egypt. Journal of Arid Environments 55, 607- 628.
Moustafa, A.A., Zaghloul, M.S., 1996. Environment and Vegetation in the montane Saint Catherinr, south Sinai, Egypt. Journal of Arid Environments 34, 331- 349.
Noy-Meir, I., 1973. Desert ecosystems: environment and producers. Annual Review of Ecology and Systematics 4, 25–51.
in a Negev Desert watershed. Journal of Vegetatio 54, 153–165.
Parker, K., 1991. Topography, substrate, and vegetation patterns in the northern Sonoran Desert. Journal of Biogeography 18, 151–163.
Pregitzer, K.S., Barnes, B.V., 1982. The use of ground flora to indicate edaphic factors in upland ecosystms of the McCormick Experimental Forest, upper Michigan. Can. Journal of Forest Researches 12, 661- 672.
Pregitzer, K.S., Barnes, B.V., Lemme, G.D., 1983. Relationship of topography to soils and vegetation in an upper Michigan ecosystem. Journal of Soil Science 47, 117-123.
Shaltout, K.H., El-Kady, H.F., Al-Sondy, Y.M., 1995. Vegetation analysis of the Mediterranean region of Nile Delta. Journal of Vegetatio 116, 73-83.
Springuel, I., Sheded, M.G., Murphy, K.J., 1997. The plant biodiversity of the Wadi Allaqi Biosphere Reserve (Egypt): impact of lake Nasser on a desert Wadi ecosystem. Biodivers.Conserv 6, 1259-1275. Stahr, K., Bornkamm, R., Gauer, A., Kehl, H., 1985. Ver. anderung von Boden und Vegetation am U.
bergang von Halbwu. ste zur Vollwu.ste zwischen Mittelmeer und Quattare Depression in A. gypten.Geo.okodynamik 6, 99–120.
Ter Braak, C.J.F., 1987. The analysis of vegetation– environment relationships by canonical correspondence analysis. Journal of Vegetatio 69, 69– 77.
Ungar, l., 1968. Species-Soil relationships on the Great SaltPlains of northern Oklahoma. Amer. Midl. Naturalist 80, 392-406.
Wales, B.A., 1967. Climate, microclimate, and vegetation relationships on north and south forest boundaries in New Jersey. William L. Hutcheson Mem. For. Bull. 2(3), 1-60
Yair, A., Danin, A., 1980. Spatial variation as related to the soil moisture regime over an arid limestone hillside, northern Negev, Israel. Journal of Oecologia 47, 83–88.