Global Optimization of Lateral Performance for Two-Post
ROPS Based on the Kriging Model and Genetic Algorithm
Jixin, W. ‒ Mingyao, Y. ‒ Yonghai, Y.
Wang Jixin* ‒ Yao Mingyao ‒ Yang Yonghai
Jilin University, College of Mechanical Science and Engineering, China
To improve their energy-absorption capacity, the current study provides a global optimization design method for two-post rollover protective structures (ROPS) that utilizes the Latin hypercube method to determine sample point values, the Kriging model as an alternative to traditional second-order polynomial response surfaces for constructing global approximations, and the genetic algorithm to yield optimized results. Through optimization, a satisfactory variation tendency of object function in the lateral loading analysis is obtained, and the load-carrying capability, deformation, and energy absorption are found to match each other well. The matching rationality between energy absorption and lateral load-carrying capability effectively improves the energy-absorption capacity of the ROPS.
©2011 Journal of Mechanical Engineering. All rights reserved.
Keywords: engineering vehicle, rollover protective structure (ROPS), global optimization, Kriging, genetic algorithm, energy absorption
0 INTRODUCTION
Earthmoving machinery is susceptible to rollovers because of poor working conditions and complicated roads where stability is decreased [1] and [2]. Rollover casualties of earthmoving machinery have been identified as a serious problem. To reduce rollover fatalities, rollover protective structures (ROPS) were developed [3] to [5]. ROPS, together with operator restraint systems (seatbelts), keep the operator within a protected area and provide a survival zone during lateral rollover accidents. This survival zone, however, is not enough for major accidents, and a considerable amount of the rollover kinetic energy must be absorbed through the permanent plastic deformation of ROPS components, so that the rollover kinetic energy absorbed by the driver is at a minimum.
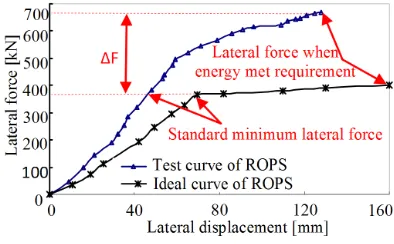
Traditional design methods for ROPS, such as empirical design and qualitative-analogical design, usually go through a repetitive process of design–test–revise design–retest, leading to substantial wastage of manpower and material resources. Furthermore, a significant disadvantage of the traditional method is that it is not valid for an effective analysis of the lateral energy absorption of ROPS because it often increases the lateral force to values much larger than the International Organization for Standardization (ISO) minimum
standard even when the lateral energy absorption meets ISO requirements (Sketch map shown in Fig. 1).
Fig. 1. Sketch map of performance curves of typical lateral energy absorption and load
carrying
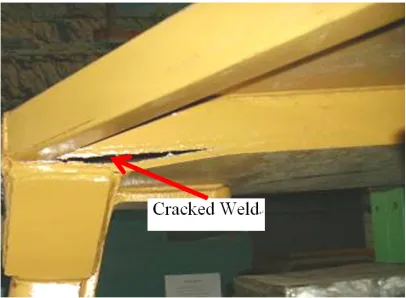
If the energy-absorption coefficient is deficient, cracking failures may occur at the connection between the beam and the post (shown in Fig. 2), which may result in the collapse of the whole ROPS [6]. When the ROPS cracks, the lateral energy is not absorbed by the permanent plastic deformation, especially the plastic hinge rotation, of the ROPS components.
provides a global optimization method for ROPS design. Here, the values of the sample points are selected using the Latin hypercube method, the response surface is established using the Kriging model, and the sample points are optimized through genetic algorithm (GA).
Fig. 2. Cracking failure of weld in two-post ROPS connection
1 ESTABLISHMENT OF KRIGING MODEL
Many factors can affect the weight and performance of ROPS, such as the height, width, and length of the cab; the height, length, and thickness of the post and the beam; and the dimensions and thickness of the stiffeners. Because the correlation between the above-mentioned design variables and ROPS performance cannot be explicitly expressed, each design proposal should be processed through nonlinear finite element analysis, along with a large deformation study, which is time-consuming. To save computational expenses, the paper uses the Kriging model to construct the response surface to represent the approximate relation between the design variables and ROPS performance.
1.1 Selection of Sample Points
Before constructing the Kriging model, a certain amount of given information is obtained through tests. The selection of sample points is a key step during the tests. Several choice methods used to determine the sample points are the following:
• orthogonal experimental design, • uniform test,
• latin hypercube.
In the present study, the Latin hypercube method is used to determine the sample points because it can control the location of sample points, thus avoiding superposing within a small neighborhood [7]. If n sample points are carried out, m random variables are divided into n short equiprobable intervals, and the whole sample space is divided into equiprobable n×m intervals. For each variable, n sample points separately fall in each short interval − equiprobably located in the whole randomly dispersed space.
Using the Latin hypercube sampling method, an approximation response surface with preferable overall performance is obtained.
1.2 Calculation of ROPS Response
A finite element model (FEM) of the ROPS using ANSYS software [ANSYS Parametric Design Language (APDL)] is created. The response of the ROPS is obtained using material and geometric nonlinear analysis for each sample point.
1.3 The Kriging Model
Generally, a second-order polynomial response surface model and a Kriging model are used to improve the efficiency of optimization design. Based on Refs. [8] to [12], the construction of a second-order polynomial response surface model becomes relatively more simple with less computation. However, it does not have ideal prediction accuracy when high-grade nonlinear problems are encountered.
Simpson et al. [13] have shown that the Kriging model has features of unbiased estimation for sample points and super nonlinear-approximation ability. Therefore, the Kriging model is a relatively ideal model for the nonlinear optimization of ROPS.
y(x) = f(x)+z(x) , (1) where y(x) is the unknown function of interest, f(x) is the deterministic part generally expressed as a polynomial, and z(x) is the random field and the realization of a stochastic process. The f(x) in Eq. (1) is similar to a polynomial response surface and can provide a “global” model of the design space. In many cases, f(x) is taken as a constant. Meanwhile, f(x) globally approximates the design space, and z(x) creates “localized” deviations. Therefore, the Kriging model can well interpolate the sample points. The mean, variance, and covariance matrices of z(x) are given in Eqs. (2) to (4):
E[z(x)] = 0 , (2)
Var[z(x)] = σ2 , (3) Cov[z(xi), z(xj),] = σ2 R[R(xi, xj)] , (4) where R is the correlation matrix and R(xi, xj) is the space-related equation between any two sample points xi and xj in ns sample points that play a decisive role in the accuracy of simulation. The relevant equation that yields the best calculation results is the Gaussian correlation equation [14]. The form of the Gaussian correlation function is as follows:
R x xi j k xki xkj
k n
k v
( , ) exp(= − − ),
=
∑
θ δ1 (5)
where nv is the known number of design variables and xki and xkj are the kth constituent of the sample points xi and xj. Parameters θk and δk stand for the related parameter and smoothness parameter, respectively, which ensure sufficient flexibility in the calculation of relevant equations. R(xi,xj) is entirely continuous but non-differentiable when
θk = 1 and infinitely differentiable when δk = 2. Linear combinations of known response values of samples are usually used to estimate the response of any given sample. Through derivation, the predicted value of the model is:
y r x R y fT
∧ ∧
− ∧
= +β ( ) 1( − β). (6)
where y = [y1, y1,..., yn]T is the response value and y∧
is the estimation value; f is the post vector when f(x) takes a constant value; and rT(x) is the correlation vector of length ns between an untried x and the sampled data points {x1, x1,..., xn}, as shown in Eq. (7):
rT = [R(x,x1), R(x,x2), ..., R(x,xn)]T (7)
β∧ is an estimator that can be calculated by:
β∧ =(f R fT −1 )−1f R yT −1 . (8)
The variance σ∧2 can be determined by β∧
and y by the following:
σ∧2 β 1 β
∧
− ∧
=(y f− ) R y f( − ) . n
T
s
(9)
θk, which is the unbiased estimator of the Kriging model, can be calculated by Eq. (10).
max ( )Φθ [ ln( ) ln ]σ .
θk k
n R
>
∧
= − +
0
2
2 (10)
Therefore, the model parameters for the Kriging model construction that must be identified include f(x), r(x), and θ [8], [15] and [16]. In summary, the Kriging model construction problem is converted into a non-linear unconstrained optimization problem.
2 GENETIC ALGORITHM OPTIMIZATION
2.1 Genetic Algorithm (GA)
In the current study, the objective function is the minimum difference between the force from the lateral load-carrying capability test and the force from the minimum lateral energy-absorption test. The constraint function is the performance index of ROPS.
2.2 Optimization
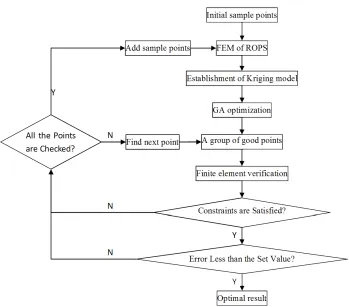
A flow chart of optimization for two-post ROPS based on the Kriging model and GA is shown in Fig. 3.
1. After the initial number of sample points is determined, specific values of the initial sample points are selected using the Latin hypercube method.
2. According to the selected points, the FEMs of ROPS, along with large elastic-plastic deformation properties, are created in finite element software. The responses, such as load carrying, deformation, and energy-absorption capability, are obtained through nonlinear materials and geometric nonlinear analyses. 3. An approximate response surface is
established using Design and Analysis of Computer Experiments software, which is a MATLAB toolbox for converting Kriging approximations to computer models [18] to [22].
Fig. 3. Flow chart of GA optimization for two-post ROPS based on the Kriging model 4. Optimal results are obtained using the GA
optimization program based on the Kriging model.
5. After GA optimization, optimal results of GA are substituted into FEM for the verification of ROPS performance. The obtained points are checked in a regular sequence to determine whether or not the conditions satisfy the constraints and meet the accuracy requirements. If there is a sample point that meets both requirements, it is considered the optimization result. Otherwise, all the sample points will be added into the FEM of ROPS to update the Kriging model. This process is carried out repeatedly from Steps 3 to 5 until the final optimal results are obtained.
3 APPLICATION
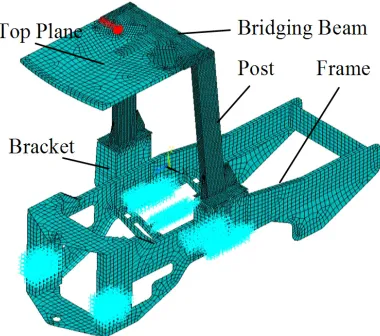
Fig. 4. FEM and boundary conditions of two-post ROPS
3.1 Mathematical Model of Optimization
3.1.1 Design Variable
The height and width of the ROPS are held constant; the structural parameters of the bracket, frame, top components of Falling object protective structures (FOPS), and the parameters of the ribs of ROPS are considered constant.
The design variables that have a considerable influence on the lateral load-carrying capacity and energy-absorption capacity of ROPS are the sectional dimensions of the beams and posts. In order to easily weld the joint of the post and beam, the width of the post is taken as the width of the beam.
Therefore, the independent design variables are shown as follows.
x = [x1, x2, x3, x4, x5] , (11) where x1 and x2 are the width and the height of the bridging beam sections, respectively; x3 is the height of the post section; x4 is the wall thickness of the bridging beam section; and x5 is the wall thickness of the post section.
3.1.2 Object Function
The minimum difference between the force from the lateral load-carrying capability test
and the force from the minimum lateral energy-absorption test is taken as an object function.
min ΔF = ΔF(x1, x2, x3, x4, x5) , (12) where ΔF is the difference value between the two forces. As shown in Eq. (11), x1, x2, x3, x4, x5 are the design variables.
3.1.3. Constraint Conditions
(1) Boundary constraints of design variables. According to the section size of the available profile of steel and design space constraints on ROPS, the values of design variables are as follows:
80 190
60 160
60 120
6 12
6 16
1
2
3
4
5
≤ ≤
≤ ≤
≤ ≤
≤ ≤
≤ ≤
x x x x x
, , , , .
(2) Deformation constraint. The deflection limitation volume (DLV) is fixed based on the Seat Index Point of a seat. The allowable maximum lateral deformat ion can be calculated according to the space between ROPS and DLV. For this two-post ROPS, the maximum lateral displacement DL is 300 mm, so DL ≤ 300 mm.
(3) Load-carrying capability constraint. Based on [5], the lateral load carrying FL is 150 kN, so FL ≤ 150 kN.
(4) Energy-absorption constraint. The larger the energy absorbed by ROPS, the better its performance is for protecting the operator. [5] shows that the lowest lateral energy absorption EL of this ROPS is 33,000 J, so EL≥ 33,000 J.
3.1.4 Mathematical Model of ROPS Optimization
According to the above design variables, object function, and constraint conditions, a mathematical model is set up as follows:
s.t.
80 190
60 160
60 120
6 12
6 16
300 0 1
2
3
4
5
≤ ≤
≤ ≤
≤ ≤
≤ ≤
≤ ≤
− ≤
x x x x x DL
, , , , , ,, ,
.
150 0
33000 0
− ≤
− ≤
FLE
L
3.2 Optimization
Establishment of the Kriging model requires few sample points; based on the results of pre-calculation, 30 initial sample points are determined. Based on the upper and lower limits of the design variables, the specific values of these initial sample points are determined by the Latin hypercube method. These values are inputted into APDL to create the FEM of ROPS. The response values of ROPS performance, such as load carrying, deformation, and energy absorption, are obtained by large elastic-plastic deformation simulations.
As the polynomial function f(x) is not of decisive importance in the accuracy of the simulation, let f(x) = 1 (linear regression model) for convenience of calculation. In contrast,
the correlation equation R(xi,xj) is of decisive importance in the accuracy of the simulation, so the Gaussian correlation equation is selected.
An optimization program is written in MATLAB based on the Kriging model and the GA. During optimization, the initial population Psize is 200, the crossover probability PC is 0.7, the mutation probability Pm is 0.01, and the terminal generation T is 120.
3.3 Optimization Results
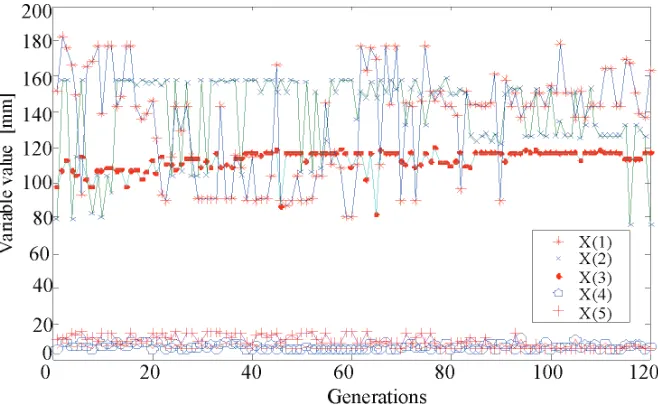
The tendency of each design variable changes with the terminal generations, as shown in Fig. 5. The tendency of the object function also changes along with the terminal generations, which is shown in Fig. 6.
Considering that the Kriging model approximately represents the true response surface, the points that meet the limiting conditions during optimization may not be able to exactly meet the limiting conditions in the true model. As shown in Fig. 3, the primary results of the GA optimization are substituted into the FEM of ROPS, and the ROPS performance is again analyzed to check that the optimization results meet the desired constraints and accuracy.
The results are optimized and rounded. According to the specifications of the available standard profile of steel, the final optimal solution
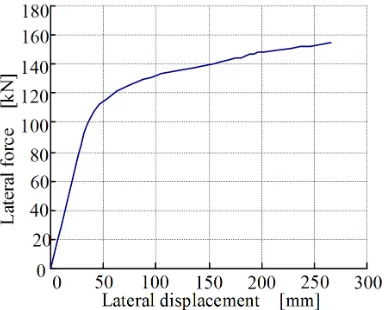
for this two-post ROPS is x(1) = 150, x(2) = 110, x(3) = 120, x(4) = 8, and x(5) = 6. In addition, the lateral load carried is 154 kN, and the energy-absorption value is 34,500 J. The relationship between lateral displacement and lateral force is shown in Fig. 7.
Fig. 6. Variation of the object function changes with the Generations
Fig. 7. Relationship between lateral displacement and lateral force
4 SUMMARY
This current work provided a global optimization method for a typical earthmoving machinery ROPS. The optimization method took the minimum difference between the force from the lateral load-carrying capability test and the
force from the minimum lateral energy-absorption test as an object function, and the performance index of ROPS as constraint conditions. The number of initial sample points was fixed, and the specific values of sample points were determined through the Latin hypercube method within the limits of the design variables. Large plastic deformation FEM was established in APDL, and the responses (load carrying, deformation, and energy absorption) in the initial design points were obtained by simulation. Finally, the Kriging model was established, and the GA was applied to optimization. The results of the global optimization of this two-post ROPS show that the ROPS performance, which is closely related to the sectional dimensions of the beams and posts of ROPS, was improved using global optimization based on the Kriging model and GA. As the lateral force met the standard minimum lateral force requirement, lateral displacement obviously increased along with the increasing lateral force so that the lateral energy was significantly absorbed by ROPS through the permanent plastic deformation of components, particularly through the plastic hinge rotation of ROPS beam components.
5 ACKNOWLEDGEMENT
The work described in this paper is supported by the National Natural Science Foundation of China (No. 50805065). The authors would like to thank the individuals who contributed to the project, especially Zhang Lihui.
6 REFERENCES
[1] Clark, B.J., Thambiratnam, D.P., Perera, N.J. (2006). Analytical and experimental investigation of the behavior of a rollover protective structure. The Structural Engineer, vol. 84, no. 1, p. 29-34.
[2] Thambiratnam, D.P., Clark, B.J., Perera, N.J. (2009). Performance of a roll over protective structure for a bulldozer. Journal of Engineering Mechanics, vol. 135, no. 1, p. 31-40.
excavator. Komatsu Tech Rep, vol. 52, no. 2, p. 2-7.
[4] Karliński, J., Rusiński, E., Smolnicki, T. (2008). Protective structures for construction and mining machine operators. Automation in Construction, vol. 17, no. 3, p. 232-244. [5] ISO3471 (2008). Earth-moving machinery
Roll-over protective structures Laboratory tests and performance requirements. Geneva, International Organization for Standardization, Geneva.
[6] Wang, J.X., Yang, X., Yu, X.J. (2009). Nonlinear finite element analysis and test of lateral loading for two-post ROPS. Applied Mechanics and Materials, vol. 16-19, p. 866-870.
[7] Fang, K.T. (2004). Method of uniform design and its application. Mathematical Statistics and Management, vol. 23, no. 3, p. 69-80. (in Chinese)
[8] Wang, J.X. (2006). Design method and experimental study on the rollover protective structures for engineering vehicles. Ph.D. dissertation, Jilin University, Jilin.
[9] Kleijnen, J.P.C. (2005). An overview of the design and analysis of simulation experiments for sensitivity analysis. European Journal of Operational Research, vol. 164, no. 2, p. 287-300.
[10] Martin, J., Simpson, T. (2005). Use of Kriging models to approximate deterministic computer models. AIAA Journal, vol. 43, no. 4, p. 853-863.
[11] Simpson, T.W., Korte, J.J., Mauery, T.M. Mistree, F. (2001). Kriging models for global approximation in simulation-based multidisciplinary design optimization. AIAA Journal, vol. 39, no. 12, p. 2233-2241. [12] You, H.L., Jia, X.Z., Dong, P. (2005).
Constructing circuit metamodel using Kriging interpolation integrated with Latin hypercube sampling experiment. Journal of System Simulation, vol. 17, no. 11, p. 2752-2755. [13] Simpson, T.W., Poplinski, J.D., Koch,
P.N., Allen, J.K. (2001). Metamodels for
computer-based engineering design: Survey and recommendations. Engineering with Computers, vol. 17, no. 2, p. 129-150.
[14] Giunta, A.A., Watson, L.T. (1998). A Comparison of approximation modeling techniques: polynomial versus interpolating models. AIAA-1998-4758, Proceedings of the 7th AIAA/USAF/NASA/ISSMO Symposium on Multidisciplinary analysis and optimization, St. Louis, Missouri, vol. 2, p. 392-440.
[15] Zhang, Q. (2005). Structural reliability analysis and optimization based on Kriging technique. Ph.D. dissertation, Dalian University of Technology, Dalian.
[16] Simpson, T.W., Manery, T.M., Korte, J.J., Mistree, F. (1998). Comparison of response surface and Kriging models for multidisciplinary design optimization. AIAA Journal, vol. 4758, no. 7, p. 381.
[17] Zbigniew, M., Fagel, D.B. (2004). How to solve it: modern heuristics. Springer, Berlin, New York.
[18] Lophaven, S., Nielsen, H., Søndergaard, J. (2002). DACE: A Matlab Kriging toolbox (Documentation), from http://www2.imm.dtu. dk/~hbn/dace/, retrieved on 2008-08-02. [19] Sasena, M.J. (2002). Flexibility and efficiency
enhancements for constrained global design optimization with Kriging approximations. Ph.D. dissertation, University of Michigan, Michigan.
[20] Schonlau, M., Welch, W.J. (1997). Computer experiments and global optimization. University of Waterloo, Waterloo.
[21] Chu, D.Z. (2004). The globec Kriging software package - easykrig3, from ftp:// globec.whoi.edu/pub/software/kriging/easy_ krig/v3.0.1/, retrieved on 2008-08-02.