in the population sciences published by the Max Planck Institute for Demographic Research Konrad-Zuse Str. 1, D-18057 Rostock · GERMANY www.demographic-research.org
DEMOGRAPHIC RESEARCH
VOLUME 22, ARTICLE 3, PAGES 63-94
PUBLISHED 14 JANUARY 2010
http://www.demographic-research.org/Volumes/Vol22/3/ DOI: 10.4054/DemRes.2010.22.3
Research Article
Masculine sex ratios, population
age structure and the potential
spread of HIV in China
M. Giovanna Merli
Sara Hertog
© 2010 M. Giovanna Merli & Sara Hertog.
This open-access work is published under the terms of the Creative Commons Attribution NonCommercial License 2.0 Germany, which permits use, reproduction & distribution in any medium for non-commercial purposes, provided the original author(s) and source are given credit.
1 Introduction 64
2 Sex ratios at birth, age-sex structure distortions and sexual behavior 66
3 Data and methods 68
3.1 Data and methods 68
3.2 Model inputs 70
3.2.1 Demographic inputs (Table 1) 70
3.2.2 Behavioral inputs 73
3.2.3 Biological inputs 75
3.3 Scenarios s 76
4 Results 78
5 Summary and discussion 83
6 Acknowledgements 86
Masculine sex ratios, population age structure and
the potential spread of HIV in China
M. Giovanna Merli1
Sara Hertog2
Abstract
There is much speculation regarding the contribution of China’s changing demography to the spread of HIV/AIDS. We employ a bio-behavioral macrosimulation model of the heterosexual spread of HIV/AIDS to evaluate the roles that China’s unique demographic conditions -- (1) masculine sex ratios at birth and (2) a population age structure that reflects rapid fertility decline since the 1970’s -- play in altering the market for sexual partners, thereby potentially fueling an increase in behaviors associated with greater risk of HIV infection. We first simulate the relative contributions of the sex ratio at birth and the population age structure to the oversupply of males in the market for sexual partners and show that the sex ratio at birth only aggravates the severe oversupply of males which is primarily a consequence of the population age structure. We then examine the potential consequences of this demographic distortion for the spread of HIV infection and show that, to the extent that males adapt to the dearth of suitable female partners by seeking unprotected sexual contacts with female sex workers, the impact of the oversupply of males in the sexual partnership market on the spread of HIV will be severe.
1 Sanford School of Public Policy and Department of Sociology, Duke University. Address all correspondence
2 United Nations Population Division. The views expressed in this paper do not necessarily reflect those of the
1. Introduction
At the end of 2007, China’s HIV/AIDS epidemic was classified as “low level”, with an estimated 700,000 people living with HIV, corresponding to 0.05 percent of the adult population (UNAIDS 2008). While until now HIV in China has been concentrated among relatively well-defined population subgroups, such as users of injected drugs, former plasma and blood donors and female sex workers and their clients (State Council AIDS Working Committee Office 2007; Wu, Rou, and Cui 2004), new evidence suggests that HIV is spreading from these traditional high-risk groups to the general population through heterosexual contact. The proportion of HIV infections resulting from heterosexual transmission is growing, such that these accounted for half of all new cases in 2005 (MOH, UNAIDS and WHO 2006, Kerr 2005). Heterosexual transmission between high-risk groups and the general population is especially evident in the southern regions of the country, where China’s HIV epidemic first took root (Gill, Huang, and Lu 2007; MOH, UNAIDS and WHO 2006; Lin et al. 2008).
The extent to which HIV will continue to spread to the general population in China depends largely on the levels and distribution of sexual activity. Results of an empirically grounded compartmental model suggested that in China, overall levels of sexual activity (identified by the rate of partner change) and the fraction of the population with multiple partners would have to be significantly higher than those currently observed in order for HIV prevalence to exceed one percent at any time during a 50-year simulation cycle (Merli et al. 2006). These results, however, do not imply that concerns about continued spread of HIV in China’s general population are unwarranted. On the contrary, there are good reasons to suspect that sexual activity in China could contribute to a larger, more widespread HIV epidemic in the future. For example, China’s increasingly liberal social and economic environment includes increasing prevalence of higher-risk sexual behaviors, such as casual or concurrent partnerships and commercial sexual activity (Farrer 2002; Sigley and Jeffreys 1999, Parish, Mojola, and Laumann 2007). In addition, as will be explored in this paper, it has been suggested that China’s unique demographic conditions have the potential to further influence the sexual landscape in such a way as to place an increasing proportion of the population at risk for HIV infection.
same age, the availability of sexual partners is a function of both the sex ratio at birth and the relative survival of males and females in the cohort. In China, where social norms tend toward men partnering with younger women, partner availability is further determined by the age structure of the population, which reflects shrinking cohorts as a result of the country’s very rapid fertility transition (Tuljiapurkar, Li, and Feldman 1995; Goodkind 2006). Owing to their inability to find a suitable partner, unattached males are anticipated to adopt risky sexual behaviors, namely multiple partnerships and patronage of commercial sex, thereby increasing the potential for HIV spread in the population.
In this paper, we explore the implications of these two demographic conditions for changes in the market for sexual partnerships, alterations in individual sexual behaviors elicited by these changes, and implications for the potential heterosexual spread of HIV. We employ a mathematical model used previously to assess the role of sexual transmission for the spread of HIV in China (Merli et al. 2006). By uniting a population projection with an epidemiological model of HIV transmission, the model allows us to simulate concurrently three related processes over time: population change, the sexual partnership market, and the HIV epidemic. Input parameters draw upon a diverse set of empirical data sources variously describing China’s demographic characteristics, patterns and trends in partnership formation and sexual behavior, and the epidemiology of HIV/AIDS. Although mathematical models of HIV transmission dynamics have been largely unsuccessful in accurately reproducing epidemic curves (Leclerc and Garenne 2007) and have proven inadequate to accurately predict the course of the Chinese epidemic (Merli et al. 2006), they are useful for understanding the dynamic relationship between macro-demographic changes and micro-behavioral adaptations and their implications for the spread of HIV.
2. Sex ratios at birth, age-sex structure distortions and sexual
behavior
China’s sex ratios at birth, the number of males born for every 100 females have risen sharply since the early 1980s as an expression of strong son preference, low fertility desires and the quantitative constraints imposed by the one child policy (Zeng et al. 1993; Gu and Roy 1995; Coale and Banister 1994; Cai and Lavely 2003; Banister 2004). This reported shortage of girls is produced by the widespread practice of sex selective abortion, made possible by the availability, as of the late 1980s, of ultrasound machines which permit identification of the sex of the fetus in utero, and by underreporting of daughters in censuses and surveys (Zeng et al. 1993; Merli 1998, Merli and Raftery 2000; Cai and Lavely 2003; Scharping 2003, 2007). The sex ratio at birth recorded in China’s 2000 population census (short form) was 116.9 male births per 100 female births (Banister 2004), a rise from 107.6 in 1982 and 111.0 in 1990 and an indication of a growing imbalance.
Today and in the coming decades, the children born into this climate of strong son preference are reaching adulthood. According to the United Nations population projections for China, there were 106 men aged 15-49 for every 100 women in that same age group in 2000 and that ratio is expected to increase to over 115 men for every 100 women by 2030 (United Nations 2009). Male cohorts born into the imbalanced sex ratios at birth today are hypothesized to encounter a shortfall of female partners upon entering the marriage market. It is expected that the marriage sex ratio will be further distorted by the age structure of the population given fixed social norms that males be older than their female partners coupled with prolonged fertility decline that has reduced the size of successive birth cohorts. According to both the United Nations and the 2000 China Health and Family Life Survey (CHFLS), the first population-based nationally representative sexual behavior survey of 20-64 year olds ever conducted in China (Parish et al. 2003; Parish, Mojola, and Laumann 2007), estimates of the singulate mean age at marriage (SMAM) for China indicate that males tend to marry females who are approximately an average of two years their junior. This norm, combined with China’s dramatic fertility decline from more than 6 children per woman in the early 1970s to well below the replacement level of 2.1 children per woman today means that men who reach sexually active ages after 2000 come from earlier and larger birth cohorts than their younger female partners. Thus, it is expected that China’s age structure contributes to the oversupply of men in the market for sexual partners over and above what results from the masculine sex ratio at birth alone.3 It has been
3 The sex ratio of the adult population is also a function of differentials survival of male and female. Since the
estimated that the imbalance in the sex ratio at birth alone in the 1990 census would result in a surplus one million men annually unable to find wives after the year 2010 (Tuljapurkar, Li, and Feldman 1995). Hudson and den Boer (2004:176) figure that by 2020 China will be home to between 29 and 33 million surplus males between the ages of 15 and 34, which would account for between 14 and 16 percent of the total projected number of males age 15-34 for that year by the U.S. Bureau of the Census.
The implications of the marriage squeeze hypothesis consistent with variations in the size of cohorts entering the marriage market have drawn the attention of scholars and the media alike. The media, in particular, are prone to accept such general statements as “unbalanced numbers inexorably produce unbalanced behaviors” (cited in Thompson 1974:153; e.g. CNN World News 2007). Various scenarios of social dislocations as a consequence of an oversupply of men have been described. Dominant among these is the suggestion that a deficit of female partners will contribute to men’s social isolation, drive them to adopt high-risk sexual behaviors such as patronage of commercial sex, or to seek their partners among increasingly younger pools of women (Tucker et al. 2005; Hudson and den Boer 2004; Hesketh and Zhu 2006). Economic models of marriage and prostitution also posit a link between surplus males and a market for commercial sex. These models portray mate selection as a market process (Edlun and Korn 2002), assume that women seek wealth from their male partners, that men value traits associated with female fertility, that the cost of reproductive sex for men is higher than that of commercial sex, and that wives and prostitutes are drawn from the same pool of female partners available to men. According to these models, a masculine sex ratio on entrance to the marriage market can make prostitution more
profitable relative to marriage. With a smaller pool of women relative to men, reproductive sex becomes scarcer and sex with prostitutes more desirable.
Yet accommodations of surplus males to the dearth of suitable female partners are mostly limited to the realm of hypotheses. Direct empirical support for the link between unbalanced sex ratios and the prevalence of specific risky sexual behaviors is not available, except perhaps as suggested by the results of ecological analyses of urban populations which reveal a positive association between masculine sex ratios in the adult population and the prevalence of sexually transmitted diseases (STDs) and HIV (Over 1998; Aral et al. 2006) or by circumstantial associations between highly masculine sex ratios of the adult population and the growth of prostitution highlighted by historical studies of 1930’s Shanghai (Hershatter 1997: 40) and late 19th century’s
American Far West (Courtwright 1991:474). In the absence of a solid empirical basis to ground the types of behavioral adaptations to be simulated, we have translated the adaptations to sex imbalances in the partnership market suggested or hypothesized in the literature into inputs driving simulations of the spread of HIV/AIDS.
3. Data and methods
3.1 Model structure
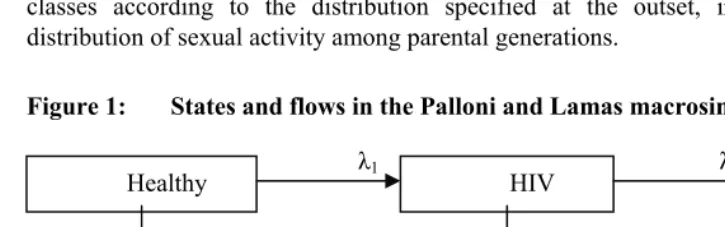
We use an existing deterministic model, built upon a two-sex cohort component population projection, first developed by Palloni and Lamas (1991) to simulate the heterosexual spread of HIV. For the purposes of these analyses, the original model has been modified to represent the Chinese pattern of sexual relations (Merli et al. 2006), to accommodate multiple scenarios of sexual activity and sexual mixing (Hertog 2007), and, in the present paper, to estimate the number of surplus males unable to find a partner as a result of age-sex demographic imbalances.
The model defines six distinct populations: urban males, urban prostitute females, urban prostitute females, rural males, rural prostitute females and rural non-prostitute females. Males and non-non-prostitute females are allocated into homogenous “sexual activity classes” defined by the number of non-prostitute partners acquired in a year. For this application, the model considers only two sexual activity classes: monogamous and non-monogamous. Both monogamous and non-monogamous males may have contact with prostitutes in addition to their non-prostitute partner(s). Prostitute females do not have regular non-commercial partners in addition to their clients.
symptomatic AIDS) and from those states to death (Figure 1). The transition rates are determined by a set of demographic, biological and behavioral parameters and are described by a set of differential equations, presented in detail elsewhere (Palloni and Lamas 1991; Palloni 1996). New entrants (births) are allocated into sexual activity classes according to the distribution specified at the outset, independent of the distribution of sexual activity among parental generations.
Figure 1: States and flows in the Palloni and Lamas macrosimulation model
Healthy HIV AIDS
Death
λ1 λ2
μ1
μ2
μ3
The shape of the probability distribution of urban and rural females entering into prostitution with each projection cycle is drawn from a Coale-McNeil marriage function and the proportion of a female cohort who will eventually engage in prostitution can be approximated by the proportion of prostitutes in the female population. Prostitution is an absorbing state—women do not transition back into the general population of non-prostitute females.
3.2 Model inputs
Baseline parameter values are displayed in Tables 1 and 2. Simulated scenarios reflect a variety of values selected for the demographic parameters associated with the sex ratio at birth and behavioral parameters associated with partner age preference, the frequency of contacts with prostitutes and protective behaviors related to the use of condoms with prostitutes.
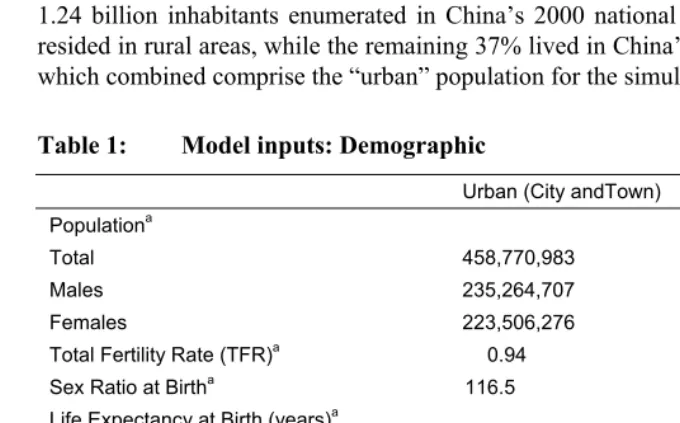
3.2.1 Demographic inputs (Table 1)
The baseline population is defined according to the age- and sex-specific population distributions in China’s rural and urban areas as enumerated in the 2000 Census. Of the 1.24 billion inhabitants enumerated in China’s 2000 national population census, 63% resided in rural areas, while the remaining 37% lived in China’s cities and urban towns, which combined comprise the “urban” population for the simulation model.
Table 1: Model inputs: Demographic
Urban (City andTown) Rural
Populationa
Total 458,770,983 783,841,243
Males 235,264,707 405,011,262
Females 223,506,276 378,829,981
Total Fertility Rate (TFR)a 0.94 1.43
Sex Ratio at Birtha 116.5 121.7
Life Expectancy at Birth (years)a
Males 74.0 69.0
Females 78.3 72.4
Annual migration rate from (%) 0.66 0.87 Median age at sexual debutb
Males 22 22
Females 22 22
Mean age difference b/w partners (years)b 1.8 1.8
Women who are prostitutes (%)c 2.0 2.0
a Unadjusted rates from 2000 census b From CHFLS
Demographic rates, including fertility, age- and sex-specific non-AIDS mortality and internal migration between rural and urban areas are based on the unadjusted estimates obtained from China’s 2000 census. The decision not to adjust the fertility data could be readily disputed. China’s TFR recorded in the 2000 census (short form) of 1.35 children per woman (0.938 in urban areas and 1.43 in rural areas) is believed to be too low. Adjusted estimates range from 1.4 to 1.8 (Retherford et al. 2005). These adjustments generally account for the number of children, especially female children, underreported in the census as a consequence of policies that hold family planning officials responsible for achieving pre-set targets and quotas within their jurisdiction (Goodkind 2004; Merli, Qian, and Smith 2004; Merli and Raftery 2000). An adjustment of the TFR would necessitate an adjustment of the age sex distribution of the population for the truly missing children and a downward adjustment of the sex ratio at birth if underreporting of female children is especially severe (Goodkind, forthcoming). In line with a larger number of underreported female births relative to male births, Goodkind and West (2007)’s adjustment brought the 2000 census sex ratio at birth down from 116.9 to 114. Because of the wide range of adjustment procedures and underlying assumptions and because the published adjustments are made on total population counts while our simulations would require separate adjustments for urban and rural areas, our preferred strategy is to accept the unadjusted census figures as the baseline. We are of course aware that an underreported TFR and an overreported sex ratio at birth in the 2000 census due to underreporting of baby girls will affect the size of the cohorts initiating sexual activity about 20 years later. Most relevant to our analysis, we might overestimate the size of the male cohorts relative to the female cohorts in the same age groups since it is unrealistic to assume that births are no more underreported for one sex than the other.
For the baseline simulation scenario, we project sex imbalances in availability of sexual partners, assuming constant fertility, a constant sex ratio at birth (116.5 in urban areas and 121.7 in rural areas), constant non-AIDS mortality, constant migration flows between rural and urban areas and an age schedule of sexual debut drawn from the CHFLS.4 We assume an enduring social norm that males be two years older than their
female partners on the average, according to the age differences between sexual
4 Alternatively, we could have used an age-specific marriage schedule in order to define the available pool of
partners reported in the CHFLS. This gap is consistent with the average age difference between partners indicated by the singulate mean age at marriage (SMAM) in 1999 of 24.8 years for men and 23.1 years of age for women (United Nations World Population Database), and with a SMAM for those marrying by age 30 in 2000 of 25.2 for men and 23.2 for women, an age difference at peak marital ages that endured throughout the 1990s (Goodkind 2006).
Population movement between rural and urban areas is driven by the annual rural-to-urban and urban-to-rural migration rates approximated based on information on destination for 78,756,500 floating intercounty migrants and on information on origin and destination for 65,634,248 intracounty migrants enumerated in the 2000 census. In the five years leading up to the 2000 census, approximately 0.66% of the total urban (city and town) population migrated annually to a rural area, while 0.87% of the total rural population migrated to an urban location each year.5 The age and sex distribution
of migrants corresponds to that reported in the 2000 census micro data as presented by Liang and Ma (Table 4, 2004).
We set the number of female sex workers in China at 6 million women ages 15-39 (Horizon Market Research and Futures Group Europe 2002). This widely cited estimate lies approximately in the middle of a range of estimates of 1 to 10 million female sex workers in China (Huang et al. 2004; Schafer 2003; Yuan et al. 2002). In our model, female prostitutes are found in both urban (cities and towns) and rural areas (counties), consistent with evidence from numerous studies of female sex workers that suggest the widespread availability of commercial sex across urban and rural China (Hong and Li 2007; Wang et al. 2009). Six million female prostitutes corresponds to about 2.2 percent of the total female population between ages 15 and 39, and 1 percent of the total female population of all ages. This figure falls in the middle of a range given by Lim (1998) who estimated that in Indonesia, Malaysia, the Philippines and Thailand between 0.25 and 1.5 percent of the total female population worked as a prostitute. The 15-39 age range of prostitutes in our simulations is wider than that taken from a review of studies based on samples of sex workers in entertainment establishments where the mean age of female prostitutes oscillated between 23 and 25, with most in their
late-5 These rates were calculated by dividing the migration flows from urban to rural areas and from rural to
teens and early- to mid-twenties (Hong and Li 2008). The broader width of our simulated age range of female prostitutes is informed by recent studies which employed sampling approaches intended to reach the most hidden pockets of this population who are not establishment-based (e.g. road-side sex workers) and whose age is as high as the upper thirties and early forties (Huang et al. 2004; Ding et al. 2005; Merli et al. 2008).
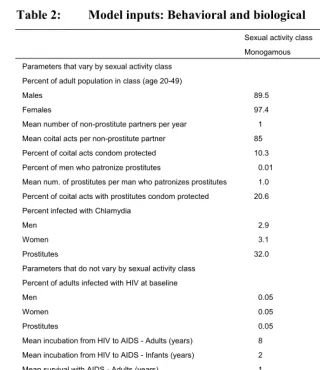
3.2.2 Behavioral inputs
The sexual behavior inputs are drawn primarily from the CHFLS and are presented in top half of Table 2. The CHFLS was conducted in 2000 and collected 3,821 completed interviews from 5,000 individuals sampled from registers of households and temporary migrants held by urban neighborhoods and rural townships across China (Parish et al. 2003).
In our simulated scenarios, membership in a sexual activity class is determined by the number of non-prostitute partners drawn from CHFLS data for two groups: individuals in the monogamous class reported only one non-prostitute partner in the year leading up to the survey, while individuals assigned to the non-monogamous class reported more than one non-prostitute partner in the previous year (2.29 partners on average). According to the CHFLS, 10.5% of adult males and 2.6% of adult females belonged to the non-monogamous sexual activity class at the time of the survey. For the purposes of simulation, non-prostitute partners are assumed to be selected from the pool of available partnerships in the population, without regard to sexual activity class (i.e., proportionate mixing between classes) (Garnett and Anderson 1993).
Table 2: Model inputs: Behavioral and biological
Sexual activity class
Monogamous Non-monogamous
Parameters that vary by sexual activity class
Percent of adult population in class (age 20-49)
Males 89.5 10.5
Females 97.4 2.6
Mean number of non-prostitute partners per year 1 2.29
Mean coital acts per non-prostitute partner 85 89
Percent of coital acts condom protected 10.3 14.0
Percent of men who patronize prostitutes 0.01 37.7
Mean num. of prostitutes per man who patronizes prostitutes 1.0 1.4
Percent of coital acts with prostitutes condom protected 20.6 28.0
Percent infected with Chlamydia
Men 2.9 2.0
Women 3.1 1.3
Prostitutes 32.0 na
Parameters that do not vary by sexual activity class
Percent of adults infected with HIV at baseline
Men 0.05
Women 0.05
Prostitutes 0.05
Mean incubation from HIV to AIDS - Adults (years) 8
Mean incubation from HIV to AIDS - Infants (years) 2
Mean survival with AIDS - Adults (years) 1
Mean survival with AIDS - Infants (years) 1
Probability of vertical transmission (%) 30
Condom efficacy (%) 80
Per-contact transmission probability
Male-to-female 0.0015
Female-to-male 0.0009
Chlamydia cofactor 2.25
Increased infectiousness if recently infected of symptomatic 3
Sources: CHFLS; UNAIDS 2004; van den Hoek et al. 2001; Downs and De Vincenzi 1996; Ambroziak and Levy 1999; Bracher, Santow, and Watkins 2003; Fleming and Wasserheit 1999; Chau, Yip, and Cui 2003; Churat et al. 2000.
non-prostitute partner in the year, 37.7% reported having purchased the services of a prostitute. Unfortunately, because information on condom use with prostitutes is missing for about 80 per cent of men who reported having paid for sex in the previous year in the CHFLS, we assumed the proportion of condom protected sexual acts with prostitutes to be twice that with non-prostitute partners, to reflect typically higher condom use with prostitutes than with regular partners.
3.2.3 Biological inputs
The biological inputs which drive the simulations are shown in the bottom half of Table 2. At the outset of the simulation, we seed the Chinese population with approximately 700,000 HIV cases according to the age distribution of HIV cases recorded for the Thai population (UNAIDS 2004). This number corresponds to the most recent estimates for China, equivalent to an adult prevalence rate of 0.05%. The population of prostitutes is also seeded with HIV according to the same low HIV prevalence. Except for the very small fraction infected, the remainder of the simulated population begins the simulation period with no HIV and is introduced to the risk of infection during the simulation period only through heterosexual contacts with infected partners.
We assume a default baseline per-coitus probability of male-to-female HIV transmission of 0.0015 and a probability of female-to-male transmission of 0.0009. These are the frequently cited probabilities of transmission of HIV per single unprotected coitus estimated from a highly controlled study design of 525 HIV-discordant European couples (Downs and De Vincenzi 1996). Infectivity of HIV is higher among infected individuals who have recently acquired HIV or in individuals who have symptomatic AIDS because of the higher viral load in these two stages (Ambroziak and Levy 1999; Pilcher et al. 2004). For the simulations, we posit that HIV is trebly infectious during the first year after seroconversion and again after progression to AIDS (Mastro and de Vincenzi 1996; Ambroziak and Levy 1999).
HIV infectivity also depends on the existence of other STDs, both ulcerative (syphilis, chancroid, and genital herpes) and discharge (gonorrhoea, chlamydia, and bacterial vaginosis) diseases. These other STDs enhance the infectiousness of HIV by increasing its concentration in genital ulcer exudates or in seminal plasma, or by increasing HIV shedding in the genital tract (Fleming and Wasserheit 1999). STD-infected individuals also have an increased susceptibility to HIV. In our simulated population, HIV is 2.25 times more infectious in individuals with chlamydia.
infectivity per coital act by the chlamydia infectivity cofactor. At the onset of the simulation period, males and non-prostitute females are assigned a unique chlamydia prevalence estimated from the CHFLS, which is assumed constant throughout the simulation period. The chlamydia prevalence value assigned to prostitutes was drawn from epidemiological studies of prostitute populations in southern China (van den Hoek et al. 2001). We further assumed that partnerships are formed randomly without regard to chlamydia infection status. The average HIV infectivity enhanced by co-infection with chlamydia for each group was then determined by the probability of HIV transmission per coital act, that group’s own chlamydia prevalence, the chlamydia prevalence among partners, and the chlamydia infectivity cofactor. Computational examples of the average HIV infectivity with co-infection of chlamydia were first illustrated by Bracher, Santow, and Watkins (2003) and were also presented in Merli et al. (2006).
Condom use and condom efficiency protect against HIV by reducing infectivity per sexual act (Saracco et al. 1993; Seidlin et al. 1993; Ahmed et al. 2001). For these simulation scenarios, we assume that condoms are 80 percent effective at preventing HIV transmission.
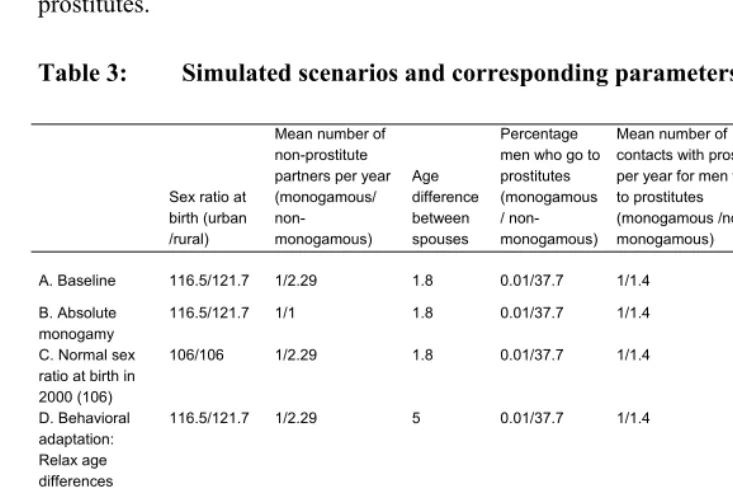
3.3 Scenarios
We simulated scenarios with variable demographic and behavioral parameters in order to assess the effect of demographic conditions on the availability of suitable female partners for males and associated HIV prevalence and the effect of behavioral adaptations to the shortfall of available female partners on the spread of HIV.
partners in the baseline scenario and simulated a relaxation of the age preference for female partners (Scenario D) and, in Scenario E, an increase in the number of annual contacts with prostitutes for men who face a shortfall of regular female partners to equal half the number of contacts they would have had with their (forgone) regular non-prostitute partners. The last scenario (Scenario F) introduced a protective behavioral adaptation by raising to 80 percent the percentage of contacts with prostitutes which are condom protected for men who had replaced their forgone regular partners with prostitutes.
Table 3: Simulated scenarios and corresponding parameters
Sex ratio at birth (urban /rural)
Mean number of non-prostitute partners per year (monogamous/ non-monogamous) Age difference between spouses Percentage men who go to prostitutes (monogamous / non-monogamous)
Mean number of contacts with prostitutes per year for men who go to prostitutes (monogamous /non-monogamous)
Percent coital acts with prostitutes condom protected (monogamous/ non-monogamous)
A. Baseline 116.5/121.7 1/2.29 1.8 0.01/37.7 1/1.4 20.6/27.9
B. Absolute monogamy
116.5/121.7 1/1 1.8 0.01/37.7 1/1.4 20.6/27.9
C. Normal sex ratio at birth in 2000 (106)
106/106 1/2.29 1.8 0.01/37.7 1/1.4 20.6/27.9
D. Behavioral adaptation: Relax age differences between spouses (years)
116.5/121.7 1/2.29 5 0.01/37.7 1/1.4 20.6/27.9
E. Behavioral adaptation: Increase contact rates with prostitutes
116.5/121.7 1/2.29 1.8 varies 42.5/44.5 20.6/27.9
F. Behavioral adaptation: 80% condom use with prostitutes
4. Results
Our scenario outcomes, presented separately for the urban and rural populations, include the number of males’ desired partnerships unfulfilled and the associated adult HIV prevalence rates. The results are given in tabular form in Tables 4 and 5 and are plotted in Figures 2-4 over a 50-year horizon.
Table 4: Number of unfulfilled male partnerships according to different scenarios by year of projection (millions)
Year 0 Year 10 Year 20 Year 30 Year 40 Year 50
Urban Rural Urban Rural Urban Rural Urban Rural Urban Rural Urban Rural A. Baseline 22.50 32.77 24.71 30.34 25.27 35.13 24.73 34.17 23.66 34.86 18.34 27.32
B. Absolute monogamy
12.36 18.01 12.94 15.99 13.30 20.27 14.73 22.43 14.82 24.52 11.24 19.22
C. Normal sex ratio at birth in 2000 (106)
22.49 32.76 24.68 30.34 25.31 35.10 23.44 30.73 20.08 25.95 13.10 15.01
D. Behavioral adaptation: Relax age differences between spouses (years)
21.92 30.75 23.68 29.43 24.18 33.78 23.83 33.52 21.52 32.36 17.50 26.49
E. Behavioral adaptation: Increase contact rates with prostitutes
22.50 32.77 24.75 30.38 24.83 34.76 23.56 32.69 21.68 32.38 16.74 25.35
F. Behavioral adaptation: 80% condom use with prostitutes
22.50 32.77 24.72 30.34 25.16 35.04 24.55 33.92 23.43 34.54 18.19 27.13
Table 5: Simulated adult HIV prevalence (% aged 18-49) according to
different scenarios by year of projection
Year 0 Year 10 Year 20 Year 30 Year 40 Year 50
Urban Rural Urban Rural Urban Rural Urban Rural Urban Rural Urban Rural
A. Baseline 0.09 0.09 0.62 0.70 0.70 1.00 0.84 0.89 0.93 0.89 0.94 0.90 B. Absolute
monogamy 0.09 0.09 0.18 0.17 0.03 0.03 0.00 0.00 0.00 0.00 0.00 0.00 C. Normal sex
ratio at birth in
2000 (106) 0.09 0.09 0.81 0.90 0.89 1.24 1.02 1.09 1.16 1.12 1.24 1.24 D. Behavioral
adaptation: Relax age differences between
spouses (years) 0.09 0.09 0.63 0.73 0.74 1.08 0.89 0.98 1.04 1.06 1.06 1.11 E. Behavioral
adaptation: Increase contact rates
with prostitutes 0.09 0.09 1.00 1.00 2.25 2.49 3.70 3.79 4.26 4.27 3.82 3.96 F. Behavioral
adaptation:80% condom use
Figure 2: Simulated unfulfilled partnerships and adult HIV prevalence under monogamy and heterogeneity in sexual activity
0 5 10 15 20 25 30 35 40 45 50
0 5 10 15 20 25 30 35 40 45 50
0% 1% 2% 3% 4% 5%
0 5 10 15 20 25 30 35 40 45 50
Urban: Adult HIV prevalence Rural: Adult HIV prevalence
Simulation year Simulation year
A: Total monogamy B: Heterogeneity in sexual activity (BASELINE)
0 5 10 15 20 25 30 35 40 45 50
0 5 10 15 20 25 30 35 40 45 50
0% 1% 2% 3% 4% 5%
0 5 10 15 20 25 30 35 40 45 50
x
Urban: Number of desired partnerships (male) unfulfilled (millions) Rural: Number of desired partnerships (male) unfulfilled (millions)
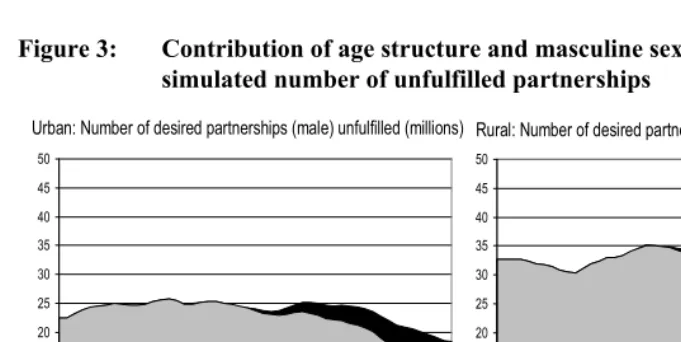
important in the second half of the period, especially in rural areas, as those born under the masculine sex ration at birth of 121.7 (Table 1) since 2000 become sexually active.6
Of the 27.3 million unfulfilled male partnerships in the rural population in the 50th year
simulated with baseline inputs (Scenario A), 15 million (55 percent of the total) can be attributed to the age structure (compare Scenario A and Scenario C in Table 4) and the remaining 12.3 million (45 percent) to the masculine sex ration at birth. In urban areas, where the sex ration at birth is lower, of the 18.3 million unfulfilled male partnerships, 13.1 million (71 percent) are attributable to the age structure while only 5.2 million (29 percent) can be attributed to the masculine sex ratio at birth.
Figure 3: Contribution of age structure and masculine sex ratio at birth to the
simulated number of unfulfilled partnerships
0 5 10 15 20 25 30 35 40 45 50
0 5 10 15 20 25 30 35 40 45 50
Simulation year
0 5 10 15 20 25 30 35 40 45 50
0 5 10 15 20 25 30 35 40 45 50
Simulation year
Unfulfilled partnerships attributable to age structure
Unfulfilled partnerships attributable to masculine sex ratio at birth
Urban: Number of desired partnerships (male) unfulfilled (millions) Rural: Number of desired partnerships (male) unfulfilled (millions)
In Figure 4 we considered the implications of potential adaptive behaviors adopted by men who are unable to attain their desired number of regular female partners. Consistent with the experience of other countries where the marriage market adapted to imbalances in the sex structure with a relaxation in age preferences between partners (Bhrolcháin 2001), scenario D describes the consequences of allowing men to increase
6 This decomposition assumes no abnormally masculine sex ration at birth before 2000. Sex ratios at birth,
their available pool of female partners by relaxing their age preferences and seeking partners up to five years their junior (as opposed to an average of two years in baseline scenario A). Because the dearth of suitable female partners is severe, relaxing norms about age differences between partners only yields small declines in the number of desired male partnerships unfulfilled in both rural and urban areas, ranging from a difference of half a million to a difference of 2 million fewer partnerships unfulfilled in urban areas and from less than half a million to 2.5 million in rural areas. Age differences between partners have also been shown to have an effect on the dynamics of the epidemic because they facilitate the intergenerational chain of HIV transmission (Anderson 1992; Palloni 1996; Morris 1997). Yet the rise in HIV prevalence simulated under relaxed age preferences for partners is very small, from just below 1 percent to just above 1 percent, and is due to increased exposure to HIV infection implied by the higher number of fulfilled partnerships in Scenario D.
Figure 4: Simulated unfulfilled partnerships and adult HIV prevalence with
behavioral adaptations 0 5 10 15 20 25 30 35 40 45 50
0 5 10 15 20 25 30 35 40 45 50
0% 1% 2% 3% 4% 5%
0 5 10 15 20 25 30 35 40 45 50
Urban: Adult HIV prevalence Rural: Adult HIV prevalence
Simulation year Simulation year
0 5 10 15 20 25 30 35 40 45 50
0 5 10 15 20 25 30 35 40 45 50
0% 1% 2% 3% 4% 5%
0 5 10 15 20 25 30 35 40 45 50
D: Relax age preferences to partners within 5 years of age
E: Males unable to find partners instead go to prostitutes B: Heterogeneity in sexual partnering (BASELINE)
Urban: Number of desired partnerships (male) unfulfilled (millions) Rural: Number of desired partnerships (male) unfulfilled (millions)
Scenario E in Figure 4 simulates the spread of HIV if surplus men unable to attain their desired number of regular partnerships replaced those forgone partnerships with prostitute partners. Under this scenario, men have sex with prostitutes with half the frequency as with non-prostitute partners and the proportion of their condom protected contacts with prostitutes is twice that with regular partners. Simulated HIV prevalence is highly sensitive to the adoption of this risky behavior. The greater percentage of men seeking contacts with prostitutes associated with changes in the simulated fraction of men with desired partnerships unfulfilled in each simulation cycle (because in this scenario men unable to find a regular partner turn to prostitutes instead), combined with a much higher frequency of annual contacts with prostitutes (42.5/44.5), indicates the potential for an explosive epidemic in both the urban and rural populations. Scenario F evaluates the impact of an exogenous policy intervention aimed at increasing the frequency of condom use in sexual acts with prostitutes. This scenario assumes that such a program would lead to the use of condoms in 80 percent of sexual acts between prostitutes and their patrons, with 80 percent effectiveness. This figure is in line with the program for 100-per-cent condom use implemented by the Thai Ministry of Health in the early 1990s (Rojanapithayakorn and Hanenberg 1996). A major decline in the size of the epidemic is seen with this policy intervention, even with high levels of male patronage of commercial sex and frequent contacts with prostitutes. The epidemic is cut to about one fourth of that simulated in the absence of any targeted intervention, close to its size prior to the adoption by surplus males of risky behaviors in response to the deficit of female partners.
5. Summary and discussion
Although injected-drug use and contaminated blood products have been until recently the major drivers of HIV transmission in China, heterosexual transmission is contributing an increasingly important share of infections (recently accounting for up to 50% of new infections). An assessment of conditions that may put an increasing fraction of individuals at risk of HIV infection through heterosexual transmission is timely.
people who engage in sexual behaviors that place an increasing proportion of the population at risk for HIV infection, such as multiple sexual partnerships and patronage of prostitution.
We have employed a mathematical simulation model that unites a population projection with an epidemiological model of HIV transmission to concurrently represent three related processes over time: population change, the sexual partnership market, and the HIV epidemic. Model parameters were extracted from diverse data sets including China’s most recent census completed in 2000 and the CHFLS. By utilizing inputs specific to the Chinese context in a macrosimulation model describing the heterosexual spread of HIV in a population, we were able to evaluate the effects of China’s macro-demographic conditions on the marriage and sexual partnership markets, and their implications for the adoption of sexual behaviors associated with HIV transmission and spread.
Our results illustrate the implications of demographic imbalances unique to the Chinese context for the potential spread of HIV in China. They are not meant to be predictive of the future of HIV prevalence in the world’s largest population. Although the mathematical model we employ is a useful tool to concurrently describe the process of population change, the sexual partnership market, and the spread of HIV over time, the model and the data which inform its parameters have several limitations. First, simulation outcomes are very sensitive to the assumptions considered, first among which is the level of sexual activity. The CHFLS may understate the level of sexual activity owing to an understatement of stigmatized behavior, a feature generally common to surveys of sexual behavior, especially among women (Buvé et al. 2001; Mensch, Hewett, and Erulkar 2003; Curtis and Sutherland 2004). In previous work we have shown the sensitivity of simulated HIV prevalence to changes in the levels of sexual activity, with a larger epidemic produced by a hypothetical higher rate of partner change consistent with levels of sexual activity observed in the U.S., which are higher than those in China (Merli et al. 2006). But understated levels of sexual activity also have implications for the simulated number of unfulfilled partnerships. If, for example, Chinese women are more likely than their male counterparts to understate the number of their regular partners, which, in our model, represent the number of desired male partners, the number of males’ desired partnerships unfulfilled will be overestimated. In our behavioral adaptation scenario where men replace their forgone regular partnerships with prostitutes, this would imply that the effect of age-sex demographic imbalances on the spread of HIV will be overestimated.
Second, the model suffers from the limitations characteristic of a macrosimulation model. All partnerships are formed anew each year as reflected in the aggregate sizes of the population subgroups and the numbers of desired partnerships fulfilled. Thus, unlike a microsimulation which follows a partnership formed between two individuals through their lives and enables one to realistically carry over the partnership squeeze through successive cohorts, a macrosimulation model which deals only with groups and proportions simply enables us to compare the number of partnerships men would like to have to the number of partnerships made available by women in a given year.
representation of the lives of these women, we do not yet have a set of rules and appropriate empirical data that will allow us to realistically depict the often temporary, cyclical nature of prostitution in women’s lives, or their sexual relationships with different types of partners.
6. Acknowledgements
References
Ahmed, S., Lutalo, T., Wawer, M., Serwadda, D., Sewankambo, N., Nalugoda, F., Makumbi, F., Wabwire-Mangen, F., Kiwanuka, N., Kigozi, G.,Kiddugavu, M., and Gray, R. (2001). HIV incidence and sexually transmitted disease prevalence associated with condom use: A population study in Rakai,Uganda. AIDS 15(16): 2171-2179. doi:10.1097/00002030-200111090-00013.
Ambroziak, J. and Levy, J.A. (1999). Epidemiology, natural history, and pathogenesis of HIV infection. In: Holmes, K.K., Mårdh, P.A., Sparling P., and Wiesner P.J. (eds.). Sexually transmitted diseases. Third edition. New York: McGraw-Hill: 251-258.
Anderson, R. (1992). The transmission dynamics of sexual transmitted diseases: The behavioral component. In: Dyson, T. (ed.). Sex behavior and networking: Anthropological and socio-cultural studies on the transmission of HIV. Liège: IUSSP: 23-47.
Aral, S.O., Over, M., Manhart, L., and Holmes, K.K. (2006). Sexually transmitted infections. In: Jamison, D.T., Breman, J.G., Measham, A.R., Alleyne, G., Claeson, M., Evans, D.B., Jha, P., Mills, A., and Musgrove, P. (eds.). Disease control priorities in developing countries. New York: World Bank and Oxford University Press: 311-330.
Banister, J. (2004). Shortage of girls in China today. Journal of Population Research 21(1): 19-45. doi:10.1007/BF03032209.
Banister, J. and Hill, K. (2004). Mortality in China, 1964-2000. Population Studies 58(1): 55-75. doi:10.1080/0032472032000183753.
Bhrolcháin, M.N. (2001) Flexibility in the marriage market. Population - An English Selection 13(2): 9-47.
Bracher, M., Santow, G., and Watkins, S. (2003). Moving and marrying: Modeling HIV infection among newly-weds in Malawi. Demographic Research SC1(7): 207-246. doi:10.4054/DemRes.2003.S1.7.
Buvé, A., Lagarde E., Caraël, M., Rutenberg, N., Ferry, B., Glynn, J.R., Laourou, M., Akam, E., Chege, J., and Sukwa, T. (2001). Interpreting sexual behaviour data: validity issues in the multicentre study on factors determining the differential spread of HIV in four African cities. AIDS 15(Suppl 4): 117-126.
Cai, Y. and Lavely, W. (2003). China’s missing girls: Numerical estimates and effects on population growth. The China Review 3(2): 13-29.
Chau, P.H., Yip, P.S.F., and Cui, J. (2003). Reconstructing the incidence of human immunodeficiency virus (HIV) in Hong Kong by using data from HIV positive tests and diagnoses of acquired immune deficiency syndrome. Applied Statistics 52 (2): 237–248. doi:10.1111/1467-9876.00401.
Churat, R., Manglani, M., Sharma, R., and Shah, N.K. (2000). Clinical spectrum of HIV infection. Indian Pediatrics 37: 831-836.
CNN World News. (2007). China. Too many boys? January 31, 2007.
Coale, A. and Banister, J. (1994). Five decades of missing girls in China. Demography 31(3): 459-479. doi:10.2307/2061752.
Courtwright, D. (1991). Disease, death and disorder on the American frontier. Journal of the History of Medicine and Allied Sciences 46(4): 457-492.
doi:10.1093/jhmas/46.4.457.
Curtis, S.L. and Sutherland, E.G. (2004). Measuring sexual behaviour in the era of HIV/AIDS: The experience of Demographic and Health Surveys and similar enquiries. Sexually Transmitted Infections 80(Suppl II): ii22-ii27.
doi:10.1136/sti.2004.011650.
Ding, Y., Detels, R., Zhao, Z., Zhu, Y., Zhu, G., Zhang, B., Shen, T., and Xue, X. (2005). HIV infection and sexually transmitted diseases in female commercial sex workers in China. Journal of Acquired Immune Deficiency Syndrome 38(3): 314-319.
Downs, A.M. and De Vincenzi, I. (1996). Probability of heterosexual transmission of HIV: Relationship to the number of unprotected sexual contacts. Journal of Acquired Immune Deficiency Syndrome and Human Retrovirology 11: 388-395. Edlund, L. and Korn, E. (2002). A theory of prostitution. The Journal of Political
Economy 110(1): 181-214. doi:10.1086/324390.
Farrer, J. (2002). Opening up: Youth sex culture and market reform in Shanghai. Chicago: University of Chicago Press.
Garnett, G. and Anderson, R.M. (1993). Factors controlling the spread of HIV in heterosexual communities in developing countries: Patterns of mixing between different age and sexual activity classes. Philosophical Transactions: Biological Sciences 342(1300): 137-159. doi:10.1098/rstb.1993.0143.
Gill, B., Huang, Y., and Lu, X. (2007). Demography of HIV/AIDS in China. Washington, DC: Center for Strategic and International Studies.
Goldman, N., Westoff, C.F., and Hammerslough, C. (1984). Demography of the marriage market in the United States. Population Index 50(1): 5-25.
doi:10.2307/2736903.
Goodkind, D. (2004). China’s missing children: The 2000 census underreporting surprise. Population Studies 58(3):281-295.doi:10.1080/0032472042000272348. Goodkind, D. (2006). Marriage squeeze in China: Historical legacies, surprising
findings. Paper presented at the 2006 Annual Meeting of the Population Association of America, Los Angeles, March 30-April 1, 2006.
Goodkind, D. (Forthcoming). Child underreporting, fertility, and sex ratio imbalance in China. Demography.
Goodkind, D. and West, L. (2007). China’s sex ratio at birth: Reported ratios, actual ratios, and expected trends [unpublished manuscript]. Washington, DC: International Programs Center U.S. Census Bureau.
Gu, B. and Roy, K. (1995). Sex ratio at birth in China, with reference to other areas in East Asia: What we know. Asia-Pacific Population Journal 10: 17–42.
Hershatter, G. (1997). Dangerous Pleasures. Berkeley, CA: University of California Press.
Hertog, S. (2007). Heterosexual behavior patterns and the spread of HIV/AIDS: The interacting effects of rate of partner change and sexual mixing. Sexually Transmitted Diseases 34(10): 820-828. doi:10.1097/OLQ.0b013e31805ba84c. Hesketh, T. and Zhu, W. (2006). Abnormal sex ratios in human populations: Causes
and consequences. Proceedings of the National Academy of Sciences 103(36): 13271-13275. doi:10.1073/pnas.0602203103.
Horizon Market Research and Futures Group Europe. (2002). 2001 behavioural surveillance survey in Yunnan and Sichuan: Sex workers report. Beijing: Horizon Market Research.
Huang, Y., Henderson, G.E., Pan, S., and Cohen, M.S. (2004). HIV/ AIDS risk among brothel-based female sex workers in China: Assessing the terms, content, and knowledge of sex work. Sexually Transmitted Diseases 31(11): 695–700.
doi:10.1097/01.olq.0000143107.06988.ea.
Hudson, V.M. and den Boer, A.M. (2004). Bare branches: The security implications of Asia’s surplus male population. Boston: MIT Press.
Kerr, C. (2005). Sexual transmission propels China’s HIV epidemic. The Lancet Infectious Diseases 5(8): 474. doi:10.1016/S1473-3099(05)70180-8.
Leclerc, P.M. and Garenne, M. (2007). Inconsistencies in age profile of HIV prevalence: A dynamic model applied to Zambia. Demographic Research 16(5): 121-140. doi:10.4054/DemRes.2007.16.5.
Li, X., Fang, X., Lin, D., Mao, R., Wang, J., Cottrell, L., Harris, C., and Stanton, B. (2004). HIV/STI risk behaviors and perceptions among rural-to-urban migrants in China. AIDS Education and Prevention 16(6): 538-556.
doi:10.1521/aeap.16.6.538.53787.
Liang, Z. (2007) Personal communication via e-mail, July 17, 2007.
Liang, Z. and Ma, Z. (2004). China’s floating population: New evidence from the 2000 Census. Population and Development Review 30(3): 467-488.
doi:10.1111/j.1728-4457.2004.00024.x.
Lim, L.L. (ed.) (1998). The Sex Sector. The Economic and Social Basis of Prostitution in Southeast Asia. Geneva: International Labour Office.
Lin, L., Jia, M., Ma, Y., Yang, L., Chen, Z., Ho, D.D., Jiang, Y., and Zhang, L. (2008). The changing face of HIV in China. Nature 455: 609-611. doi:10.1038/455609a. Liu, D., Liu, D., Ng, M.L., Zhou, L.P., and Haeberle, E.J. (1997). Sexual Behaviour in
Modern China: Report on the Nationwide Survey of 20,000 Men and Women. New York: Continuum 1997.
Mensch, B., Hewett, P.C., and Erulkar, A.S. (2003). The reporting of sensitive behaviour by adolescents: A methodological experiment in Kenya. Demography 40(2): 247-268. doi:10.1353/dem.2003.0017.
Merli, M.G. (1998). Underreporting of births and infant deaths in rural China: Evidence from field research in one county of Northern China. The China Quarterly 155: 637-655. doi:10.1017/S0305741000050025.
Merli, M.G. and Raftery, A. (2000). Are births underreported in rural China? Manipulation of statistical records in response to China’s population policies. Demography 37(1): 109-126. doi:10.2307/2648100.
Merli, M.G., Hertog, S., Wang, B., and Li, J. (2006). Modeling the spread of HIV/AIDS in China: The role of sexual transmission. Population Studies 60(1): 1-22.
doi:10.1080/00324720500436060.
Merli, M.G., Qian, Z., and Smith, H.L. (2004). Adaptations of a political bureaucracy to economic and institutional change under socialism: The Chinese state family planning system. Politics and Society 32(2): 231-256.
doi:10.1177/0032329204263073.
Merli, M.G., DeWaard, J., Tian, F., and Hertog, S. (2009). Migration and gender in China's HIV/AIDS epidemic. In: Tucker, J.D. and Poston, D.L. (eds.). Gender policy and HIV in China: Catalyzing policy change. New York: Springer: 27-53.
doi:10.1007/978-1-4020-9900-7_3.
Merli, M.G., Neely, W.W., Gao, E., Tu, X., Chen, X., Tian, F., Gu, W., and Yang, Y. (2008). Sampling female sex workers in Shanghai using Respondent Driven Sampling. Paper presented at the Symposium on Health, Equity and Development, Shanghai Academy of Social Sciences, Shanghai, December 19-20, 2008.
MOH, UNAIDS and WHO. People’s Republic of China Ministry of Health, Joint UN Program on HIV/AIDS and World Health Organization (WHO). (2006). 2005 update on the HIV/AIDS epidemic and response in China. Beijing: National Center for AIDS/STD Prevention and Control.
Morris, M. (1997). Sexual networks and HIV. AIDS 1997 11(Suppl. A): 209-216. Over, M. (1998). The effects of societal variables on urban rates of HIV infection in
Palloni, A. (1996). Demography of HIV/AIDS. Population Index 62(4): 601-652.
doi:10.2307/3646371.
Palloni, A. and Lamas, L. (1991). The Palloni approach: A duration-dependent model of the spread of HIV/AIDS in Africa. In: The AIDS Epidemic and its Demographic Consequences. Proceedings of the United Nations / World Health Organization Workshop on Modelling the Demographic Impact of the AIDS Epidemic in Pattern II Countries: Progress to Date and Policies for the Future. New York, December 13-15, 1989. New York, New York, United Nations, Department of International Economic and Social Affairs (ST/ESA/SER.A/119): 109-118.
Parish, W., Laumann, E.O., Cohen, M.S., Pan, S., Zheng, H., Hoffman, I., Wang, T., and Ng, K.H. (2003). Population-based study of Clamydial infection in China: A hidden epidemic. JAMA 289(10): 1265-1273. doi:10.1001/jama.289.10.1265. Parish, W.L., Mojola, S., and Laumann, E.O. (2007). Sexual behavior in China: Trends
and comparisons. Population and Development Review 33(4): 729-756.
doi:10.1111/j.1728-4457.2007.00195.x.
PCO (Population Census Office under the State Council and Department of Population, Social, Science and Technology Statistics, National Bureau of Statistics of the People’s Republic of China) (2002). Tabulations of the 2000 census of China. Beijing: China Statistics Press.
Pilcher, C.D., Tien, X.C., Eron, J.J., Vernazza, P.L., Leu, S.Y., Stewart, P.W., Goh, L.E., and Cohen, M.S. (2004). Brief but efficient: Acute HIV infection and the sexual transmission of HIV. The Journal of Infectious Diseases 189(10): 1785-1792. doi:10.1086/386333.
Retherford, R.D., Choe, M.K. Chen J., Li X., and Cui H. (2005). How far has fertility in China really declined?. Population and Development Review 31(1): 57-84. doi:10.1111/j.1728-4457.2005.00052.x.
Rojanapithayakorn, W. and Hanenberg, R. (1996). The 100% condom program in Thailand. AIDS 10(1): 1-7. doi:10.1097/00002030-199601000-00001.
Schafer, S. (2003). Not just another pretty face. Newsweek October 13, 2003.
Scharping, T. (2005). Chinese fertility trends 1979-2000: A comparative analysis of birth numbers and school data. Population Research 29(4): 2-15 (in Chinese). Scharping, T. (2007). The politics of numbers: Fertility statistics in recent decades. In:
Zhao, Z. and Guo, F. (eds.) Transition and challenge: China’s population at the beginning of the 21stcentury. London: Oxford University Press: 34-52.
Seidlin, M., Vogler, M., Lee, E., Lee, Y.S., and Dubin, N. (1993). Heterosexual transmission of HIV in a cohort of couples in New York City. AIDS 7(9):
1247-54. doi:10.1097/00002030-199309000-00015.
Sigley, G. and Jeffreys, E. (1999). On ‘sex’ and ‘sexuality’ in China: A conversation with Pan Suiming. Bulletin of Concerned Asian Scholars 31(1): 50-58.
State Council AIDS Working Committee Office, UN Theme Group on AIDS in China. (2007). A joint assessment of HIV/AIDS prevention, treatment and care in China. Beijing.
Thompson, R. (1974). Seventeenth-century English and colonial sex ratios: A postscript. Population Studies 28(1): 153-165. doi:10.2307/2173799.
Tucker, J.D., Henderson, G.E., Wang, T.F., Huang, Y.Y., Parish, W., Pan, S.M., Chen, X.S., and Cohen, M.S. (2005). Surplus men, sex work, and the spread of HIV in China. AIDS 19(6): 539-547. doi:10.1097/01.aids.0000163929.84154.87.
Tuljapurkar, S., Li, N., and Feldman, M. (1995). High sex ratios in China’s future. Science 267(5199): 874-876. doi:10.1126/science.7846529.
UNAIDS. (2004). Thailand: Epidemiological Fact Sheets. Geneva: UNAIDS. UNAIDS. (2008). China: Epidemiological Fact Sheets. Geneva: UNAIDS.
United Nations. (2009). World Population Prospects 2008. New York: United Nations. van den Hoek, A., Fu, Y., Dukers, N.H.T.M., Chen, Z., Feng, J., Zhang, L., and Zhang,
X. (2001). High prevalence of syphilis and other sexually transmitted diseases among sex workers in China: Potential for fast spread of HIV. AIDS 15(6): 753-759. doi:10.1097/00002030-200104130-00011.
Wang, B., Li, X., McGuire, J., Kamali, V., Fang, X., and Stanton, B. (2009). Understanding the dynamics of condom use among female sex workers in China. Sexually Transmitted Diseases 36(3): 134-140.
Wu, Z., Rou, K., and Cui, H. (2004). The HIV/AIDS epidemic in China: History, current strategies and future challenges. AIDS Education and Prevention 16(Suppl A): 7-17. doi:10.1521/aeap.16.3.5.7.35521.
Xia, G. and Yang, X. (2005). Risky sexual behaviour among female entertainment workers in China: Implications for HIV/STD prevention intervention. AIDS Education and Prevention 17(2): 143-156. doi:10.1521/aeap.17.3.143.62904. Yang, X. (2005). Does where we live matter? Community characteristics and HIV/STD
prevalence in southwestern China. International Journal of STD and AIDS 16(1): 31-37. doi:10.1258/0956462052932610.
Yang, X., Derlega, V.J., and Luo, H. (2005). Migration, behavior change, and HIV/STD risks in China. Paper presented at the IUSSP XXV International Population Conference, Tours, France, July 18-23, 2005.
Yuan, J., Xu, Y., Jiang, T., Wang, M., Li, Y., Liu, K., Qu, S., Bai, Y., Wang, L., Bollinger, L., Walker, N., He, J., and Ionita, G. (2002). The Socioeconomic Impact of HIV/AIDS in China [electronic resource]. http://www.51condom.com/english/resources/Ourreports/SocEc%20Impact%20 study.pdf.