18. Ma, S., Sun, D., Simmons, J. M., Collier, C. D., Yuan, D. and Zhou, H. C. (2008). “Metal – organic framework from an anthracene derivative containing nanoscopic cages exhibiting high methane uptake.” Journal of the American Chemical Society, Vol. 130, pp. 1012-1016.
19. Wang, X.-S., Ma, S., Rauch, K., Simmons, J. M., Yuan, D., Wang, X . and Zhou, H. C . (2008). “Metal − Organic Frameworks Based on Double-Bond-Coupled Di-Isophthalate Linkers with High Hydrogen and Methane Uptakes.”
Chemistry of Materials, Vol. 20, pp. 3145-3152. 20. Wu, H., Zhou, W. and Yildirim, T. (2009).
“High-capacity methane storage in metal − organic frameworks M2 (dhtp): The important role of open metal sites.” Journal of the American Chemical Society, Vol. 131, pp. 4995-5000.
21. Lee, J.S., Jhung, S. H., Yoon, J. W., Hwang, Y. K. and Chang, J. S . (2009). “Adsorption of methane on porous metal carboxylates.”
Journal of Industrial and Engineering Chemis-try, Vol. 15, pp. 674-676.
22. Rowsell, J.L. and Yaghi, O.M. (2005). “Strategies for hydrogen storage in metal – organic frameworks.” Angewandte Chemie International Edition, Vol. 44, pp. 4670-4679. 23. Senkovska, I. and Kaskel, S. (2008). “High
pressure methane adsorption in the metal – organic frameworks Cu 3 (btc) 2, Zn 2 (bdc) 2 dabco, and Cr 3 F (H 2 O) 2 O (bdc) 3.”
Microporous and Mesoporous Materials, Vol. 112, pp. 108-115.
24. Serre, C., Millange, F., Thouvenot, C., Noguès, M., Marsolier, G., Louër, D. and Férey, G . (2002). “Very Large Breathing Effect in the First Nanoporous Chromium (III)-Based Solids: MIL-53 or CrIII (OH)⊙{O2C-C6H4-CO2}⊙{HO2C-C6H4-CO2H} x⊙ H2O y.”
Journal of the American Chemical Society, Vol. 124, pp. 13519-13526.
25. Prestipino, C., Regli, L., Vitillo, J. G., Bonino, F., Damin, A., Lamberti, C. and Bordiga, S . (2006). “Local structure of framework Cu (II) in HKUST-1 metallorganic framework: spectroscopic characterization upon activation and interaction with adsorbates.” Chemistry of materials, Vol. 18, pp. 1337-1346.
CFD Simulation of Dry and Wet Pressure Drops and
Flow Pattern in Catalytic Structured Packings
Maryam Mazarei Sotoodeh, Morteza Zivdar*
and Rahbar Rahimi
Department of Chemical Engineering, University of Sistan and Baluchestan, Zahedan 98164-161, Iran
(Received 2016.07.11, Accepted 2017.05.24)
Abstract
Type of packings and characteristics of their geometry can affect the flow behavior in the reactive distillation columns. KATAPAK SP is one the newest modular catalytic structured packings (MCSP) that has been used in the reactive distillation columns, recently. However, there is not any study on the hydrodynamics of this packing by using compu-tational fluid dynamics. In the present work, a 3D VOF model was de-veloped to evaluate dry and wet pressure drops of catalytic structured packings, MCSP-11 and 12. The module of MCSP is made of alternating vertical layers of structured packing sheets (Mellapak Plus) and cata-lyst bags. The goal of this paper is to illustrate the effect of geometry on the hydrodynamics and characterization of flow in the MCSP modules. Results showed that the mean relative errors for prediction of dry and wet pressure drops were 17% and 7% for MCSP-11 and 11% and 12% for MCSP-12, respectively. According to CFD results, pressure drop in closed channels was higher than that in open channels. The catalyst bags were simulated as porous media. The simulation led to determi-nation of the liquid velocity distribution in the catalyst bags.
Keywords
Reactive separation;Modular catalytic structured packing;
Mellapak Plus; Multiphase model; Hydrodynamic;
Computational fluid dynam-ics.
Introduction
1* Corresponding Author. Tel./Fax: +989153414268
Email: [email protected] (M. Zidvar)
1 RS
1. Introduction
eactive separations1, in which chemical reaction and separation take place in one unit, are becoming more important in sev-eral areas of chemical engineering [1, 2]. These processes have many advantages over conven-tional methods (reactor-separator systems), es-pecially by reducing investment and operational
costs. Therefore, in many cases, the use of these systems is preferred. Despite all the benefits of reactive separation, there are some limitations, which are summarized in Table 1 [1, 3, 4].
Due to high complexity and lack of commend in RS process, the need for further investigation in this area can be seen. Due to the cost of hydrody-namic experiments and various internal equip-ment (including various packing and catalysts), the use of CFD simulation has led to wider re-search on various types of packing and synthesis. Although numerous laboratory studies have been published in the field of reactive separation
14], few studies have been reported by using computational fluid dynamics. Van Baten et al. [15] studied the hydrodynamics of a reactive dis-tillation sieve tray column in which the catalyst containing wire-gauze envelopes were disposed along the liquid flow direction. A 3D two-phase model was developed to determine liquid clear height on the tray as a function of tray geometry and operating conditions. A 3D steady-state one-phase model was presented by Kloker et al. [2] to obtain the influence of different catalytic inter-nals on reactive distillation of n-hexyl acetate from hexanol and acetic acid. Egorov et al. [16] proposed a new modeling methodology for RS, which exploited a combination of modern CFD facilities and the rate-based process simulation approach. Hydrodynamics and mass transfer cor-relations were obtained by using CFD simula-tions. Zivdar et al. [17] investigated the dry pres-sure drop within the catalyst packed channels of KATAPAK-S by using CFD simulations. Also, the gas flow path line in the packing sheet and elbows were presented. A 3D two-phase CFD model was established to study the separation performance of structured catalytic packing by Dai et al. [18]. Two types of structured catalytic packings (i.e., BH-1 and BH-2) were used in simulations. Liu et al. [19] analyzed the multi-scale structure of a reactive distillation column by Aspen Plus with Fluent software. The reactive distillation column was divided into four scales: column scale, tray scale, fluid mechanical scale, and molecule scale. Tray efficiency was calculated by using CFD simu-lations. Ding et al. [20] presented a 3D model for simulating the winpak-based modular catalytic structured packing by using CFD. The model was validated by both dry and irrigated pressure drops.
In recent years, some forms of catalytic packing, such as KATAPAK SP, have been introduced by the Sulzer Company. Experimental works on the hydrodynamics and reaction of KATAPAK SP modules (Modular Catalytic Structured Packing1) were reported [21-26]. There has not been any research on this type of packing by using CFD simulation yet. Rahimi et al. [27] investigated the effect of geometry on the efficiency of sieve trays by CFD. Also, Zarei et al. [28] and Hosseini et al. [29] worked on the hydrodynamics of MVG trays and gas solid fluidized bed, respectively.
1 MCSP
In the first part of this paper, a 3D VOF model is developed to evaluate dry and wet pressure drops of MCSP-11 and 12. The aim of this part is to illustrate the effect of geometry on the hydro-dynamics and characterization of flow in the MCSP modules. In the second part, catalyst bags of MCSP are simulated as porous media. The re-sults show the liquid velocity distribution in the catalyst bags.
2. MCSP Description
KATAPAK SP (MCSP) packings are relatively new structured catalytic packings from Sulzer Chemtech Company, which are used in reactive separation columns. These types of packings are composed of two distinct parts: separation sec-tion and reactive secsec-tion. The MCSP module is made of alternating vertical layers of structured packing sheets and catalyst bags. The ratio of separation to reactive layers can vary to declare flexibility between separation and reaction pro-cesses. Usually, Mellapak or Mellapak Plus is used in separation section as separation layer. The re-active section is made of wire gauze envelopes containing Amberlyst 15 catalyst particles. The contact of gas and liquid happens in structured packing sheet, and the separation process is done in this layer. Only the liquid phase flows through reactive section and the reaction is carried out in contact with the catalyst particles. Fig. 1 shows the picture of MCSP-11 and 12. The suffixes 11 and 12 denote an alternating arrangement of one corrugated sheet with one catalyst bag and two corrugated sheets with one catalyst bag, respec-tively.
3. Model Development Method
3.1. Simulation
This paper presents a 3D steady-state VOF model to illustrate one-phase and two-phase flows in MCSP-11 and 12. As mentioned in section 1, there were some experimental results on the hydrody-namics of these packings. To validate the pro-posed model, the results of simulation were com-pared with the experimental results of Behrens [23]. Process flow diagram of experimental setup is shown in Fig. 2.
1
A. Eskandari et al. / Journal of Chemical and Petroleum Engineering, 50 (2), Feb. 2017 / 1-7
Investigation of the Use of Various Silica Source
on NaX Zeolite Properties
Atieh Eskandari
1, Mansoor Anbia
2*, Mansour Jahangiri
1and Fariba Mohammadi Nejati
11. Faculty of Chemical, Petroleum and Gas Engineering, Semnan University, Semnan, I.R. Iran. 2. Research Laboratory of Nanoporous Materials, Faculty of Chemistry, Iran University of Science
and Technology, Tehran 16846-13114, Iran.
(Received 7 May 2015, Accepted 11 December 2015)
Abstract
Silicon and aluminum sources are most important reactants in the synthesis of zeolite. The use of the silicon source has an important effect on the crystallization of zeolites. Also, it can change the prop-erties of the end product. This work reports the influence of three common commercial silica sources such as colloidal silica (Ludox AM-30), fumed silica and water glass on the crystallinity of NaX zeo-lite by hydrothermal method, also the adsorption of carbon dioxide on these samples have also been studied. The synthesized samples from different sources are characterized by X-ray diffraction (XRD), scan-ning electron microscope (SEM), Fourier transformin frared (FT-IR) and nitrogen adsorption–desorption analysis. The sample obtained by fumed silica, colloidal silica and water glass is NaX phase. The percent-age of crystallinity and surface area increased in the sequence: water glass< colloidal silica < fumed silica, also the sample of synthesized by Fumed silica (Z-F) with higher crystallinity, shows better performance in the adsorption process.
Keywords
Adsorption; Characterization; NaX zeolite; Silica sources; Synthesis.Introduction
1* Corresponding Author.
Tel.: +98 21 77240516 / Fax: +98 21 77491204 E-mail: [email protected] (M. Anbia)
1. Introduction
Z
eolites are the most important family in crys-talline microporous materials. The zeolite comprises infinitely extending three-dimen -sional network of aluminum and silicon tetrahedra linked to each other by the sharing of oxygen ions with uniformly sized pores of molecular dimen-sions [1]. Synthetic zeolites have been used in the petroleum industry in reactions such as cracking, alkylation, isomerization, shape reforming,hydro-genation and dehydrohydro-genation, adsorbents, cata-lysts, ion-exchangers and separation processes. Zeolites are of particular interest because of their remarkable properties, such as high hydrothermal stability, catalytic activity, excellent shape selectiv-ity and adsorption capacities [2-4].
Table 1. advantages and limitations of reactive separations [1, 3, 4].
Advantages limitations
Simplification or elimination of the separation system (capital savings) Volatility constraints Improved selectivity and reduced by-product formation Residence time requirement Significantly reduced catalyst requirement Scale up to large flows
Avoidance of azeotropes Process conditions mismatch
Heat integration benefits The liquid phase reaction
Avoidance of hot spot formation Long-lifetime catalysts strongly required
Figure 1. Schematic depiction of MCSP; left: MCSP-12, right: MCSP-11 [23]
The detailed characteristics of geometry, compu-tational domains, and boundary conditions are presented in section 3.3. Because of the compli-cated geometry, lack of appropriate understand-ing of multi-scale phenomena in MCSP, and time-consuming simulations, several assumptions have been used in the simulations. The hydraulic pa-rameters such as dry and wet pressure drops slightly change over simulation time. Also, they show a periodic or ‘‘quasi-steady state’’ manner. These parameters have some effect on the gas– liquid contact time and mass transfer rate be-tween two phases. As these changes are
negligi-ble, the steady-state assumption is acceptable. Also, due to complicated geometry of catalyst par-ticles in the reactive section, the Catalyst bags are assumed as porous media [16].
Figure 2. Process flow diagram [23]
The continuity and momentum equations are numerically solved for each phase. In single-phase flow, the air is used as gas single-phase and in two-phase analysis, air and water are assumed as the gas and liquid phases, respectively. Simula-tions are done at atmospheric pressure and am-bient temperature. Therefore, one can neglect the use of energy balance equations. The fluids are assumed to be Newtonian, isothermal, and in-compressible. Therefore, their physical proper-ties are kept constant. Physical properproper-ties of wa-ter and air are listed in Table 2. Mass transfer and reactions as well as capillary rise are neglected in this part of research.
Table 2. Physical properties of air and water.
property symbol water air
Density [kg/m3] ρL,ρG 998 1.2
Dynamic viscosity [Pa.s] μL, μG 0.00115 1.82×10⁻⁵
Surface tension [N/m] σL 0.073 ----
The maximum dynamic liquid hold-up is reached when the void fraction of the catalyst containing pocket is just completely filled with flowing liq-uid. This point is characterized as the catalytic load point, which is a function of physical proper-ties of the liquid, particle size, and void fraction of the bed [23]. Simulations are done at the liquid load point for both geometries. All the walls are assumed impermeable; therefore, the liquid can-not move from catalyst bags to corrugated sheets and vice versa.
3.2. Governing equations
The VOF model is well suited for tracking the in-terface between the two immiscible phases, which has been validated by many researchers for gas-liquid CFD simulations of structured pack-ing [30, 31, 32]. Therefore, in the present study, it is used to predict two-phase flow in the struc-tured packings and the effect of surface tension along the interface between the phases. The mass transfer between the immiscible water and air phases is neglected.
In this model, no relative velocity between phases is considered and all phases share a single set of momentum equations throughout the domain. But, the volume of phases in each computational cell is tracked as well. The resulting velocity in each cell is the mass averaged values of the veloc-ity of phases that are presented in the cell. The corresponding momentum balance equation for the steady-state two-phase flow is given as fol-lows:
F
g
P
T
)]
(
.[
.
)
.(
(1)Eq. (1) involves the volume fractions of both phases that enter through physical properties of phases, such as density and viscosity. Hence, the phase averaged properties are given as:
2 2 1 1
2 2 1 1
(2) (3)
where ρ and α are density and volume fraction, and subscripts correspond to the phases.
In each control volume, the summation of volume fractions of all phases is equal to unity. That is:
1
1
n i i
(4)The tracking of the interface is done in cells where the volume fraction is different from 0 or 1. If a cell is completely filled with one phase, the volume fraction of that phase in the cell is equal to unity (α = 1) and the cell is considered to be in the main flow region of that phase. A cell is con-sidered to be on the interface (free surface) when the value of volume fraction is between 0 and 1 (0 < α < 1).
The tracking of the interface(s) between the phases is accomplished by the solution to a conti-nuity equation for the volume fraction of one (or more) of the phases. For the ith phase, it can be written as:
0 )
.(
ii (5)
The VOF model accounts for the effect of surface tension along the interface between the phases. The continuum surface force (CSF) model is ap-plied as surface tension model [30,31]. This model was proposed by Brackbill et al. [33]. In the CSF model, a surface force is formulated to numerically model the surface tension effects at fluid interfaces having finite thickness [33]. The BSL model is used to solve the turbulent viscosity in the simulations [30, 31].
As mentioned above, in the computational do-main, the catalyst bags are assumed as porous media. A momentum source term is added in the standard fluid flow equations and the porous me-dium is considered to be homogeneous and iso-tropic. The source term Si is:
i i
i
a
v
C
v
v
S
2
1
2
(6)where a is permeability and C2 is the inertial re-sistance coefficient defined as:
1
(
)
150
2 2 3 2m
d
a
CB CB p
(7)
1
(
)
5
.
3
1 3 2
m
d
C
CB p CB
(8)where dp (= 1mm) is the diameter of catalyst par-ticles used in catalyst bags and
CB is the void fraction, which is dependent on the type of cata-lytic structure module. The first and second terms in the right side of Eq. (6) represent the viscosity loss and inertial loss, respectively. These terms can be neglected in laminar flow when the fluid flows through a porous medium.3.3. Computational domains and boundary co-nditions
The catalytic structured packings of Behrens [23] are used in the simulations. Computational do-mains containing a piece of MSCP are divided into three sections: a separation section in the middle and one catalyst bag on each side as reactive sec-tion. The domains were shown in Fig. 3. In MCSP-11, one sheet of Mellapak Plus is drawn as sepa-ration layer. In this situation, all of the channels of corrugated sheet are in the vicinity of catalyst bags. These channels are called closed channels. In MCSP-12, two sheets of Mellapak Plus are drawn between catalyst bags as separation layer. In this case, two types of channels are created:
closed channels and open channels. Open chan-nels are the crisscrossing chanchan-nels in the middle of two sheets.
There are three effective ratios in the structure of MCSP, which are known as channel ratio, cross sectional ratio, and volume fraction of the cata-lyst. These parameters differentiate both MCSP-11 and MCSP-12 and affect the pressure drop of modules and, consequently, the mass transfer and reaction performance of packing. The characteris-tics of geometries and ratios are shown in Table 3.
Figure 3. Simple schematic of computational domains; left: geometry of MCSP-11, right: geometry of MCSP12 [23].
Table 3. Geometrical characteristics of packings [23]
Property Symbol MCSP-11 MCSP-12
Cross sectional fraction Γ 0.40 0.52
Volume fraction of catalyst Λ 0.46 0.34
Channel ratio X 0 0.5
Void fraction εp 0.55 0.7
Thickness of catalyst-filled pockets tR 13.6 mm 13 mm
Height packing element hpe 200 mm
Corrugation height H 6.5 mm
Corrugation base width B 9.85 mm
Corrugation angle αe or c 41°
Overall corrugation angle α 45°
Catalyst diameter dp 1 mm
The following terms are used in characterization of packings. The channel ratio is:
X=number of open channels per packing layertotal number of channels per packing layer (9)
The vapor is not able to flow through the catalyst bags, because of their dense structure, so the cross sectional area available for the vapor is re-duced. The cross sectional ratio is defined as:
Г=cross sectional area for separation sectiontotal cross sectional area (10)
The volume fraction of catalyst ratio specifies the reaction performance compared to the separation performance. This ratio is determined as follows:
Computational domains are meshed by unstruc-tured mesh. Mesh independency is done for com-putational domains. Several sizes of mesh, i.e., 0.2, 0.3, 0.35, 0.4, and 4.5 mm, are tested to make sure of numerical accuracy of simulations. Eventually, the size of 0.35mm is selected for separation sec-tion and the size of 0.3mm is selected for the re-active section based on the simulation results. The total numbers of meshes for MCSP-11 and MCSP-12 are 3508724 and 7644644, respective-ly.
Typically, the relative error between two succes-sive iterations is specified by using convergence criteria of 10-6 and 10-4 for each scaled residual component in one-phase and two-phase simula-tions, respectively. The computational time re-quired for each two-phase simulation is more than one week on a core i7 CPU running on an eight-core 2.67 GHtz with 18.0 GB of RAM. On the bottom of domains, static pressure is se-lected for catalyst bags and structured packing sheets. At the top, liquid inlet velocity and gas outlet velocity are specified for both domains. No slip wall boundary condition is selected for the liquid flow and free slip wall boundary condition is used for the gas phase. Hydrophobicity and smoothness of the walls and the properties of liquid (such as density, surface tension, and vis-cosity) can affect the contact angle between liquid and solid. Contact angle of 70◦is assumed be-tween water and walls [30, 31, 32, 33].
4. Results and Discussion
3D steady-state VOF simulations are done for in-vestigating dry gas and two-phase flows in MCSP-11 and 12. The results of simulations are validat-ed by Behrens [23] experimental data. In section 4.1, one-phase flow is discussed. Dry pressure drops for both geometries are presented and compared with experimental results. Also, the effect of geometry (Mellapak Plus) on the gas flow direction is shown. Two-phase flow pattern and wet pressure drop results are presented in sec-tion 4.2. Liquid velocity contour in the middle of catalyst bag is shown in section 4.3.
4.1. One-phase flow
The dry pressure drop is the first parameter in the validation of the hydrodynamic simulations of
structured packings. Simulations are done in dif-ferent Fs for two geometries. The range of Fs is 0.58 up to 2.44 (m/s (kg/m3)0.5). Fig. 4 compares the simulated pressure drop with the experi-mental data. For MCSP-11 and 12, it can be seen that the simulated pressure drops are under- and over-predicted in all Fs, respectively. Although, the trends of simulated pressure drop vs. Fs ex-hibit the same behavior with experimental data for both geometries. On the other hand, by in-creasing the Fs, the pressure drop increases and vice versa.
Since the cross sectional fraction available for gas flow in the MCSP-12 is larger than that in the MCSP-11 (i.e. Г11: Г12 = 0.4: 0.52), the pressure drop of this packing is lower than that of the MCSP-11. The same trend was observed by Beh-rens [23].
Fig. 5 compares simulation and experimental dry pressure drops for all Fs in MCSP-11 and 12. The solid line in the figure denotes that the simulation pressure drop is equal to the experimental one and dotted lines over and under the solid line represent 15% deviations.
The simulation results are found in good agree-ment with experiagree-mental data and they show about 17% and 12% average deviations for MCSP-11 and 12, respectively.
It is clear in Fig. 6 that the gas flow transfers smoothly to the next vertical sheet due to vertical section between the sheets of Mellapak Plus. Therefore, the pressure drop in this packing is less than Mellapak. It confirms the findings of previous researchers such as Olujic et al. [32].
Figure 5. Simulation and Experimental pressure drops for all Fs in MCSP-11 and 12.
4.2. Two-phase flow
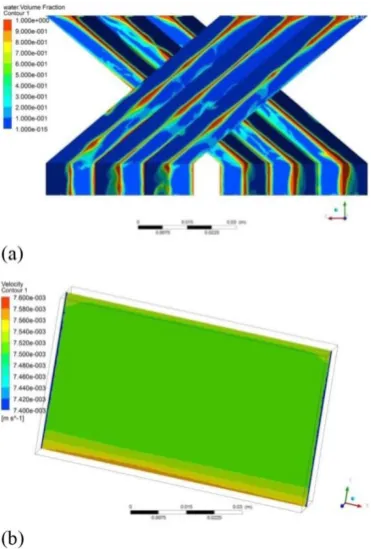
Liquid volume fraction on the channel walls in separation packing sheet is shown in Fig. 7a. It shows that the liquid distribution along the chan-nels is not uniform. Moreover, more liquid is spread at the bottom of computational domain due to gas entrance. Similar liquid distributions are observed for different values of F-factor in both geometries.
Since the boundaries around the catalyst bag have been defined as impermeable walls, liquid velocity near the wall boundaries is zero, while it is uniform inside the bag. As can be seen in Fig. 7b, the last result is reached by assuming the cat-alyst bag as homogeneous and isotropic porous medium.
Figure 6. Gas velocity vector in the channels of MCSP-12.
The wet pressure drop within a certain range of Fs (≈ 0.55 – 1.2 (m/s (kg/m3)0.5) is noticeable in Fig. 8. All the simulations are done at the liquid loading point. As expected, the pressure drop in-creases by increasing Fs.
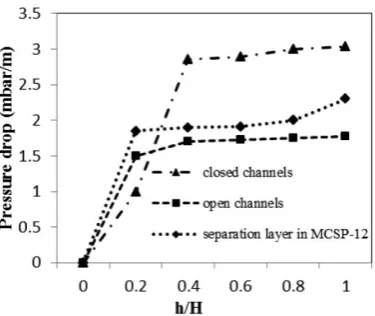
Separation section in MCSP-11 includes only closed channels. Thus, the pressure and velocity profiles are the same in all channels. However, MCSP-12 contains both open and closed channels. Therefore, this difference leads to different pres-sure drop profiles in the channels of packing lay-er, which are shown in Fig. 9.
It is clear that pressure drop in the closed chan-nels is approximately 70% higher than that in open channels. While, the pressure drop of sepa-ration section in MCSP-12 is between these two types of channel. As mentioned in section 3.3, the differences in the pressure drop profiles occur because of the difference in the nature of chan-nels.
Figure 7. (a) Liquid volume fraction in the separation section, (b) Liquid velocity distribution in the center of catalyst bag.
shown in a parity plot in Fig. 10. As explained in section 4.1, the solid line in the figure denotes that the simulation pressure drop is equal to the experimental one and dotted lines over and un-der the solid line represent 9% deviations. The mean relative errors of the simulations and ex-perimental data for MCSP-11 and 12 are approx-imately 7% and 11%, respectively.
Figure 8. MCSP-11 and 12 wet pressure drops vs. Fs at liquid loading point.
5. Conclusions
KATAPAK SP (MCSP) packings are composed of two distinct parts: separation section and reac-tive section. The module of MCSP is made of al-ternating vertical layers of structured packing sheets and catalyst bags. The ratio of separation to reactive layers expresses flexibility between separation and reaction.
Figure 9. Pressure drop profile along the closed channels, open channels, and MCSP-12 separation sections.
In the present work, MCSP-11 and 12 are investi-gated to gain more information about the reactive separation internals. For this purpose, a 3D VOF model is used to study the hydrodynamics of catalytic structured packings by using CFD. Re-sults exhibit the non-uniformity of the liquid dis-tribution on the channel walls. In addition, the uniformity of liquid velocity in the catalyst bag is shown. This result is because of assuming the cat-alyst bag as homogeneous and isotropic porous medium.
Simulation results are used to calculate dry and wet pressure drops for both packings and vali-dated by Behrens [23] experimental data. The simulation results for dry pressure drop reveal 17% and 12% deviations for 11 and MCSP-12, respectively. Also, the mean relative errors for prediction of wet pressure drop are 7% and 11% for MCSP-11 and MCSP-12, respectively.
Figure 10. MCSP-12 wet pressure drop vs. Fs at liquid flow rate= 10 m3hr-1.
Moreover, the profiles of pressure drop in two types of MCSP-12 channels, i.e., closed channels and open channels, are presented. Results show that the pressure drop in closed channels is about 70% higher than that in the open channels. The differences in the pressure drop profiles occur because of the difference in the nature of chan-nels.
Nomenclature
a Permeability (m2)
C2 Resistance coefficient (m-1)
Fs Gas capacity factor (m/s(kg/m3)0.5)
tR Thickness of catalyst-filled pockets
dp Diameter of catalyst particle (mm)
P Pressure (Pa)
g Gravitational acceleration (m/s2)
F Additional forces in the Navier–Stokes equations (N)
S Source term (Pa m-1)
v
Velocity (m/s)Greek letters
α Overall corrugation angle αe Corrugation angle
Γ Cross sectional fraction ε Porosity, dimensionless εp Void fraction
Λ Volume fraction catalyst μ Dynamic viscosity (Pa.s) ρ Density (kg/m3)
σ Surface tension (N/m)
X Channel ratio
Subscripts
CB Catalyst bag
G Gas phase
L Liquid phase
References
1. Taylor, R. and Krishna, R. (2000). “Review- modeling reactive distillation.” Chemical
Engi-neering Science, Vol. 55, pp. 5183-5229.
2. Klöker, M., Kenig, E.Y. and Górak, A. (2003). “On the development of new column internals for reactive separations via integration of CFD and process simulation.” Catalysis Today, Vol. 79–80, pp. 479–48.
3. Tuchlenski, A., Beckmann, A., Reusch, D., Dussel, R., Weidlich, U. and Janowsky, R. (2001). “Reactive distillation - industrial ap-plications, process design & scale-up.”
Chemi-cal Engineering Science, Vol. 56, pp. 387-394.
4. Noeres, C., Kenig, E.Y. and Gorak, A. (2003). “Modelling of reactive separation process: re-active absorption and rere-active distillation.”
Chemical Engineering and Processing, Vol. 42,
pp. 157-178.
5. Gonzalez, J.C. and Fair, J.R. (1997). “Prepara-tion of Tertiary Amyl Alcohol in a Reactive Dis-tillationColumn. 1. Reaction Kinetics, Chemical Equilibrium and Mass-Transfer Issues.”
Indus-trial and Engineering Chemistry Research, Vol.
36, pp. 3833-3844.
6. Gonzalez, J.C., Subawalla, H. and Fair, J.R. (1997). “Preparation of tert-Amyl Alcohol in a Reactive Distillation Column.2. Experimental Demonstration and Simulation of Column Characteristics.” Industrial and Engineering
Chemistry Research, Vol. 36, pp. 3845-3853.
7. Van Baten, J.M., Ellenberger, J. and Krishna, R. (2001). “Radial and axial dispersion of the liq-uid phase within a KATAPAK-S structure: ex-periments vs. CFD simulation.” Chemical
Engi-neering Science, Vol. 56, pp. 813-821.
8. Schmitt, M., Hasse, H., Althaus, K., Schoenmak-ers, H., Götze, L. and Moritz, P. (2004). “Syn-thesis of n-hexyl acetate by reactive distilla-tion.” Chemical Engineering and Processing, Vol. 43, pp. 397–409.
9. Schmitt, M., Scala, C., Moritz, P. and Hasse, H. (2005). “n-Hexyl acetate pilot plant reactive distillation with modified internals.” Chemical
Engineering and Processing, Vol. 44, pp. 677–
685.
10. Schmitt, M., Harbou, E., Parada, S., Grossmann, Ch. and Hasse, H. (2009). “New Equipment for Laboratory Studies of Heterogeneously Cata-lyzed Reactive Distillation.” Chemical
Engi-neering Technology, Vol. 32, No. 9, pp. 1313–
1317.
11. Bhatia, S., Ahmad, A.L., Mohamed, A.R. and Chin, S.Y. (2006). “Production of isopropyl palmitate in a catalytic distillation column: Experimental studies.” Chemical Engineering
Science, Vol. 61, pp. 7436–7447.
12. Brehelin, M., Forner, F., Rouzineau, D., Repke, J.U., Meyer, X., Meyer, M. and Wozny, G. (2007). “Production of n-propyl acetate by reactive distillation Experimental and Theoretical Study.” Chemical Engineering Research and De-sign, Vol. 85 (A1), pp. 109–117.
heterogene-ously catalysed reactive distillation using the D+R tray- a novel type of laboratory equip-ment.” Chemical Engineering Research and De-sign, Vol. 89, pp. 1271-1280.
14. Holtbruegge, J., Heile, S., Lutze, P. and Górak, A. (2013). “Synthesis of dimethyl carbonate and propylene glycol in a pilot-scale reactive distillation column: Experimental investiga-tion, modeling and process analysis.” Chemical Engineering Journal,Vol. 234, pp. 448–463. 15. Van Baten, J.M., Ellenberger, J. and Krishna, R.
(2001). “Hydrodynamics of reactive distilla-tion tray column with catalyst containing en-velopes: experiments vs. CFD simulations.”
Cataysis. Today, Vol. 66, pp. 233–240.
16. Egorov, Y., Menter, F., Kloker, M. and Kenig, E.Y. (2005). “On the combination of CFD and rate-based modeling in the simulation of reac-tive separation processes.” Chemical Engineer-ing and ProcessEngineer-ing, Vol. 44, pp. 631–644. 17. Zivdar, M., Rahimi, R., Nasr, M. and
Haghshen-asfard, M. (2005). “CFD Simulations of pres-sure drop in KATAPAK-S Structured Packing.”
Iranian Journal of Chemical Engineering,Vol. 2, No. 2.
18. Dai, C., Lei, Zh., Li, Q. and Chen, B. (2012). “Pressure drop and mass transfer study in structured catalytic packings.” Separation and Purification Technology, Vol. 98, pp. 78–87. 19. Liu, J., Yang, B., Lu, S. and Yi, C. (2013).
“Multi-scale study of reactive distillation.” Chemical Engineering Journal, Vol. 225, pp. 280-291. 20. Ding, H., Li, J., Xiang W. and Liu, C. (2015).
“CFD simulation and optimization of Winpak-based modular catalytic structured packing.”
Industrial and Engineering Chemistry Research, Vol. 54, pp. 2391-2403.
21. Gotze, L., Bailer, O., Moritz, P. and von Scala, C. (2001). “Reactive distillation with KATAPAK.”
Cataysis. Today, Vol. 69, pp. 201-208.
22. Ratheesh, S. and Kannan, A. (2004). “Hold up and pressure drop studies in structured pack-ings with catalysts.” Chemical Engineering Journal, Vol. 104, pp. 45-54.
23. Behrens M. (2006). “Hydrodynamics and Mass Transfer of Modular Catalytic Structured
Packing.” Technische universiteit Delft, Ph.D. thesis.
24. Brunazzi, E. and Viva, A. (2006). “Experi-mental investigation of reactive distillation packing KATAPAK-SP 11: hydrodynamic as-pects and size effect.” IChemE Symposium, No. 152, Italy.
25. Viva, A., Aferka, A., Toye, D., Marchot, P., Crine, M. and Brunazzi, E. (2011). “Determination of liquid hold-up and flow distribution inside modular catalytic structured packings.” Chem-ical Engineering Research and Design, Vol. 89, pp. 1414-1426.
26. Fernandez, M. F., Barroso, B., Meyer, X., Meyer, M., Le Lann, M., Le Roux, G.C. and Brehelin, M. (2013). “Experiments and dynamic modeling of a reactive distillation column for the pro-duction of ethyl acetate by considering the heterogeneous catalyst pilot complexities.”
Chemical Engineering Research and Design, Vol. 91, pp. 2309-2322.
27. Rahimi, R., Mazarei Sotoodeh, M. and Bahram-ifar, E. (2012). “The effect of tray geometry on the sieve tray efficiency.” Chemical Engineering Science, Vol. 76, pp. 90-98.
28. Zarei, T., Rahimi, R. and Zivdar, M. (2009). “Computational fluid dynamic simulation of MVG tray hydraulics” Korean Journal of Chemi-cal Engineering, Vol. 26(5), pp.1213-1219. 29. Hosseini, S.H., Rahimi, R., Zivdar, M. and
Samimi, A. (2009). “CFD simulation of gas-solid bubbling fluidized bed containing FCC particles.” Korean Journal of Chemical Engi-neering, Vol. 26(5), pp. 1405-1413.
30. Hosseini, S.H., Shojaee S., Ahmadi, G. and Zi-vdar, M. (2012). “Computational fluid dynam-ics studies of dry and wet pressure drops in structured packings.” Journal of Industrial and Engineering Chemistry, Vol. 18, pp. 1465-1473. 31. Shojaee, S., Hosseini, S. H., Rafati, A. and Ah-madi, G. (2011). “Prediction of the effective ar-ea in structured packings by computational fluid dynamics.” Industrial and Engineering Chemistry Research, Vol. 50, pp. 10833-10842. 32. Zhang, X., Yao, L., Qiu, L. and Zhang, X. (2013).
structured packing column.” Chinese Journal of Chemical Engineering, Vol. 21(9),pp. 959-966. 33. Brackbill, J. U., Kothe, D. B. and Zemach, C.
(1992). “A Continuum Method for Modeling Surface Tension.” Journal of Computational Physics, Vol. 100, pp. 335-354.
![Figure 2. Process flow diagram [23]](https://thumb-us.123doks.com/thumbv2/123dok_us/8948749.1858117/3.637.77.257.231.469/figure-process-flow-diagram.webp)
![Figure 3. Simple schematic of computational domains; [23].left: geometry of MCSP-11, right: geometry of MCSP12](https://thumb-us.123doks.com/thumbv2/123dok_us/8948749.1858117/5.637.79.545.519.638/figure-simple-schematic-computational-domains-geometry-mcsp-geometry.webp)