S t r o jn iš k i vestnik - Journal o f Mechanical Engineering 54(2008)11, 739-750 UDO 628
Paper received: 19.06.2008 Paper accepted: 25.09.2008
Product Development Through Multi-Criteria Analysis
Tomaž K ostanjevec1’*, Andrej Polajnar', Andrej Sarjaš
2
1
Faculty o f M echanical Engineering, University o f Maribor,2
Faculty o f Electrical Engineering and Computer Science, University o f MariborThe trend regarding the development o f sanitary fittings is forecasted by the use o f a developed model o f multi-criteria analysis. In this analysis a multi-dimensional space is used, which enables the establishment o f a time argument in comparison to product parameters. The establishment o f product parameters is achieved by means o f internal company information and market needs. In this way it is possible to establish an innovative environment fo r the development o f new products.
This paper indicates various ways o f dealing with product development, on the basis o f which the
m e t h o d o f multi-criteria analysis fo r establishing future trends in product development is acquired.
© 2008 Journal o f Mechanical Engineering. All rights reserved.
K e y w o r d s : s a n i t a r y f i t t i n g s , p r o d u c t d e v e l o p m e n t , m u l t i c r i t e r i a a n a l y s i s , m u l t i - d i m e n s i o n a l s p a c e
0 INTRODUCTION
The key moment o f any company's strengths lies within essential and sustainable continuous development. M odem companies require constant investment into development. The development o f the equipment for product development is also very wide, while the use o f such equipment is still not as widespread as it should be [1]. As a line o f business, product development has played an important role in production engineering by researches within the
global industry experience[
2
], design and analysis[3] and [4], product design [5] to [
8
] andcreativity used in product development [9], On the other hand, product development also includes research within the market with
regard to customer needs [
10
], [6
] and [11
],product positioning and segmentation [7] and [12], product forecasting [13] to [15] and test marketing [16]. A number o f applications, marked by different views, led to a deeper understanding o f how to jo in and use the information regarding customers and product engineering in designing, testing, starting and managing new products. To further disclose the contents, methods and applications o f the above, more integrative views and papers on the topic o f product development were published [17]. The production and engineering precision, combined with the marketing approach, both o f which were focused on customer needs and production capability, proved very successful. In parallel with the development o f established equipment, researchers discovered the correlation o f new
product success by establishing the
communication between marketing and
production engineering as the most important elements necessary for success [2], [5], [10], [19] and [20]. Organisation processing equipment as are, for example, teams functioning via network [14], quality function development (QFD) and
distribution [
21
], were all developed with thepurpose o f establishing a closer link between production engineering decision-making and customer needs [22]. New challenges and opportunities are reflected in global markets, global competitiveness, the global spread o f engineering knowledge and with communication technologies. The use o f multi-criteria analysis with product development represents a new challenge and an opportunity in design research and new product forecasting [23] and [24].
1 THEORETICAL BACKGROUND
In the last decade companies were focused on new product development on the basis o f satisfying customer needs. Researchers in the
field o f marketing were convinced that
understanding customer needs and improving the transfer o f these needs to product manufacturers was the key to success.
The Kaizen method for continuous
improvement helped enhance the understanding o f quality in product development with improved reliability [25], with statistical-qualitative control
[26], modified experimental design [
20
] anddesign for production [27] to [29]. Engineers were certain that a product o f higher quality was the key to success [30],
Both marketing and production engineering recognised that the time from conception to implementation was o f key importance. The awards for the early entrants were excellent, while production engineering went through great losses by working overtime and delays. Customer satisfaction and the time from conception to marketing became the warranty for success and profit.
Both the economic and academic worlds realised that successful product development is a closely related process, which can bypass many compromises. Customer satisfaction, the time from conception to marketing and cost reduction
through complete control and quality
management are also important factors. However, none o f them has been recognised as a warranty for success.
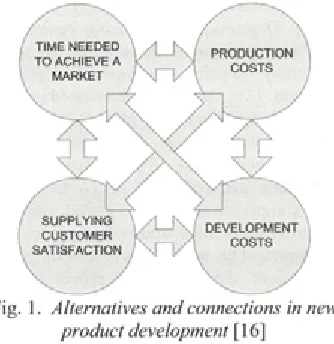
Fig. 1. Alternatives and connections in new
product development [16]
Under unchanged conditions a product will prove profitable if it supplies customers with greater satisfaction, is among the leading products in the market, and has low production and development costs. Fig. 1 puts forward researches carried out in the field o f equipment and product development methods. These researches should ensure that companies are directed towards new fields by taking into account all the strategic aims presented in Fig. 1. The concept o f joint or common dealing o f product parameters is included in the conjoint product analysis [13] and [31].
Researches must prove that various
perspectives with all the effective new fields o f development are o f key importance. I f a closer look is taken at only two o f the numerous aims in the development o f a new product, effectiveness
proves the most essential. QFD can represent the most effective way o f supplying customer
satisfaction by means o f improved
communication and coordinating the efforts o f the various parties involved in the process o f product development. At the same time it is necessary to stress that certain equipment might prove inefficient in saving time in the process from conception to implementation and thus increase development costs.
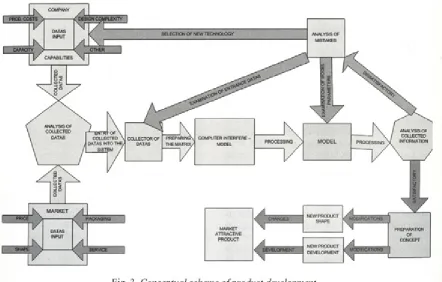
M ost companies see product development as a process o f conception and implementation and connect it with production engineering,
marketing, production and organisation
development. Fig. 2 shows the process that takes place from conception to implementation [16]. It is a set o f strengths that influence product development and shed light on opportunities for researches regarding product development.
Fig. 2. Product development: from
cognition to implementation
involved in the development in order to fulfil customer demands.
Perspectives o f marketing, production engineering, designing and manufacturing must
be integrated for the needs o f product
development and show themselves as the basic network o f a functional team that supports an effective organisation.
Human resources are important for the inclusion o f needs for context and culture organisation understanding, as well as the need
for developing human capabilities through
training, information technology, and
communication on the part o f practice.
Marketing, engineering and processing equipment enable the process o f development from its conception to its implementation and support this process in being effective.
Product development, as shown at the funnel neck in Fig. 2, shows a normal - traditional view, according to which product development generates itself through idea conception and develops further into a number o f potential products that are potentially realised. Within the neck presented in Fig. 2a method is adopted - steps o f opportunities, identification and idea formation, concept development and choice, detailed selection o f design and engineering,
testing and implementation [
8
]. Although thecontext and individual companies use a slightly different description o f the steps, the description
of product development in the form o f
development steps remains more or less the same. The basic idea o f management is that it is less expensive to establish product suitability in the early rather than in later steps, and that every following step might improve the product and its positioning and thus increase its success in the market. Mathematic examples show that such a step process, which is best presented in the form of key steps, proves to be the most efficient in
decreasing costs [
1
].The neck in Fig. 2 also tries to show the concept o f management flow by means o f parallel projects that are moving through the funnel neck. However, in the steps, and in the assessment o f the work carried out in each step, there is no connection between individual steps, which remains one o f the greatest weaknesses o f the step process. On the other hand, in the process o f continuing product development in the multi
dimensional method this moment o f weakness is smaller.
Often the best strategy for companies is to have a suitable number o f parallel projects, since it is in this way possible to implement the project that shows the most profitable future. Fig.2 does not show clearly enough the importance o f the real product development process characteristics, since certain steps are often expedited and left out.
For example, with advanced methods, as are user's and same-time design, it is possible to test the design concept already in the early steps o f designing and engineering, or to, for example, present ideas already in the concept phase more effectively. Moreover, Fig. 2 does not explicitly include (co-)circumstances o f the nature o f the whole process [32]. Nowadays many companies use a spiral instead o f line development process, since in the former products or concepts move through numerous narrower and narrower steps.
The essential difference between the neck and spiral processes is that the latter is more suitable for higher expectations in the form o f a repeating return in the parallel direction through the neck o f the shown funnel and leads to
improvement. An interesting challenge for
research would be to make a comparison o f input data in the spiral and the funnel form o f the
process. Here could be compared which
circumstances influence one or the other form of development and which is more suitable.
The process o f multi-criteria product analysis also includes product platforms. It has been recognised in numerous industry branches and companies that it is far more effective to develop products in platforms. In the field of sanitary fittings a platform carries a very specific name - family. From the point o f view o f customers these platforms supply companies with the possibility o f adapting to customer demands and market needs [4], [17], [27] and [33].
On the right side o f Fig. 2, where the process from conception to implementation is presented, an increasing trend in the direction o f conventional product development is shown. When the process is exposed to various circumstances, as are functionality, teams and suppliers, the process itself becomes more dispersed and the product involved consequently more complex. This then leads to a greater need
management by means o f their increased and stressed own engagements in the role o f connecting within functional teams. To achieve such balance companies turn to a metrical approach, in which teams are measured on the basis o f strategic indicators, as are customer
satisfaction and the time needed for
implementation, as well as production and development costs. The enumerated parameters are followed-up in the analysis covered within this article. If the ratio o f these parameters is correct, then these teams can perform in the best possible way and with the greatest short- and long-term enthusiasm, and it is only in this way that the accepted decisions will lead to the best short- and long-term profits [34].
2 METHODOLOGY
The conceptual model with data capture and information flow is shown in Fig. 3. The data are collected from the market with a data collecting form and the data flows into the data collector together with the technological company capabilities (internal data). The combined data are processed in the model, and in this way the model
anticipates trends on the basis o f individual parameters as well as the common trend. The possibility o f development determination also depends on the body's centre o f gravity which is time-dependent. Possible feedback connections are also shown on the conceptual Fig. 3 and serve as corrections or modifications to the model.
3 M ODEL OF M ULTI-CRITERIA ANALYSIS FOR PRODUCT DEVELOPM ENT
ASSISTANCE
The idea about multi-dimensional analysis o f product acceptability in the market was bom from watching two-dimensional graphs showing the dependence o f the dependent variable from the independent one. The independent variable represents time, the dependent one is derived from the observed and most representative parameters - e.g. prices, sale quantities, input into development on individual product, costs of manufacturing. Because o f the incapability o f demonstrating individual parameters on one graph the concept or model is presented, which could eliminate that weakness.
Fig. 4. Outline scheme o f the model
Due to longer non-changeability o f products and technology in the branch most o f the products observed remained the same in that time or changed minimally (e.g. sanitary fittings, handles of sanitary armatures and packaging changed
[
35
]), which is an additional confirmation o f themodel's results. The calculated trend on the basis of the gravity centre is represented graphically and mathematically and applies for future years.
The transition from Cartesian coordinates to polar coordinates is given by the following Equations (1), (2) and (3). In Equation (4) we
calculate the uniform distribution o f the
horizontal axes o f observed parameters around time - central axis. This uniform way o f distribution o f product parameters does not emphasise only one param eter but that all
parameters are equivalent Equation (
6
).The representative parameters acquired from the company are evenly distributed on the circle arch o f 360° w ith the centre in coordinate origin. The angle according to Equation (1)
belongs to each parameter; param eter n means the
number o f representative parameters.
% =360/ m
i
n ~ k ) ; ^ = 0,1,2....« —1 (1)The percentage value o f an individual parameter with belonging angle (Equation (1)) is
converted to Cartesian coordinates upon
Equations (2) and (3). On the coordinate axis "z" an independent variable time is shown or the period o f watching (e.g. from 1997 to 2007).
x k ( % ) = P a r k ( % ) c o s<pk (2)
y k {%) = Park (%)sm(pk (3)
Each param eter is represented in the form o f a point, with three parameters used for representation o f the results in three-dimensional
space, where parameter m is the num ber o f years
observed.
Pa^ ( 0/oH w * ’zJ
(4)
Presentation o f results with a polar way o f data demonstration is improved since it shows the trend and not just information. The centre o f gravity o f the surface shape enclosed by polar coordinates o f observed parameters is calculated upon Equations (5) to (9). The shape contains a set o f n-triangles and the sum o f the «-centers o f the mass o f those triangles is the mass centre o f one observed time param eter [35].
xk
yk
1
Xk+
1
yk+
1 1
x
0
To1
( xo>To) = (°>0)
(
5
)/7 ,/7 -1
Z
s <x k i=l,/c=0
I s ,
n j7—1
Z
S,yk
i=l,k=0 y m = —
---(
7
)An algorithm draws and calculates polar coordinates for individual periods between the
year m-1 and the adjacent variable, and the year
m+1 and the adjacent variable. The year is
selected as a time argument typical for the branch since the product and technology changes are relatively slow.
The representation o f the centre o f mass in
a polar way Equation (
8
) to (10) providescomplete information related to an individual time period.
T p o lm = P n ,e J r " ( 8 )
p m = J x J + y J (9)
Time as the only independent variable is represented by the central axis in the graph, which is the result o f model visualization. The displacement o f dependent variables on time shows their importance and development upon time parameter.
There is an arbitrary num ber o f dependent variables in the model. They are configured in the circle around time in the form o f uniform distribution. For the purpose o f this investigation a model is prepared where data is uniformly distributed.
In the observed changing o f the trend it has been ascertained that linear accommodation is inaccurate.
These are higher order curves that are genomically imposed and on the bases o f polynomial curves and Fourier rows (harmonic analysis) in Equation (11) they form a trend for each parameter separately (curve accommodation is higher than 95%)
2 TJX _ 2 7DC a n 2 7DC = — + a , cos----+ a 7 cos2--- + ... + — cos«--- + ...
2 T T 2 T
, • 2 7DC . . 2 TDC . . . , . 2 TJX + 0, s i n - ^ - + o2 s i n 2 - ^ - + s i n ( « l ) ^
-( i i )
3.1 The Use of a model in the Example of Sanitary Fittings
There is practically no research to be found on the topic o f development o f sanitary fittings products. The field o f survey is from the production engineering point o f view, which is interesting due to the complexity o f the product. It is pre-supposed that sanitary fittings represent generic products which are intended for a wider range o f users.
The sample on which the first model o f multi-dimensional analysis is prepared with the intention o f product development covers eight time-dependent variables o f sanitary fittings. The products observed were sanitary fittings of middle-price range in Slovenia. The price and quality range was assumed on the basis o f expert opinions from the branch o f sanitary fittings production and from the branch o f sanitary fittings suppliers. The num ber o f the chosen sanitary fittings representatives comprises 95% o f the observed range, that is the sixteen most representative products o f the middle-priced range o f recognised European trade marks that were, and still are, present in the Slovenian market. The price range o f up to 110 EUR, for which certain marketing and production rules are applicable, is a so-called premium range. The characteristics that were observed in the chosen sanitary fittings were the following: price, shape, packaging, service, production costs, capacity, design complexity, and unclear influences given under the column other.
The questionnaire that was carried out in the market and among the Slovenian producers of
sanitary fittings showed the information
evaluation o f experts in the field o f sanitary fittings. In 1997 the characteristics o f the product in the market were the following: 30% o f its
value was represented by price,
10
% o f theoverall product was represented by the
importance o f its design, 5% was represented by its packaging, 5% by service, 20% by production
costs,
10
% by capacity,10
% by designcomplexity and 10% by other characteristics. The total o f the observed and covered parameters lies in the centre o f a polygonal form o f the observed characteristics.
In 1998 the same market and the same product were analysed. However, the latter included new characteristics this time. This paper represents the same number o f variables for each
year, with the intention o f showing the
functionality o f the system.
The established algorithm was modelled in the Matlab programme version 7.6.0.324. This
programme enables easy and transparent
recording o f algorithms. By means o f Matlab computing language, which contains a number o f
other functions for three-dimensional
presentations o f objects, three-dimensional
programming was also performed.
4 RESULTS AND PREPARATION
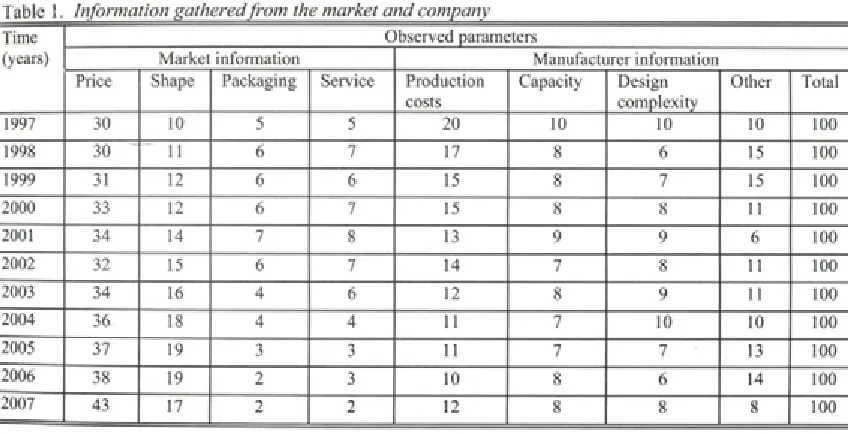
The established model has eleven years' worth o f recognised parameters (Table 1), which develop partly independently from one another. Even though the reviewed parameters do not have
much in common, they represent one product and development path within one time determinant. The combination o f market data and strategic know-how o f the company are thus presented in a graphically simple, transparent manner and within
a mathematically ascertainable system.
Polynomial interpolation and extrapolation allow the adjusted trend to offer values o f individual monitored parameters based on a set time-frame.
In polynomial interpolation, we find the
polynomial which corresponds to function / at given points.
If we are presented with N points, we
require a polynomial at IV-1, so that the set polynomial is uniform. Some functions may be interpolated well by using polynomials, while others pose more difficulty. Calculation o f polynomial interpolation is carried out by using Neville's algorithm. The trend determined in such a way will confirm future parameter values with a probability higher than 2 sigma. These values,
moreover, represent changes in product
development throughout future time-frames. There is an indication o f which way the product will lean towards and which parameters will be emphasised. This will give designers o f new products in the company guidelines for development, which will not be limited solely by the market, but also by the company. The
combination o f the company's internal -
economic arguments and external data obtained from the market, is presented as key in the literature [
6
], [10], [27] and [35].Table 1. Information gathered from the market and company
Time (years)
Observed parameters
Market information Manufacturer information Price Shape Packaging Service Production
costs
Capacity Design complexity
Other Total
1997 30 10 5 5 20 10 10 10 100
1998 30 11 6 7 17 8 6 15 100
1999 31 12 6 6 15 8 7 15 100
2000 33 12 6 7 15 8 8 11 100
2001 34 14 7 8 13 9 9 6 100
2002 32 15 6 7 14 7 8 11 100
2003 34 16 4 6 12 8 9 11 100
2004 36 18 4 4 11 7 10 10 100
2005 37 19 3 3 11 7 7 13 100
2006 38 19 2 3 10 8 6 14 100
The observed model shows the aggregate variable to be the centre o f gravity. Analysis of data in the future allows linear review or quadratic review o f the trend, including an arbitrary form o f establishing a trend based on lines o f respective independent variables.
The common trend o f spatial lines allows for analysis o f a common product development trend. It depends on the respective field whether data from the market or from the company is more important. When the model is ideal, all dependent variables may be presented arbitrarily at optional angles, and further broken down into
their dependent variables. When reviewing
independent variables this may be done in a classical circle diagram.
The system is limited by the values o f the dependent parameters o f the product, which
represent the limit value. This limit value is the limit which the company is not allowed to surpass
in a respective product development in
considering the model, as doing so would impair its competitiveness, which must be monitored with regard to all parameters o f the product. In this part the model looks to the finite elements analysis, where outer limits are recommended for development and establishment o f individual product parameters - summarised according to
[22],
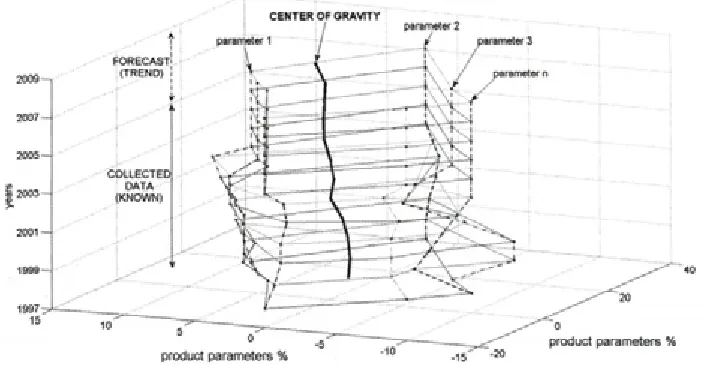
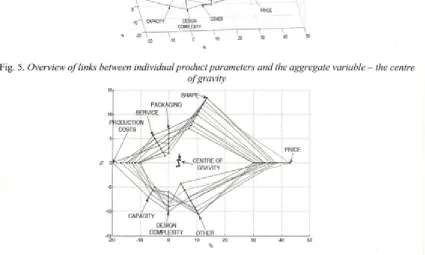
Fig. 5 shows the "skeleton" multidimensional graph o f product development. Limits to the system are set uniformly with boundary lines of
observed parameters. The central axis is
represented by the centre o f gravity, which is the aggregate variable, and indicates a trend, which is
presented in greater detail in Fig.
6
and Fig. 7.Fig. 5. Overview o f links between individual product parameters and the aggregate variable — the centre
o f gravity
Fig.
6
. The groundplan o f the graph shows deviation o f the centre ofgravity to the desiredproductFig.
6
shows a view o f the polar graphthrough various time-frames. The centre o f the eraph is the point o f time with coordinates T (0,
0
1997). The whole display otherwise presentsthe development o f individual product parameters and their mathematically ascertained trend.
The polar diagram shows shifts in the
gravitational centre from 1997 until 2010 - Fig.
6
and 7- The path travelled by the aggregate parameter, comes from the direction o f different
characteristics, which substantially mean
unchartered territory for the product in the direction o f the product design.
These data are appropriate and also logical considering that the industry is an unknown
variable. Development departments in the
company will thus have a goal to design an armature that will be interesting and demanding from a design point o f view. The direction o f development would be further improved by conducting an analysis o f the sense o f design and thus obtain the desired values. It is presumed that the product design in the observed class will summarise the features o f design in the higher class, which generally dictate the direction o f development o f lower and less demanding products in terms o f quality. They would also discover whether they are able to achieve the desired market design with the given technology and production costs, which would give the
model a moment o f strategic decision-making with regard to product development.
Fig.
8
gives us the opportunity toobserve a multidimensional curve, which is defined by the absolute value o f the angle o f aggregate indicator o f the trend o f the centre. These curves show a linear trend which, in the coming years, moves the centre o f the observed products towards the importance o f product design.
5 CONCLUSION
Life cycles o f technologies, products and
processes are becoming ever shorter, so
technological foresight is a very important aspect o f their planning. In a tim e when foretelling the developm ent o f products is difficult and the price o f error as steep as it is, the article offers a solution for the developm ent o f products
through m ultidim ensional analysis. An
alternative m anner o f product developm ent, it is based on a sim ple prem ise that an individual product in a certain time consists o f separate param eters, w hich make a whole.
The presented concept can be developed and adjusted tow ards all dim ensions o f m odem forecasting o f the developm ent o f m iddle range sanitary faucet products, which will, through time, show a deviation from the
orientation tow ards unexplored elem ents
tow ards product design.
60
[d e s ig n I
210 330
I CAPACITY
DESIGN PRETENTIOUS
jOTHER I SERVICE j
I p a c k a g in g! <•♦ •■CENTRE OF GRAVITY (TREND).... CENTRE OF GRAVITY (MEASURED)
A b s o l u t c e n t r e o f g r a v it y
Fig.
8
. Variation o f the absolute value and angle o f the centre in the observed time internalAdvanced options o f the defined model are:
• The introduction o f virtual reality into
strategic product development, which would allow a multilayered and even spatial analysis o f the outer limits o f the system, which delineate the logical scope o f development o f a single product.
• A comparison o f the development o f two
competing products through time, which would show the differences and similarities o f products and highlight the advantages and
disadvantages o f an individual product
through an analysis o f
10
parameters.• An opportunity to improve the visualization
o f the advantages and disadvantages in the business area the product is placed in.
• An opportunity to link the model directly with
production and computer prototyping.
• Trend forecasting on the basis o f extensive
experience.
• An opportunity to analyse the internal
characteristics o f the company and gathered external data. The internal data gathered within a company and market research data
allow simple and straightforward
development o f a concept o f further company development, and enable the assessment o f separate parameters through simulation. This is very important considering the fact that the limitations o f production are equally or more important than market demand (high tech products), w hich enables us to enforce the claim calling for a technology "push" and marketing "pull".
• Computer models include a data entry
interface which allows entry o f data for instantaneous analysis in the model, thus
effectively simulating w hether further
improvements remain reasonable [36].
• Analysis o f separate parameters with the aid
o f approximation o f existing movement by the movement o f the aggregate central variable; a joint concept would provide more detailed data about product development as it would allow double simulation.
• An opportunity to analyse the shift o f the
aggregate variable o f the body centre and its
deviation towards individual dependent
variables represents the quality o f such an analysis.
• Another option is the representation o f the
"onion" product strategy - on a model where the basic demand for the product is fulfilled and its transfer into higher levels improves the product.
• Choosing shorter periods o f time would not
allow for such detailed data. The line between both time intervals can be an approximated
value, which would indicate seasonal
movement o f product parameters.
The developed model o f product design through multi-criteria analysis can be used in the development o f virtually any mass produced product.
6
REFERENCES[1] Cooper, R. G. N ew product strategies: what
distinguishes the top performers? Journal o f
product innovation management, September 1984, vol. 1, no. 3, p. 151-164.
Successful Product Innovation in Large
Finns. Organization Science, M ay 1992, voi.
3
, no. 2, p. 179-202.1
-3
] The POMA Handbook o f new productdevelopment. 2nd ed. Hoboken (N. Y.): Wiley, cop. 2005. XIII, 625 p. ISBN 0-471- 48524-1
[
4
] Ulrich, K. T., Eppinger, S. D. Product designand development. 2nd ed. Boston:
Irwin/McGraw-Hill, 2000. XXVI, 358 p. ISBN 0-07-229647-X
[
5
] Clark, K. B., W heelwright, S. C. Managingnew product and process development: text and cases. New York [etc.]: The free press: Simon & Schuster, 1993. XV, 896 p. ISBN 0-02-905517-2
[
6
] Crawford, C. M., Di Benedetto, C. A. Newproducts management. 9th ed. Boston [etc.]: McGraw-Hill/Irwin, 2008. XVIII, 558 p. ISBN-13 978-0-07-352988-2
[
7
] Green, P. E., Krieger, A. M., Zelnio, R. N. Acomponential segmentation model with
optimal product design features. Decision
science, June 1989, voi. 20, no. 2, p. 2 2 1 - 238.
[
8
] Urban, G. L., Hauser, J. R. Design andmarketing o f new products.
2
nd ed.Englewood Cliffs (New Jersey): Prentice
hall, - London [etc.]: Prentice hall
international, cop. 1993. XXVII, 701 p. ISBN 0-13-201567-6
[
9
] Goldenberg, J., M azursky, D. Creativity inproduct innovation. 3rd printing. Cambridge (LI. K.) [etc.]: Cambridge university press, 2004. XIII, 224 p. ISBN 0-521-80089-7
[10] Cooper, R. G. Winning at new products:
accelerating the process from idea to launch. 3rd ed. Reading (Mass.): Perseus, 2001. XIII, 425 p. ISBN-13 978-0-7382-0463-5
[11] Griffin, A. L,-Hauser J. R. Integrating R&D
and marketing: a review and analysis o f the
literature. Journal o f product innovation
management, M ay 1996, voi. 13, no. 3, p. 191-215.
[12] Currim, I. S. Using segmentation approaches
for better prediction and understanding from
consumer mode choice models. Journal o f
marketing research, A ugust 1981, voi. 18, no. 3 ,p . 301-309.
[13] Chul-Yong, L., Jeong-Dong, L., Yeonbae, K.
Demand forecasting for new technology with a short history in a competitive environment:
the case o f the home networking market in
South Korea. Technological forecasting &
social change, January 2008, voi. 75, no. 1, 91-106.
[14] Jamieson, L. F., Bass, F. M. Adjusting stated
intention measures to predict trial purchase o f new products: a comparison o f models
and methods. Journal o f marketing research,
August 1989, voi. 26, no. 3, p. 336-345.
[15] Morrison, D. G. Purchase intentions and
purchase behaviour. Journal o f marketing,
spring 1979, voi. 43, No. 2, p. 65-74.
[16] Handbook o f marketing. Weitz, B. A. (ed.),
W ensley, R. (ed.). London, Thousand Oaks, New Delhi: Sage, 2002. XIX, 582 p. ISBN 978-0-7619-5682-2
[ 17] Kmetovicz, R. E. New product development:
design and analysis. New York: Wiley, cop. 1992. XIII, 334 p. ISBN 0-471-55536-3
[18] Jamieson, L. F., Bass, F. M. Adjusting stated
intention measures to predict trial purchase o f new products: a comparison o f models
and methods. Journal o f marketing research,
August 1989, voi. 26, No. 3, p. 336-345.
[19] Cooper, R. G. (1984). How new product
strategies impact on performance. Journal o f
product innovation management, January
1984, voi. 1, no. l , p . 5-18.
[20] Smith, P. G., Reinertsen D. G. Developing
products in half the time. 2nd ed. New York:
Wiley, 1998. XIX, 298 p. ISBN
0-471-29252-4
[21] Allen, T. J. Managing the flow o f
technology: technology transfer and the dissemination o f technological information within the R&D organization. 1st pbk. print. Cambridge (Mass.), London: MIT Press,
1984. XIV, 320 p. ISBN 0-262-51027-8
[22] Palčič, L, Polajnar, A., Pandža, K. A model
for the effective management o f order-based
production, Journal o f Mechanical
engineering, 2003, voi. 49, no. 7/8, p. 3 9 8 - 412.
[23] Cancer V. (2007). Frame procedure for
multi-criteria decision making (in
Slovenian). Organization, 2007, voi. 40, no.
5, p. A160-A 167.
[24] Glavač, M., Ren, Z. = Multicriterial
optimization o f a car structure using a finite
element method, Journal o f Mechanical
[25] Imai, M. K y ’zen: the key to Japan’s
competitive success. New York [etc.]:
McGraw-Hill, 1986. XXXIII, 259 p. ISBN 0-07-554332-X
[26] Denting, W. E. Out o f the crisis. 1st MIT
Press ed. Cambridge (Mass.): MIT Press, 2002. XIII, 507 p. ISBN 0-262-54115-7
[27] Schäppi, B., Andreasen, M. M., Kirchgeorg,
M., Radermacher, F. J. Handbuch
Produktentwicklung. Miichen [etc.]: C.
Hanser, cop. 2005. XXVI, 838 p. ISBN 3- 446-22838-1
[28] Buchmeister, B., Kremljak, Z., Pandža, K.,
Polajnar, A. Simulation study on the
performance analysis o f various sequencing
rules. International journal o f simulation
modelling, June/September 2004, voi. 3, no. 2-3, p. 80-89
[29] Mitrouchev, P., Brun-Picard, D. A new
model for synchronous multi agents
production amongst clients and
subcontractors. International journal o f
simulation modelling, September 2007, voi.
6
, no. 3, p. 141-153.[30] Vujica-Herzog, N., Polajnar, A., Tonchia, S.
Development and validation o f business process reengineering (BPR) variables: a survey research in Slovenian companies.
International Journal o f Production
Research, December 2007, voi. 45, no. 24, p. 5811-5834.
[31] Baumgartner, B., Steiner, W. J. Are
consumers heterogeneous in their
preferences for odd and even prices? Findings from a choice-based conjoint study.
International journal o f research in
marketing, December 2007, voi. 24, no. 4, p. 312-323.
[32] Baker, G., Gibbons R., Murphy, K. J.
Relational contracts and the theory o f the
firm. The quarterly journal o f economics,
February 2002, vol. 117, no. 1, p. 39-84.
[33] Gilmore, J. H. and Pine, J. 2nd. The four
faces o f mass customization. Harvard
business review, January-February 1997, voi. 75, no. 1, p. 91-101.
[34] Baker, G., Gibbons R., Murphy, K. J.
Informal Authority in Organizations. Journal
o f law, economics, and organization, March 1999, voi. 15, no. l , p . 56-73.
[35] Market research fo r PE Armai: internal
literature (in Slovenian). Maribor: Maribor Foundry Company, 2006.
[36] Bronstejn I. N., Semendjajev K. A.
Mathematics handbook fo r engineers and students o f technical colleges (in Slovenian). 5lh edition. Ljubljana: Technical Publisher of Slovenia, 1978. p.699
[37] Polajnar, A. [etc.]. Management o f
production systems — contemporary concepts
(in Slovenian). Maribor: Faculty of
Mechanical Engineering 2004. VII, 506 p. ISBN 86-435-0666
[38] Buchmeister, B. Investigation o f the
Bullwhip effect using spreadsheet
simulation. International journal o f