A b s t r a c t. The aim of this paper was to show how the shape of sand particles affects the results of particle size distribution obtained by the laser diffraction method. On the basis of the results obtained one can conclude: the shape of the investigated particles influences particle size distribution obtained by the laser diffrac-tion method. This phenomenon occurs in the sand fracdiffrac-tion, as shown in our investigation. The importance of this effect depends on the type of the measured material and on the aim of the investigations. For most researchers in soil science and sedimentology who investigate sand fractions, this impact can be negligible. Further investigations with other soil and sediment fractions are needed.
K e y w o r d s: laser diffraction method, shape of particles, sand
INTRODUCTION
Particle size distribution (PSD) is one of the most impor-tant soil parameters often used in soil, geological, and geo-morphological laboratories (Blott and Pye, 2012; Dobro-wolski et al., 2012; Kabala and Zapart, 2012). The wide use of PSD can be confirmed by the fact that knowledge of PSD is needed to determine the physicochemical processes occurring in the soil (Hajnos et al., 2013; Mohammadi and Meskini-Vishkaee, 2013), pedotransfer functions (Lamorski et al., 2008; Sepaskah and Tafteh, 2013), fractal dimension (Bieganowski et al., 2013; Gunal et al., 2011), and microbial activity (Hamarshid et al., 2010; Walkiewicz et al., 2012).
There are two main techniques of soil PSD measure-ments: sieve-sedimentation (SSM) and laser diffraction me-thods (LDM). Among the many varieties of sieve-sedimen-tation methods, the most commonly used are the pipette (Verbist et al., 2012) and the hydrometer methods (Mocek et al., 2012), but older techniques are still used (Brogowski and Kwasowski, 2012).
LDM has gained recognition and is widely used in labo-ratories (Ry¿ak and Sochan, 2013; Vendelboe et al., 2012), however, it bears some inadequacy, compared with the results of sedimentation methods (Kovalenko and Babuin, 2013; Vdoviæ et al., 2010), eg underestimation of the clay fraction has been reported (Di Stefano et al., 2010).
One of the causes of the differences between the PSD data obtained by SSM and LDM can be the shape of soil particles (Bah et al., 2009; Di Stefano et al., 2010; Eshel et al., 2004). Sphericity of measured particles is the assump-tion of both methods, so the deviaassump-tion from sphericity is one of the sources for error in both methods. Trying to answer this question, one should probably consider separately the different size fractions present in the soil, since a different situation is encountered in the case of sand fraction, where particles are more or less similar in shape to a sphere, and a different situation in the clay fraction, where some particles have a completely different shape eg plate mica particles.
Several studies were carried out to investigate the in-fluence of the particle shape on the results of PSD obtained by LDM (Matsuyama and Yamamoto, 2004; Tinke et al., 2005) but most of them concentrated on the finer (silt and clay) fractions (Dur et al., 2004; Fedotov et al., 2007). There Int. Agrophys., 2014, 28, 195-200
doi: 10.2478/intag-20014-0008
Influence of the sand particle shape on particle size distribution measured by laser
diffraction method**
Cezary Polakowski1, Agata Sochan1*, Andrzej Bieganowski1, Magdalena Ry¿ak1, Rita Földényi2, and Judit Tóth3
1Institute of Agrophysics, Polish Academy of Sciences, Doœwiadczalna 4, 20-290 Lublin, Poland 2
Department of Earth and Environmental Sciences, University of Pannonia, Egyetem 10, H-8200 Veszprém, Hungary 3
Institute of Materials and Environmental Chemistry, Research Centre for Natural Sciences, Hungarian Academy of Sciences, Pusztaszeri 59-67, H-1025 Budapest, Hungary
Received November 5, 2013; accepted January 3, 2014
© 2014 Institute of Agrophysics, Polish Academy of Sciences
*Corresponding author e-mail: [email protected]
**The work was partly financed from the budget of the National Science Centre (Poland), No. N N310 777440, 2011-2014, and for bilateral cooperation between Polish Academy of Sciences and Hungarian Academy of Sciences.
A
A
are, however, a relatively low number of papers dealing with the sand fraction in this regard. A question of rapid and reliable measurement of sand fractions is important not only for soil scientists but (perhaps even primarily) for geolo-gists, geomorphologeolo-gists, and engineers eg road construc-tion. The aim of this study was to investigate whether the shape of the sand particles affects the results of the particle size distribution by LDM and whether this potential effect is significant in the context of the use of LDM for this type of research.
MATERIAL AND METHODS
Three sand sediments were taken for the measurements. The origin of the sand and the resulting shape of the particles were the criterion of sediment selection. The three localiza-tions of sampled sediments were as follows:
– Pieszowola (Lublin Voivodeship, SE Poland) – aeolian sediment sampled from the dorsal part of an inland dune; – Pierwoszów (Lower Silesian Voivodeship, SW Poland)
- fluvio-glacial sediment sampled from the forms created by the action of melting water (Riss glaciation);
– Murowaniec (Lesser Poland Voivodeship, south Poland) - fluvial sediment sampled from the bed of a mountain stream in the Tatra Mountains – the area of headwaters.
Figure 1 illustrates the particle shape characteristic for three investigated sediments. Images of particles were re-corded by a Morphologi G3 microscope (Malvern, UK).
A very fine sand fraction (0.05-0.1 mm) was used in the experiment. The arguments for the choice of this fraction were as follows:
– the relatively small range of the size (but equal to one of the sub-fractions of sand), which gives the possibility to use one magnification (one lens) of the microscope. When the size range is wide, two (or more) magnifications should be used and the identification of the particles is difficult ie one has to answer which particle was measured using another magnification;
– it was possible to separate this fraction by dry sieving. Separation of the fraction using sedimentation in sus-pension does not give such a well-defined range of the size - particle size boundaries are fuzzy;
– selection of bigger size fractions can cause problems with homogenisation of the suspension during the measure-ments (Sochan et al., 2012). The summary of basic infor-mation about the investigated samples is shown in Table 1.
Sieving of the investigated fraction of the sand was performed on a shaker Analysette 3 (Fritsch, Germany). Before fractionation, the sand samples were treated with hexametaphosphate and sodium carbonate to remove finer particles that were glued to the larger particles.
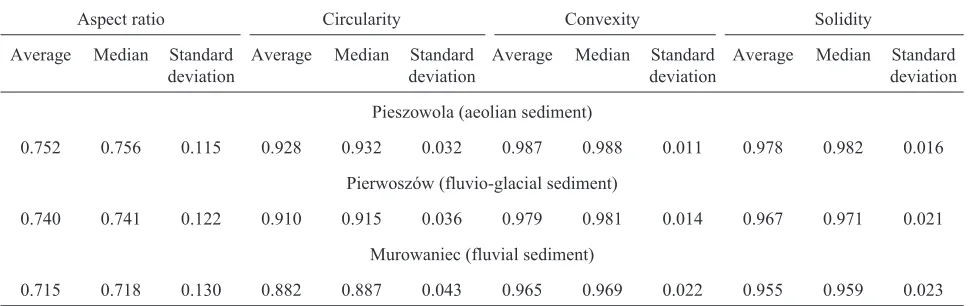
Aspect ratio Circularity Convexity Solidity
Average Median Standard deviation
Average Median Standard deviation
Average Median Standard deviation
Average Median Standard deviation Pieszowola (aeolian sediment)
0.752 0.756 0.115 0.928 0.932 0.032 0.987 0.988 0.011 0.978 0.982 0.016
Pierwoszów (fluvio-glacial sediment)
0.740 0.741 0.122 0.910 0.915 0.036 0.979 0.981 0.014 0.967 0.971 0.021
Murowaniec (fluvial sediment)
0.715 0.718 0.130 0.882 0.887 0.043 0.965 0.969 0.022 0.955 0.959 0.023
T a b l e 1. Basic information about the sand samples investigated
Fig. 1. Characteristic shapes of the sand grains from the three investigated sediments: a – Pieszowola, b – Pierwoszów, and c – Murowaniec.
Sieving on the sieves does not guarantee the same PSD of the sieved materials. It gives only the same borders of the range (in the discussed case 0.05÷1 mm) but the particles in the range between the borders can have very different PSDs. Although a lot of sand sediments were available, only 3 were selected due to the criterion of PSD similarity between the selected size fractions (Fig. 2 and Table 2).
The Morphologi G3 (Malvern, UK) optical microscope with software was used for measurements of size and shape factors of sand particles. Air dry sand samples were dis-persed on the microscope glass using sample dispersion unit (SDU), (Malvern, UK). This ensured even arrangement of particles on the glass and limited the effect of adhesion of individual particles to each other. Morphology G3 makes it possible to scan and record the image of all measured particles. The software allows analysing the shape and size parameters. The 10x lens was used; therefore, the real magnification was nearly 500x. The software procedure was utilized to remove the dust particles from image analysis (Bieganowski et al., 2011).
The definitions of shape parameters were used accord-ing to the Malvern G3 manual, the ratio of the: width to the length of the particle (aspect ratio); perimeter enclosed by the convex hull to the actual perimeter of the particle
(convexity); actual area of the particle to the area enclosed by the convex hull (solidity). Circularity is defined as a ratio of the perimeter of a circle having the same area as the projected area of the particle to its actual perimeter. (Morphologi G3 Series User Manual, 2008, Malvern Instruments Ltd.)
Mastersizer 2000 with a Hydro G dispersion unit (Malvern, UK) was used as a laser diffractometer. The para-meters of the measurement were set as follows: the pump and stirrer speeds 1 750 and 700 r.p.m., recpectively (Sochan et al., 2012). Mie theory was used for calculation of PSD with the following indices, refractive index for: water – 1.33, sand – 1.52; and absorption index – 0.1. Measuring time was set to 60 s for each measurement (30 s for red light and 30 s for blue light). The apparatus took 1000 shots per second. PSD using LDM was measured 3 times (3 samplings) in 3 replications.
RESULTS AND DISCUSSION
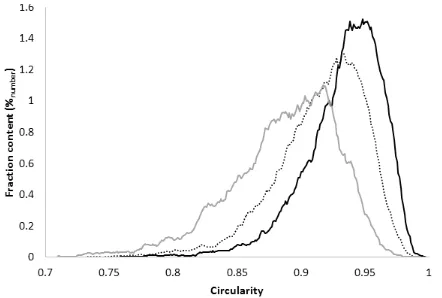
Circularity was the best parameter which allowed distin-guishing the sand samples measured by microscopy (Fig. 3). For the other shape parameters (Table 1), even if the average or median values were different, the distributions were not fairly differential.
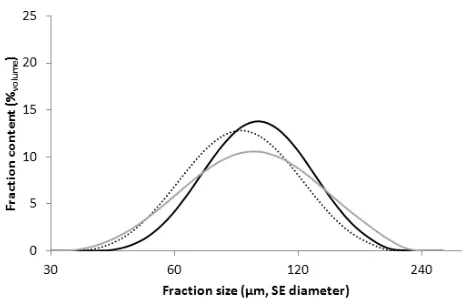
Fig. 2. PSDs (expressed as the CE diameter) of the investigated sands obtained by the image analysis from the optical microscope.
Localization
Deciles of PSD obtained
LDM (mm) Light microscopy (mm)
d (0.1) d (0.5) d (0.9) d (0.9) – d (0.1) d (0.1) d (0.5) d (0.9) d (0.9) – d (0.1)
Pieszowola 69.4 100.6 145.5 76.1 71.2 92.2 122.3 51.1
Pierwoszów 61.1 91.4 136.5 75.4 73.7 96.8 126.3 52.6
Murowaniec 59.6 97.6 158.3 98.7 77.0 101.3 132.8 55.8
T a b l e 2. Comparison of deciles for PSDs obtained by the LDM and image analysis (images from the light microscope). For LDM, the PSDs refer to the SE and for light microscopy the PSDs refer to the CE diameter
It should be noticed that the distributions obtained by LDM refer to the SE diameter (sphere equivalent diameter – that is, the diameter of a sphere having the same volume as the measured particle) and distributions obtained by image analysis refer to the CE diameter (circle equivalent diameter – that is, the diameter of a circle having the same area as the measured particle). This is the consequence of 3D (LDM) and 2D (image analysis) measurements. Apart from this, it seems that comparison of these two distributions (without recalculating the surface into volume and the volume into surface) is justified because these distributions refer to a di-mensionless faction in the whole. The recalculation will add an additional, difficult to estimate, error.
The results of PSDs from LDM are presented in Fig. 4 and Table 2. It can be seen that the distributions differ from each other. The widest distribution can be observed for the sand from Murowaniec. Its width (expressed by the diffe-rence between the 9th and the 1st decile) is about 30% grea-ter than for other distributions. The cause of this discre-pancy, comparing the results obtained with microscopy, may be the shape of the particles. Given the distributions of circularity (Table 1, Fig. 2), it is visible that the particles from Murowaniec are the least spherical. However, the differences in the circularity between sand particles from Pieszowola and Pierwoszów (Table 1, Fig. 2) do not influen- ce the differences in peak widths (Table 2).
While analysing the medians of PSDs obtained by LDM, it is difficult to find any correlation with circularity. The difference between the medians for Pieszowola and Pierwoszów distributions are nearly 10%. The value of the Murowaniec median is between them, but much closer to that of Pieszowola. However, the circularity changes (from largest to smallest) as follows: Pieszowola, Pierwoszów, Murowaniec.
In order to interpret the information contained in Table 2, one should remember about the differences between the two measurement methods. Comparing PSDs obtained by both methods, it can be concluded in the case of every sand sample:
– the 1st decile is bigger for image analysis; – the medians have, more or less, similar values; – the 9th decile is in all cases bigger for LDM.
Confirmation of this can be found in Figs 3 and 4, where one can clearly see that the distributions obtained using the image analysis are more slender. This result can occur because of:
– 2D analysis of 3D particles. During the scan, the sand par-ticles lay on a microscope slide on the most stable surface, ie usually on the largest surface. This can be explained when one imagines the hemisphere of a spherical particle (this occurs frequently for crushed particles). From the image analysis one would get the information of ideal sphericity. However, in reality, the shape is far from this ideal situation.
– The rotation of particles in LDM. In other words, in this method the particles are ‘viewed’ from all sides. This can be explained in the following thought experiment: assuming that all measured particles are round rods and all have the same diameter and the same length, in image ana-lysis one would obtain very slender distribution (all par-ticles seen as the same rectangles), while in LDM one would obtain quite wide distribution – relative to the laser beam, the particles would be randomly arranged. In ex-treme cases, the particle would appear as a rectangle (exactly the same as under the microscope) or as a circle with a diameter of the rod. Obviously, all intermediate states would be possible, too. The consequence of this would be a wide PSD obtained by LDM.
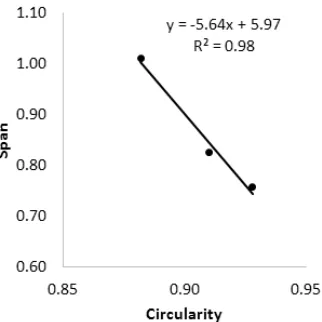
To describe distribution width, the values of span are often used for laser diffraction results (Malvern Operation Guide, 1999):
span d d
d
= ( . )- ( . ) ( . )
0 9 01
0 5 (1)
where: d(0.1), d(0.5), and d(0.9) are the 1st, 5th and 9th decile, respectively.
The dependence between span and circularity of the sand particles is shown in Fig. 5.
The observation presented in Fig. 5 is comparable with the results presented in the paper of Tinke et al. (2008). The authors also stated that for non-spherical particles one can expect widening of the size distribution – both in the direc-tion of larger and smaller particles.
The above detailed results showed that the shape of sand particles influences the PSDs obtained by LDM. Yet, the question is whether this influence is significant or not. It seems that the answer depends on the aim of investigations and the researcher should answer this question himself each time.
The above-presented data were obtained for especially selected sand samples, where the biggest differences in the shape were the criterion of the choice. The differences of
PSDs (expressed for instance as a median or width of dis-tribution) are smaller than for PDSs obtained for 28 measu-rements from a 0.5 ha cultivated field in the north of the Czech Republic (unpublished data). This conclusion is also confirmed in the literature. For instance, Kursun (2009) stated that sand particles with a circularity value greater than 0.78 can be treated as spherical.
In turn, Blott and Pye (2006) recommended caution in interpreting the results of laser diffraction measurements for the sand fraction. They confirmed the precision and quick-ness of the analysis, but even when the analyzed particles were nearly perfect spheres they obtained the differences between the results obtained by sieve and laser diffraction methods. However, in their case, there is an entirely different issue of comparability of results of LDM with the sieve method.
Califice et al. (2013) investigated particles with extre-mely different shapes including a high aspect ratio (the par-ticles were elongated). Although they investigated very dif-ferent materials, these types of shapes can sometimes occur in the finest fraction of soil – in the clay and silt fractions. They concluded that LDM interpretation of the results, when measured particles have low circularity, should be cautious.
CONCLUSIONS
1. The shape of the investigated particles influences the particle size distribution obtained by laser diffraction methods. As shown in our investigation, this phenomenon occurs in the sand fraction. The importance of this effect depends on the type of the measured material and on the aim of the investigations.
2. For most researchers in soil science and sedimen-tology who investigate sand fractions, this impact can be negligible.
3. Further investigations with other soil and sediment fractions are needed.
REFERENCES
Bah A.R., Kravchuk O., and Kirchof G., 2009. Fitting perfor-mance of particle-size distribution models on data derived by conventional and laser diffraction techniques. Soil Sci. Soc. Am. J., 73, 1101-1107.
Bieganowski A., Chojecki T., Ry¿ak M., Sochan A., and Lamorski K., 2013. Methodological aspects of fractal dimension estima-tion 1 on the basis of PSD. Vadose Zone J., 12(1), 1-9.
Bieganowski A., Krusiñska A., and Ry¿ak M., 2011. A method for the elimination of measurement error in light microscopy examinations of the geometry of starch granules. Int. Agro-phys., 25, 193-196.
Blott S.J. and Pye K., 2006. Particle size distribution analysis of sand-sized particles by laser diffraction: an experimental investigation of instrument sensitivity and the effects of particle shape. Sedimentology, 53, 671-685.
Blott S.J. and Pye K., 2012. Particle size scales and classification of sediment types based on particle size distributions: Review and recommended procedures. Sedimentology, 59, 2071-2096.
Brogowski Z. and Kwasowski W., 2012. Distribution of organic matter in the particle size fractions of lateritic soil (Plinthosol). Soil Sci. Ann., 64(4), 9-15.
Califice A., Michel F., Dislaire G., and Pirard E., 2013.
Influence of particle shape on size distribution measure-ments by 3D and 2D image analyses and laser diffraction. Powder Technol., 237, 67-75.
Di Stefano C., Ferro V., and Mirabile S., 2010. Comparison between grain-size analyses using laser diffraction and sedimentation methods. Biosys. Eng., 106, 205-215.
Dobrowolski R., Bieganowski A., Mroczek P., and Ry¿ak M., 2012. Role of periglacial processes in epikarst morpho-genesis: a case study from Che³m Chalk Quarry, Lublin Upland, Eastern Poland. Permafrost Periglac. Process., 23(4), 251-266.
Dur J.C., Elsass F., Chaplain V., and Tessier D., 2004. The relationship between particle-size distribution by laser gra-nulometry and image analysis by transmission electron micro-scopy in a soil clay fraction. Eur. J. Soil Sci., 55, 265-270.
Eshel G., Levy G.J., Mingelgrin U., and Singer M.J., 2004.
Critical evaluation of the use of laser diffraction for par-ticle-size distribution analysis. Soil Sci. Soc. Am. J., 68, 736-743.
Fedotov G.N., Shein E.V., Putlynev V.I., Arkhangel'skaya T.A., Eliseev A.V., and Milanovskii E.Y., 2007. Physicochemi-cal bases of differences between the sedimentometric and laser-diffraction techniques of soil particle-size analysis. Eurasian Soil Sci., 40(3), 281-288.
Gunal H., Ersahin S., Uz B.Y., Budak M., and Acir N., 2011.
Soil particle size distribution and solid fractal dimension as influenced by pretreatments. J. Agr. Sci., 17, 217-229.
Hajnos M., Ca³ka A., and Józefaciuk G., 2013. Wettability of mineral soils. Geoderma, 206, 63-69.
Hamarshid N.H., Othman M.A., and Hussain M.-A.H., 2010.
Effects of soil texture on chemical compositions, microbial populations and carbon mineralization in soil. Egypt. J. Exp. Biol. (Bot.), 6(1), 59-64.
Kabala C. and Zapart J., 2012. Initial soil development and carbon accumulation on moraines of the rapidly retreating Werenskiold Glacier, SW Spitsbergen, Svalbard archipe-lago. Geoderma, 175-176, 9-20.
Kovalenko C.G. and Babuin D., 2013. Inherent factors limiting the use of laser diffraction for determining particle size distributions of soil and related samples. Geoderma, 193-194, 22-28.
Kursun I., 2009. Particle size and shape characteristics of kemer-burgaz quartz sands obtained by sieving, laser diffraction and digital image processing methods. Miner. Process. Extr. M., 30(4), 346-360.
Lamorski K., Pachepsky Y., and S³awiñski C., 2008. Using sup-port vector machines to develop pedotransfer functions for water retention of soils in Poland. Soil Sci. Soc. Am. J., 72(5), 1243-1247.
Malvern Instruments Ltd., 2008. Morphologi G3 User Manual. Malvern Instruments Ltd., Malvern, UK.
Malvern Operators Guide, 1999. Malvern Press, Malvern, UK.
Matsuyama T. and Yamamoto H., 2004. Particle shape and laser diffraction: a discussion of particle shape problem. J. Disper. Sci. Technol., 25(4), 1-8.
Mocek A., Spychalski W., Dobek A., and Mocek-P³óciniak A., 2012. Comparison of three methods of copper speciation in chemically contaminated soils. Polish J. Eniviron. Stud., 21(1), 159-164.
Mohammadi M.H. and Meskini-Vishkaee F., 2013. Predicting
soil moisture characteristic curves from continuous particle- size distribution data. Pedosphere, 23(1), 70-80.
Ry¿ak M. and Sochan A., 2013. A Simple method for estimating particle numbers using a laser diffractometer. Polish J. Environ. Stud., 22(1), 213-218.
Sepaskah A.R. and Tafteh A., 2013. Pedotransfer function for estimation of soil-specific surface area using soil fractal dimension of improved particle-size distribution. Arch. Acker. Pfl. Boden., 59(1), 93-103.
Sochan A., Bieganowski A., Ry¿ak M., Dobrowolski R., and Bartmiñski P., 2012. Comparison of soil texture determi-ned by two dispersion units of Mastersizer 2000. Int. Agrophys., 26, 99-102.
Tinke A.P., Vanhoutte K.,Vanhoutte F., De Smet M. and De and Winter H., 2005. Laser diffraction and image analysis as a supportive analytical tool in the pharmaceutical deve-lopment of immediate release direct compression formula-tions. Int. J. Pharm., 297, 80-88.
Tinke A.P., Carnicer A., Govoreanu R., Scheltjens G., Lauwe-rysen L., Mertens N., Vanhoutte K., and Brewster M.E., 2008. Particle shape and orientation in laser diffraction and static image analysis size distribution analysis of micro-meter sized rectangular particles. Powder Technology, 186, 154-167.
Vdoviæ N., Obhoðaš J., and Pikelj K., 2010. Revisiting the particle-size distribution of soils: comparison of different methods and sample pre-treatments. Eur. J. Soil Sci., 61, 854-864.
Vendelboe A.L., Moldrup P., Schjonning P., Oyedele D.J., Jin Y., Scow K.M., and de Jonge L.W., 2012. Colloid release from soil aggregates: application of laser diffraction. Vadose Zone J., 11(1).
Verbist M.J., Pierreux S., Cornelis W.M., McLarenc R., and Gabriels D., 2012. Parameterizing a coupled surface- sub-surface three-dimensional soil hydrological model to eva-luate the efficiency of a runoff water harvesting technique. Vadose Zone J., 11(4).