A b s t r a c t. Analysis of geometrical features of 3D granular assemblies poses difficulties in visualization of the effects taking place within the volume of the sample. This work presents the method for visualization of spatial distribution of the contact points in a monodisperse; frictional assembly composed of spheres and generated using three filling methods for a cuboidal or cylindrical container. The visualization is based on the projection of the con-tact points between particles on a hypothetical sphere followed by their representation on the plane. The proposed method was found to adequately visualize differences in the spatial structure of as-semblies generated using various filling methods.
K e y w o r d s: granular material, granular assembly, packing structure, distribution of contacts, contact network
INTRODUCTION
Loads exerted by granular materials on the construction members of storage and processing equipment are the result of interactions between particles and depend on their spatial distribution in the deposit. Numerous projects were conduc-ted to find a description of mechanical behaviour of a granu-lar assembly based on mechanical interactions between par-ticles. Many experimental investigations were performed to interpret the phenomena that take place in granular mate-rials, but are hardly observed in gases, liquids nor solids, such as anisotropy of mechanical properties (Nouguier-Lehon et al., 2003; Mueller, 1993), pressure switch at the start of silo discharge (Moysey, 1979), or asymmetry of load distribution during eccentric discharge of a silo (Horabik et al., 1993; Koby³ka and Molenda, 2013). One of the promis-ing methods for analysis of mechanical phenomena in gra-nular materials is the numerical distinct element method proposed by Cundall and Strack (1979). The method allows estimation of the pressure distribution within an assembly and loads exerted by the deposit based on the analysis of
distribution of inter-granular forces and their changes during deformation (Sitharam and Shimizu, 2000; Sykut et al., 2008). It is not possible to validate such method in an experiment without disturbance of the sample structure. At an early stage, simulations using DEM were focused on the packing structure (Rothenburg and Bathurst, 1989) and methods for visualization of the contact network between particles (Drescher and de Josselin de Jong, 1972) and were conducted on 2D assemblies of a relatively low number of circular particles. In the case of 3D assemblies, there is still no satisfactory method for visualization of the network of contact points and contact forces. One of the promising approaches is the proposal of Fisher et al. (1987) to connect contact points of equal probability with isolines and to project the obtained figure on the surface of a sphere.
In the case of two-dimensional particles, representation of contact forces in the form of polar distribution got wide acceptance. No such method of wider acceptance exist for visualization of distribution of contact forces in the of 3D assemblies. As we have started DEM numerical simulations of behavior of granular systems under various conditions of mechanical load, the attempt to elaborate method of visua-lization reported in this work was undertaken. In this work, a method for visualization of distribution of vectors normal to contact areas (contact normals) and the contact forces in a 3D assembly of spheres is proposed. Examples of the ap-plication of the method in analysis of the assembly structure are also shown.
MATERIALS AND METHODS
Numerical simulations of filling cuboidal and cylindri-cal containers were performed using the PAPA software obtained from the web page of the University of Stuttgart Int. Agrophys., 2013, 27, 275-281
doi: 10.2478/v10247-012-0095-6
Visualization of characteristics of the contact network between spheres in 3D assembly
R. Koby³ka* and M. Molenda
Institute of Agrophysics, Polish Academy of Sciences, Doœwiadczalna 4, 20-290 Lublin, Poland
Received October 31, 2012; accepted May 5, 2013
© 2013 Institute of Agrophysics, Polish Academy of Sciences
*Corresponding author e-mail: [email protected]
mented by the authors in the PAPA package:
F=k xn +cx v 3 2
1
2 , (1)
where: x – stands for an overlap between two particles, v – re-lative velocity, kn – spring stiffness defined as (E – Young modulus):
kn=4E R 3
1 2
* * , (2)
E E E
E v E v
i j
i j j i
*
( ) ( )
=
- +
-1 1 , (3)
and the reduced particle radius (R*):
R R R
R R
i j
i j
*=
+ . (4)
Indexes i and j refer to the number of the particle (particle id) and i¹ j. Factor c is the effective dissipative factor related to the bulk viscosities Bi, Bj, si, sj and the radii of curvature of the colliding bodies:
c=2B R 1 2
* * , (5)
B B B
B B
i j
i j j i
*
( ) ( )
=
- +
-1 s 1 s . (6)
The first term of the expression (1) describe the non-linear dependence on an overlap of the normal force acting between two perfect elastic spheres according to the Hertz theory. The second, also nonlinear dissipative part is similar to the original Hertz approach based on the bulk viscosity parameters. The mechanical parameters of the particles were taken as equal to the properties of rapeseed (Molenda and Stasiak, 2002; Wi¹cek and Molenda, 2011; Wojtkowski et al., 2010): Young modulus E of 8.7 MPa, Poison ratio nof 0.17, coefficients of inter particle friction mpp and wall-particle friction mwboth of 0.3, parameters of damping B of 708.2 Ns m-2 and sof 0.15, particle density r of 1 050 kg m-3.
Based on the coordinates of generated particles, the code was written to analyze and visualize the network of the contacts between particles in a chosen moment of simulation as explained below.
mation possible is described by the second condition, which must be checked during the computation:
Ù
¹ - + - =
i j (xj xi) (yj yi)
2 2
0 . (8)
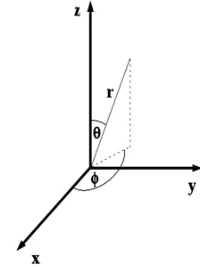
Condition 2 (Eq. (7)) is satisfied only in the case of xi=xj and yi=yj ie the contact point is located on a line parallel to z axis in Cartesian coordinate system, which in the case of the spherical coordinates means, it is located at the pole (q =0 or q=m, f – undefined). Otherwise the coordinates of the contact point may be uniquely transformed to the spherical coordinate system. In both the Cartesian and spherical systems of coordinates, three coordinates are necessary to describe the location of a point in the space. In the Cartesian system, these are three linear coordinates x, y, z, while in the spherical system one linear distance r and two angles f and q are used (Fig. 1).
Angle f measured at the XY plane is determined as:
f= -æ è ç ç ö ø ÷ ÷
arc y y
x x
j i
j i
tan , (9)
when xj - xi <0 and yj - yi³ 0, angle f has to be augmented by
p. In turn, when xj - xi <0 and yj - yi < 0, angle f has to be
contracted by p. In order to obtain angle f in the range from 0 to 2p , negative values need to be augmented by 2p.
The second angle q, measured in the vertical plane, is determined as follows:
q =
-- + - +
-æ
è ç ç ç
ö
ø ÷ ÷ ÷
arc z z
x x y y z z
j i
j i j i j i
cos
( )2 ( )2 ( )2
.(10)
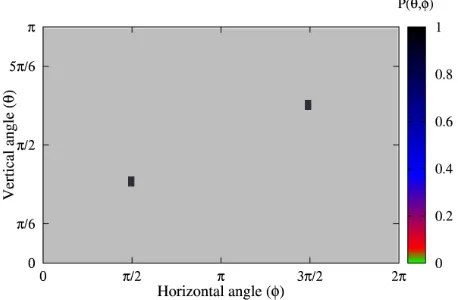
The spherical system of coordinates was adopted be-cause only two angular coordinates f and q are required to define the point located on the surface of the sphere instead of three numbers necessary in the Cartesian system. In the case of the monosized assembly of spherical particles considered, the contact points of individual particles may be projected on one hypothetical sphere as shown in Fig. 2. To facilitate visual comprehension the surface of the hypo-thetical sphere may be reflected as a (f, q) plane.
The two spheres shown in the Fig. 2 contact each other in one point, which is projected on a single sphere (radius of this sphere is irrelevant). As two spheres take part in the contact, the second point representing the contact point from the second sphere may be obtained in the symmetrical transfor-mation against the centre of the sphere. The location of the
contact point on the surface of the sphere may be illustrated through its location in a cell of the network drawn on the plane (f, q). The density of the contact points or the value of for-ce normal to the contact area may be represented by the third coordinate of the graph. The density of the contact points P(f, q) was defined as a set of ratios: number of contacts in the considered cell (f p- /180, f+p/180) × ( q- p/180,
q p+ /180) of the network to the total number of contacts (Fig. 3). Normalized values of the contact forces between particles in the container were shown at the plane (f, q).
RESULTS AND DISCUSSION
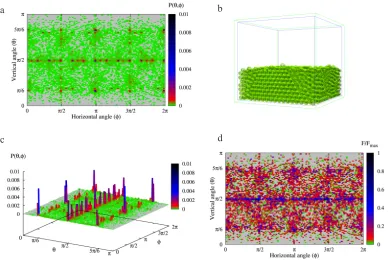
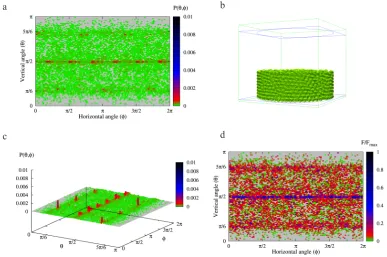
Distributions of the contact points obtained for the two shapes of the container and for the three filling methods are presented in Figs 4 to 8 – each figure contains four illu-strations: the top left is a 2D distribution map of the contact points measured as the ratio P of the number of contact points found in the f, q location to the total number of con-tact points; the bottom left shows the same data but visua-lized in 3D as columns in given locations with heights and colours corresponding to each other; the top right represents the 3D view of the deposit; the bottom right shows a 2D pro-jection of the distribution of normalized contact forces cal-culated based on the Hertz theory.
All distributions shown in Figs 4 to 8 present at the (f, q) plane a characteristic concentration of the contact points along the equator of the hypothetical sphere (q=p/ 2). This signifies that a large portion of contacts take place at the equators of the particles parallel to the base of the container (ie the lines joining particles centroids are parallel to the ba-se of the container), which is a result of the ordering in-fluence of the flat bottom of the container. The other areas of concentrations of contact points may be seen around the angle qof approximately p/6 to 7p/36 and symmetrical con-centration (at qbetween 29p/36 and 5p/6). These intervals correspond to the contact angles between particles when one particle is supported by three or four particles resting below in mutual contact on the flat surface – the arrangement typical Fig. 2. Projection of the contact point on a hypothetical sphere.
Fig. 4. Characteristics of the structure of the assembly of spherical particles formed in cuboidal container by centric filling: a – planar projection of the distribution of the contact points, b – a 3D view of the assembly, c – distribution of the contact points – a 3D view, d – distribution of normalized values of the contact forces.
Fig. 5. Characteristics of the structure of the assembly of spherical particles formed in the in-volume filled cuboidal container: a – planar projection of the distribution of the contact points, b – a 3D view of the assembly, c – distribution of the contact points – a 3D view, d – distribution of normalized values of the contact forces.
a b
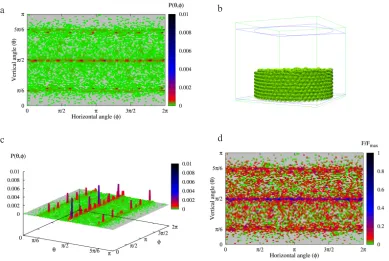
Fig. 6. Characteristics of the structure of the assembly of spherical particles formed in the cylindrical container by centric filling: a – planar projection of the distribution of the contact points, b – a 3D view of the assembly, c – distribution of the contact points – a 3D view, d – distribution of normalized values of the contact forces.
Fig. 7. Characteristics of the structure of the assembly of spherical particles formed cylindrical container by in-volume filling: a – planar projection of the distribution of the contact points, b – a 3D view of the assembly, c – distribution of the contact points – a 3D view, d – distribution of normalized values of the contact forces.
a b
c d
a b
of a crystal lattice. The effects are clearly visible in Fig. 4, which presents the distribution of contact points in the case of the centrally filled cuboidal container. Here, the areas of dense concentrations of contacts are very regular both in di-rections of equal height (q) as well as, which is even more pronounced, along the perpendicular direction (f) where densifications of the contact points appear at constant dis-tances (every p/12) (Fig. 4a). Another strong densification might be seen in close vicinity of four points: (p/6,p/2); (5p/6, 3p/2) and symmetrical concentration (p/6, 3p/2); (5p/6,p/2). A similar pattern might be observed in the con-tact force distribution (Fig. 4d). The highest values of the contact forces correspond very well with the concentrations of contact normals (at the equator, with a constant repetitive angle of approximately p/12). Another characteristic effect which might be observed are the four circles having a radius of p/3 with centres at the equator and horizontal angles (f) equal to p/2, p, 3p/2 and 2p. This pattern may be obtained when the sphere is supported by two others remaining in contact and rotates clockwise or anticlockwise without chang-ing its distance to both particles. The centres of such circles tend to align with lines parallel to vertical walls. Such an ordered configuration may be generated by centric filling where particles fall dawn one by one and could attain the positions of minimum energy without being disturbed by impacts with other particles falling simultaneously.
The configuration of the assembly generated in the same container using the in-volume filling method (Fig. 5) do not show such a high degree of ordering. The difference between these two cases is particularly pronounced on the bar plots for the two assemblies (Figs 4c and 5c). The con-centrations of the contact points at the equator are still visible, but more dispersed than the regular pattern pre-sented in Fig. 4. Contrary to the assembly generated by cen-tric filling, no circles are visible in the case of deposit ge-nerated by in-volume filling. On the other hand, straight vertical lines at (f=p/ 2 and f=3p/ ) became visible.2 Densifications of distributions of the contact normals are accompanied by increased values of the contact forces. Centric filling resulted in a higher number of particles con-tacting along coplanar diameters creating the regular crystal structure (disturbed by the wall size equal 18.25 particle diameters), while in the case of in-volume filling a stronger influence of the walls was observed (vertical lines at approx. f=p/ 2 , p, 3p/ , 22 p while in the case of centric filling only at approx. f=p, p2 ).
equator. Now only two circles are visible (basic and result-ing from the symmetry). The centres of these circles repre-senting orientation of the structure of the assembly are not uniquely tied with the horizontal coordinates. This effect reflects the fact that during filling, when the first layer on the plane surface of the floor is formed, particles orient them-selves along an arbitrary horizontal direction determining further development of the structure. Unlike in the case of the cuboidal container, here the concentrations of contact forces do not perfectly follow the concentrations of the contact normals. Apart from the fairly regular pattern at the equator and the circles, the remaining distribution seems more dispersed.
The bedding in the in-volume filled cylindrical con-tainer (Fig. 7) shows the concentration of the contact nor-mals at the equator as the result of the influence of the flat bottom. Weaker and more blurred lines of the concentra-tions of the contact points at qof approximately p/6 and 5p/6 and an additional line at qof approximately 7p/36 with more aggregated densification of the contact points are observed. No characteristic circles are formed. The distribution of con- tact forces present a chaotic pattern, apart from the increase in the values at the equator and their concentrations (with no increase in the values) around the lines corresponding to crystal lattice (Fig. 7c).
Dispersed filling of the cylindrical container (Fig. 8) resulted in the most irregular spatial structure. In this case, the contact normals concentrated at the equator as a result of the influence of the flat floor although it is presented by the weakest and the most blurred line (Fig. 8a). The other areas of weak concentration may be observed around lines qof approximately p/6 and 5p/6. No circles characteristic for centric filling are present. Apart from some increase in va-lues at the equator, the distribution of contact forces presents a rather chaotic pattern (Fig. 8d).
CONCLUSIONS
1. Based on results of numerical tests the proposed me-thod may be regarded promising proposition in search for efficient way of visualization of the network of contact for-ces in a 3D assembly of spherical particles. In the cases of in- fluences of the filling method and the container shape on the spa- tial structure of the assembly the method proved to be useful tool.
2. The flat bottom of the container introduced order (crystal-like structure) to the assembly, which resulted in the concentration of the contact points at the equator (q=p/ 2) and created additional lines of concentration at q in a range from p/6 to 7p/36 and symmetrical concentration (q in the range from 29p/36 to 5p/6). The walls of the containers also introduced ordering and generated a regular pattern of con-tacts that were dependent on the wall shape.
3. The filling method had a strong influence on the re-sulting contact network. Centric filling of both containers gene-rated material of a high degree of ordering, while in-volume filling resulted in a more chaotic structure. The structure clo-
sest to the random packing was obtained by dispersed filling of the cylindrical container. The values of contact forces in the cuboidal container were found higher in the regions of the increased density of the contact points, while no such effect was observed in the container with cylindrical walls.
4. The discrete element method was found to simulate properly the effects occurring during filling of the container with spherical particles using three methods known from physical testing. The effect of cone of repose forming at the free surface of the bedding during filling was fairly well reproduced in simulations as well.
REFERENCES
Cundall P.A. and Strack O.D., 1979. A discrete numerical model for granular assemblies. Geotechnique, 29(1), 47-65. Drescher A. and de Josselin de Jong G., 1972. Photoelastic
verification of a mechanical model for the flow of a granular material. J. Mech. Phys. Solids, 20(4), 337-351.
Fisher N.I., Lewis T., and Embleton B.J.J., 1987. Statistical Analysis of Spherical Data. Cambridge Univ. Press, UK. Horabik J., Molenda M., Thompson S.A., and Ross I.J., 1993.
Asymmetry of bin loads introduced by eccentric discharge. Trans. ASAE, 36(2), 577-582.
Koby³ka R. and Molenda M., 2013. DEM modelling of silo loads asymmetry due to eccentric filling and discharge. Powder Technol., 233, 65-71.
Kuwabara L. and Kono K., 1987. Restitution coefficient in a col-lision between two spheres. Jpn. J. Appl. Phys., 26, 1230-1233.
Molenda M. and Stasiak M., 2002. Determination of the elastic constants of cereal grains in a uniaxial compression test. Int. Agrophysics, 16, 61-65.
Moysey E.B., 1979. Active and passive pressures in deep grain bins. Trans. ASAE, 22(6), 1409-1413.
Mueller G.E., 1993. Angular void fraction distributions in ran-domly packed fixed beds of uniformly sized spheres in cylindrical containers. Powder Technol., 77, 313-319. Nouguier-Lehon C., Cambou B., and Vincens E., 2003.
Aniso-tropy induced by particle shape in granular materials (Ed. K. Bagi) Proc. QuaDPM'03 Workshop, Publishing Company of BUTE, August 26-28, Budapest, Hungary.
Rothenburg L. and Bathurst R.J., 1989. Analytical sudy of induced anisotropy in dealised granular materials, Geotechnique, 39, 4, 601-614.
Schwarzer S., 2004. PAPA - Parallel algorithm for PArticle flow problems. University of Stuttgart, Germany.
Sitharam T. and Shimizu N., 2000. Micromechanical behaviour of granular materials under monotonic lodaing: Numerical simulation using discrete element method. Int. Symp. Eng. Mechanics Conf., EM2000, May 21-24, Austin, TX, USA. Sykut J., Molenda M., and Horabik J., 2008. Influence of filling method on packing structure in model silo and DEM simulations. Granular Matter, 10, 273-278.
Wi¹cek J. and Molenda M., 2011. Moisture-dependent physical properties of rapeseed – experimental and DEM modeling. Int. Agrophys., 25, 59-65.