R E S E A R C H A R T I C L E
Open Access
Microarray analysis of peripheral blood
lymphocytes from ALS patients and the SAFE
detection of the KEGG ALS pathway
Jean-Luc C Mougeot
1,2,3*, Zhen Li
4, Andrea E Price
1,2,3, Fred A Wright
4and Benjamin R Brooks
1,2,3Abstract
Background:Sporadic amyotrophic lateral sclerosis (sALS) is a motor neuron disease with poorly understood etiology. Results of gene expression profiling studies of whole blood from ALS patients have not been validated and are difficult to relate to ALS pathogenesis because gene expression profiles depend on the relative abundance of the different cell types present in whole blood. We conducted microarray analyses using Agilent Human Whole Genome 4 × 44k Arrays on a more homogeneous cell population, namely purified peripheral blood lymphocytes (PBLs), from ALS patients and healthy controls to identify molecular signatures possibly relevant to ALS
pathogenesis.
Methods:Differentially expressed genes were determined by LIMMA (Linear Models for MicroArray) and SAM (Significance Analysis of Microarrays) analyses. The SAFE (Significance Analysis of Function and Expression)
procedure was used to identify molecular pathway perturbations. Proteasome inhibition assays were conducted on cultured peripheral blood mononuclear cells (PBMCs) from ALS patients to confirm alteration of the Ubiquitin/ Proteasome System (UPS).
Results:For the first time, using SAFE in a global gene ontology analysis (gene set size 5-100), we show significant perturbation of the KEGG (Kyoto Encyclopedia of Genes and Genomes) ALS pathway of motor neuron
degeneration in PBLs from ALS patients. This was the only KEGG disease pathway significantly upregulated among 25, and contributing genes, includingSOD1, represented 54% of the encoded proteins or protein complexes of the KEGG ALS pathway. Further SAFE analysis, including gene set sizes >100, showed that only neurodegenerative diseases (4 out of 34 disease pathways) including ALS were significantly upregulated. Changes inUBR2expression correlated inversely with time since onset of disease and directly with ALSFRS-R, implying thatUBR2was increased early in the course of ALS. Cultured PBMCs from ALS patients accumulated more ubiquitinated proteins than PBMCs from healthy controls in a serum-dependent manner confirming changes in this pathway.
Conclusions:Our study indicates that PBLs from sALS patients are strong responders to systemic signals or local signals acquired by cell trafficking, representing changes in gene expression similar to those present in brain and spinal cord of sALS patients. PBLs may provide a useful means to study ALS pathogenesis.
Background
Amyotrophic lateral sclerosis (ALS) is a progressive neu-rodegenerative disease causing muscle weakness and wasting resulting from the loss of motor neurons in brain and spinal cord characterized by ubiquitinated
inclusions in brain and spinal cord of post mortemALS patients [1]. Several genome-wide association studies (GWAS) have shown evidence of genetic heterogeneity underlying disease susceptibility [2]. Single nucleotide polymorphisms were found in theITPR2(inositol 1,4,5-triphosphate receptor, type 2) [3], FGGY(FGGY carbo-hydrate kinase domain containing) [4],DPP6 (dipepti-dyl-peptidase 6) [5], with variable strength of association with ALS and limited replication. None of these genes has been proven relevant to the pathogenesis of ALS. * Correspondence: [email protected]
1Department of Neurology, ALS Biomarker Laboratory - James G Cannon
Research Center, Carolinas Medical Center, 1542 Garden Terrace, Charlotte, NC 28203-6110, USA
Full list of author information is available at the end of the article
More recently, mutations were found in the UNC13A (unc-13 homolog A) gene [6] and in the 9p21 chomoso-mal locus [7]. To overcome challenges in the interpreta-tion of results from GWAS and data from the world of “omics”in general, ALS researchers are actively engaged in integrative global bioinfomatics and the creation of ALS models for development of new ALS therapies (Euro-MOTOR project) [8]. Despite genetic heterogene-ity underlying disease susceptibilheterogene-ity, the clinical manifes-tations of the ALS phenotype are relatively homogeneous; suggesting that at the cellular and mole-cular levels there may be a convergence of a limited number of pathways that could lead to the ALS phenotype.
Gene expression profiling studies using microarrays and/or real time quantitative RT-PCR have been con-ducted on various tissues from rodent models for ALS such as muscle or brain tissues, lumbar spinal anterior horn tissues, spinal cord motor neurons isolated by laser capture microdissection (LCM), whole blood or periph-eral blood mononuclear cells (PBMCs). Similar studies were performed on spinal cord tissues or LCM-isolated motor neurons obtainedpost mortemfrom ALS patients. Roughly, ~1000 unique genes were found differentially expressed but only ~5% differentially expressed in the same direction in more than one study [9], indicating lit-tle reproducibility. Poor reproducibility may be due to the use of different gene expression profiling methods or platforms, tissue of different origin, methods used for biological sample preparation, time of tissue collection at pre-symptomatic or symptomatic stage, and use of a par-ticular batch of rodents or human cohort. Rather, one may find greater commonalities at the pathway alteration level with regard to apoptosis regulation, calcium regula-tion, oxidative stress and mitochondrial funcregula-tion, ER-stress and unfolded protein response (UPR), UPS and autophagy, RNA processing, DNA metabolism, axonal transport, integrity of the neuromuscular junction, mus-cle atrophy, and direct/indirect interactions with astro-cytes, microglia and T-cells. Within these biological processes, genes of importance are those with mutations or polymorphisms shown to confer susceptibility to or cause ALS; or genes playing a critical role in the path-ways that involve susceptibility genes.
A number of studies have sought blood biomarkers that may be useful to detect early signs of ALS, assess disease progression, monitor treatment effects, or track down the cause(s) of the disease, in a minimally-invasive fashion in ALS patients. Using qRT-PCR, Lin et al. (2009) have shown subtle transcriptional down-regula-tion of mitochondrial electron-transfer chain genes in whole blood from ALS patients [10]. Saris et al.(2009) have identified co-expressed gene modules (clusters) in total blood from sporadic ALS (sALS) patients [11].
These findings resulted from subtle differential expres-sion of 2300 probe-encoded genes and were related to biological/disease categories such as post-translational modification, infection mechanism, inflammatory dis-ease, neurological disorder, and skeletal and muscular disorder. Gagliardi et al.(2010) showed increasedSOD1 mRNA expression in spinal cord, brain stem and lym-phocytes of sporadic ALS (sALS) patients [12]. Zhanget al. (2011) identified gene expression profiles of short-term cultured PBMCs from ALS patients, demonstrating the activation of monocytes/macrophagesvia the LPS/ TLR4 neuroinflammatory pathway [13]. Lincecumet al. (2010) demonstrated the activation in ALS pathogenesis of a co-stimulatory pathway bridging the activation of T-cell responses and the amplification of the innate immune response, based on gene expression profiles obtained from whole blood of the G93A SOD1 mouse model and ALS patients [14]. Circulating white blood cells might acquire certain properties from long distance signals mediated by small metabolites or macromole-cules circulating in peripheral blood. They might also acquire novel properties from trafficking at sites of neu-rodegeneration associated with rupture of the blood brain barrier or blood-spinal cord barrier in early and late ALS to a variable degree. Further investigation in this area of ALS research is critically needed [15].
In the current work, we analyzed RNA extracted from PBLs of ALS patients and control subjects, thereby reducing some of the complexity of mixed expression patterns generated by RNA from reticulocytes, granulo-cytes, monogranulo-cytes, thrombocytes and plasma, normally present in whole blood. Indeed, gene expression profiles of blood-derived samples are strongly dependent on the predominant constituent cell type(s) [16,17]. Analyses of mRNA expression data by LIMMA [18], SAM [19] and SAFE [20], revealed alterations of the ubiquitin/protea-some system (UPS). Using proteaubiquitin/protea-some inhibition assays, parallel changes of UPS activity at the protein level were determined in subcultured PBMCs (mainly composed of lymphocytes) from ALS patients, by Western blot analysis.
Methods
Isolation of peripheral blood lymphocytes from ALS patients and controls
were drawn from sporadic definite ALS patients and healthy control (HC) subjects by venipuncture into tubes adequate for either serum or lymphocyte isolation. The healthy controls (HCs) consisted of 9 white females (mean age 51.4 ± 11 (standard deviation) years) and 2 white males (64, 65). The sALS patients consisted of one black male (49), one black female (69), 5 white females (mean age 59 ± 20 years), and 4 white males (mean age 47 ± 9 years). Table 1 presents the clinical characteristics of the enrolled patients and healthy controls subjected to microarray analysis. PBMCs were isolated using Histopa-que™-1077 density gradient centrifugation method. Using this procedure, yields were generally 1-2 × 10⁶ PBMCs per mL of blood. Lymphocytes were further enriched to over 90% purity from the PBMC fraction by subsequent PERCOLL gradient centrifugation [22]. Blood samples were processed immediately upon reception in the lab within 30 minutes after blood draw.
RNA extraction, amplification, and dual mode reference design microarrays
The common reference design [23] was used for sample assignment in the dual color mode of expression assay on the Agilent Human Whole Genome 4 × 44k Microarrays to analyze ~40000 transcripts. Microarray experiments were performed, in which each of the 22 RNA samples (HC and sALS) was co-hybridized with RNA from the HC reference pool that was constituted with equal amounts of each of the 11 RNA samples from healthy
controls. Total RNA stored in TRIzol (Invitrogen) at -80° C, was extracted from the lymphocyte samples at Cogenics, Inc. (Morrisville, NC) by standard procedures. The quantity of each of the total RNA samples and deter-mination of the A260/280 nmratio was determined by spec-trophotometry and the size distribution was assessed using an Agilent Bioanalyzer. Fifty nanograms of total RNA was converted into labelled cRNA with nucleotides coupled to a fluorescent dye (either Cy3 or Cy5) using the Quick Amp Kit (Agilent Technologies, Palo Alto, CA) following the manufacturer’s protocol. The A260/280
nmratio and yield of each of the cRNAs were determined and a quality assessment was done using an Agilent Bioa-nalyzer. Equal amounts of Cy3 and Cy5-labeled cRNA (825 ng) from two different samples were hybridized to Agilent Human Whole Genome 4 × 44k Microarrays. The hybridized array was washed and scanned and data were extracted from the scanned image using Feature Extraction version 10.2 (Agilent Technologies). The non-normalized and non-normalized microarray datasets have been deposited in the NCBI Gene Expression Omnibus [24] as series GSE28253.
Statistical analyses and SAFE data mining
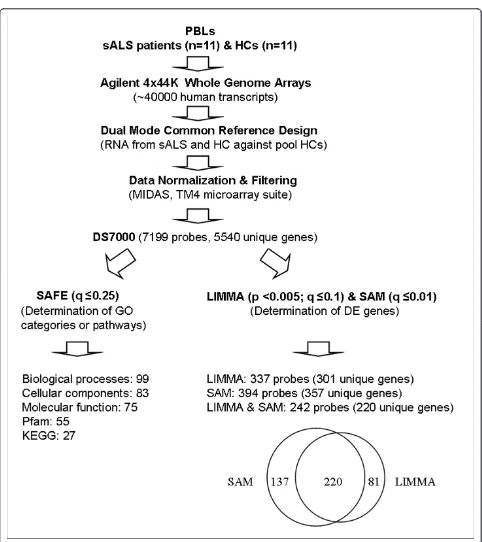
Raw data .txt files in Agilent format were converted to . MEV files using ExpressConverter™ v2.1 of the TM4 Microarray Suite (TIGR Genomics, Rockville, CA). Back-ground-subtracted raw data were normalized using the MIDAS pipeline (TM4, TIGR Genomics, Rockville, MD) according to Siosonet al.(2006) with the following steps: total intensity normalization, LocFit (LOWESS), standard deviation regularization and low intensity trim [25]. Filter-ing strFilter-ingencies requirFilter-ing that the integrated signal inten-sities (ISI) for each Cy3 and Cy5 channels were more than two standard deviation(s) of the Cy3 and Cy5 background (ISI = 7000), generated the dataset DS7000 [7199 probes, 5540 unique genes]. DS7000 was subjected to LIMMA [18] and SAM [19] analyses using TMeV v4.5.1 program (TM4, TIGR Genomics, Rockville, MD) to determine dif-ferentially expressed genes. The false discovery rate (FDR) was 1.17% (delta = 0.90) for DS7000. SAFE analysis was performed with Bioconductor 2.5 according to Barry, Nobel, and Wright (2005) [20] to identify gene sets demonstrating different expression levels between classes of comparison. Default settings for local (t-test) and global (Wilcoxon) statistics were used. Comparisons were based on gene ontology databases for biological processes, mole-cular functions, cellular components, and the protein families (Pfam) and KEGG databases.
Total ubiquitination and proteasome inhibition assays with PBMCs from ALS patients and healthy controls
Freshly isolated PBMCs (composed of ~80% lympho-cytes and ~20% of monolympho-cytes per flow cytometry
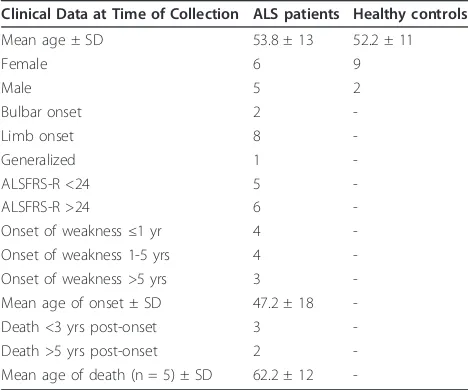
Table 1 Demographic and clinical data for ALS patients (n = 11) and healthy controls (n = 11) enrolled for Agilent Human Whole Genome 4 × 44k Array analysis
Clinical Data at Time of Collection ALS patients Healthy controls
Mean age ± SD 53.8 ± 13 52.2 ± 11
Female 6 9
Male 5 2
Bulbar onset 2
-Limb onset 8
-Generalized 1
-ALSFRS-R <24 5
-ALSFRS-R >24 6
-Onset of weakness≤1 yr 4
-Onset of weakness 1-5 yrs 4
-Onset of weakness >5 yrs 3
-Mean age of onset ± SD 47.2 ± 18
-Death <3 yrs post-onset 3
-Death >5 yrs post-onset 2
-Mean age of death (n = 5) ± SD 62.2 ± 12
analysis) from ALS patients and healthy controls, were subcultured overnight (O.N.) for 18 hr at 37°C in RPMI (Invitrogen) supplemented with 10% FCS (Invitrogen) and supplemented or not with added-back matched autologous serum that had been prepared in parallel. These PBMCs were treated, or not treated, for 1.5 hrs at 37°C with the reversible proteasome inhibitor MG132 (Sigma). For each patient or healthy control, serum was prepared separately from PBMCs from the same blood draw. Matched serum was supplemented at a concentra-tion of 20% to the O.N. cultures. A total of 750000 cells were seeded per well of a 48-well plate. Cells were trea-ted with 10μM proteasome inhibitor MG132 or DMSO vehicle at 0.09% for 1.5 hrs. Cells were collected and snap frozen until Western blot analysis. Cells were lysed into RIPA buffer (150 mM NaCl, 1.0% IGEPAL® CA-630, 0.5% sodium deoxycholate, 0.1% SDS, 50 mM Tris, pH 8.0) including protease inhibitor cocktails [complete Mini EDTA-free protease inhibitor cocktail tablets (Roche) and Protease Inhibitor cocktail P8340 (Sigma)]. Total protein was quantified using BioRad Dc protein assay. An aliquot (20 μg total protein) was supplemen-ted with 2x Laemmli’s sample buffer and boiled for 5 minutes prior to separation by sodium dodecyl sulfate (SDS)-12.5% polyacrylamide gel electrophoresis for 130 min at 100V. Proteins were transferred to polyvinylidene difluoride membranes (Millipore) and quenched with blocking buffer containing 10% non-fat milk in PBS-0.1 Tween 20 for 1 hr at room temperature. The mem-branes were incubated overnight at 4°C with primary monoclonal anti-ubiquitin sc-8017 antibody (1/1000 dilution; Santa Cruz) diluted in the blocking buffer. Membranes were subsequently incubated with goat mouse human absorbed HRP-secondary sc-2055 anti-body (1/10000 dilution; Santa Cruz) for 30 minutes and assayed using the Super Signal Pico chemiluminescence detection system (Thermo Fisher Scientific). Subsequent reprobing with anti-beta-actin antibody sc-81178 (Santa Cruz) was performed by stripping membranes of bound antibodies in stripping buffer (62.5 mM Tris HCL, 2% SDS, and 100 mM 2-mercaptoethanol [pH 6.7]) at 56°C for 20 minutes. ECL films and a LAS3000 imaging sys-tem (Fuji) were used for detection of the chemilumines-cence. Silver staining was used to confirm loading homogeneity in the PAGEs post-electrotransfer using SilverSNAP stain (Thermo Fisher Scientific), in addition to reprobing of the membranes for beta-actin.
Semi-quantitative analysis of the Western blot data
Raw images were processed in ImageJ program (Dr. Wayne Rasband, [email protected], National Insti-tute of Mental Health, Bethesda, Maryland, USA). The accumulated HMW ubiquitinated protein forms were delineated by a rectangular area, for which the
background subtracted integrated density could be mea-sured. The integrated density could then be measured for same area below the accumulated forms at a level of the blotting membrane demonstrating consistency of staining throughout the lanes, thereby providing a con-trast reference area per lane. Calculation of a signal-to-noise (S/N) ratio for the accumulated forms was then determined independently from the detection of beta-actin that was achieved by stripping and reprobing the Western blot membranes.
Results
We studied gene expression profiles of lymphocytes iso-lated from 11 patients diagnosed with definite sporadic ALS (sALS) and 11 healthy control subjects. Clinical characteristics for this cohort are described in Table 1. Figure 1 summarizes results from microarray data nor-malization and LIMMA, SAM and SAFE analyses.
LIMMA and SAM analyses
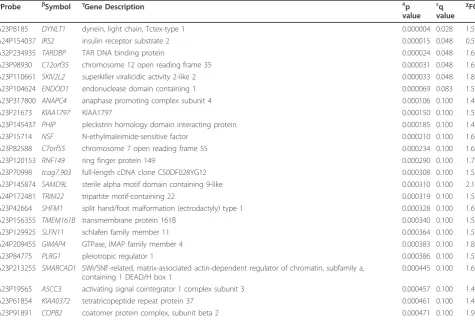
Differentially expressed genes between ALS patients and healthy controls were determined using LIMMA (pLIMMA< 0.001, qLIMMA ≤10%) and SAM (qSAM≤1%) in TM4/TMeV v4.5.1 program [25] for the dataset DS7000 (Figure 1). A significant overlap was found by comparing LIMMA and SAM results (Figure 1, Addi-tional File 1). Table 2 presents the 24 most differentially expressed genes (qSAM = 0%, pLIMMA< 0.0005, qLIMMA
= 0%, p < 0.005, Additional File 1). In addition, we iden-tified upregulation (FC = 1.4, qSAM~0.5%, pLIMMA < 0.005, qLIMMA~10%) ofRTN4IP1 (reticulon 4 interacting proteinaliasNOGO-interacting mitochondrial protein), a mitochondrial protein that interacts with reticulon 4, a potent inhibitor of regeneration following spinal cord injury [34]. We also identified upregulation of SOD1 (FC = 1.3, q~1%, pLIMMA<0.05, qLIMMA~10%), confirm-ing the work by Gagliardiet al.(2010) [12].
SAFE identification of molecular signatures in lymphocytes from ALS patients
SAFE [20] is a resampling-based procedure that is simi-lar to GSEA (Gene Set Enrichment Analysis) [35], but with more flexible choices of test statistics. SAFE was used to obtain information on unifying biological themes from databases specific for (i) gene ontology (GO) pathways/categories (biological process, cellular component and molecular function), (ii) pathways/cate-gories defined by the KEGG (Kyoto Encyclopedia of Genes and Genomes) and (iii) Pfam (protein families).
Such resampling procedures have been shown to pro-vide more accurate control of false positives than sim-pler enrichment-test methods using only lists of p-values [36].
Following determination of local (t-test) and global (Wilcoxon test) statistics using SAFE default settings, the significance for each gene set category was deter-mined by bootstrap re-sampling and multiple test cor-rection (for the multiple categories examined) by an FDR procedure with qSAFE< 25% considered significant (similarly to GSEA). This relatively liberal threshold was intended to avoid false negatives, although many of the findings presented here achieve more striking signifi-cance. For SAFE gene ontology category analysis, gene sets of 5-100 genes were examined, similar to restric-tions used by others(e.g., Barry et al., 2005) [20]. This approach ensures that gene sets were not so small as to call into question a“pathway”interpretation, and not so large as to defy biological interpretation. In addition, the approach helps to manage the multiple testing penalties across numerous categories. To simplify overall
Table 2 Differentially expressed genes in peripheral blood lymphocytes from ALS patients by SAM (q = 0) ranked by independent LIMMA (p < 0.0005)
aProbe bSymbol gGene Description δp
value
εq
value cFC
A23P8185 DYNLT1 dynein, light chain, Tctex-type 1 0.000004 0.028 1.5
A24P154037 IRS2 insulin receptor substrate 2 0.000015 0.048 0.5
A32P234935 TARDBP TAR DNA binding protein 0.000024 0.048 1.6
A23P98930 C12orf35 chromosome 12 open reading frame 35 0.000031 0.048 1.6
A23P110661 SKIV2L2 superkiller viralicidic activity 2-like 2 0.000033 0.048 1.8
A23P104624 ENDOD1 endonuclease domain containing 1 0.000069 0.083 1.5
A23P317800 ANAPC4 anaphase promoting complex subunit 4 0.000106 0.100 1.4
A23P21673 KIAA1797 KIAA1797 0.000150 0.100 1.5
A23P145437 PHIP pleckstrin homology domain interacting protein 0.000185 0.100 1.4
A23P15714 NSF N-ethylmaleimide-sensitive factor 0.000210 0.100 1.6
A23P82588 C7orf55 chromosome 7 open reading frame 55 0.000234 0.100 1.6
A23P120153 RNF149 ring finger protein 149 0.000290 0.100 1.7
A23P70998 tcag7.903 full-length cDNA clone CS0DF028YG12 0.000308 0.100 1.5
A23P145874 SAMD9L sterile alpha motif domain containing 9-like 0.000310 0.100 2.1
A24P172481 TRIM22 tripartite motif-containing 22 0.000319 0.100 1.5
A23P42664 SHFM1 split hand/foot malformation (ectrodactyly) type 1 0.000328 0.100 1.6
A23P156355 TMEM161B transmembrane protein 161B 0.000340 0.100 1.5
A23P129925 SLFN11 schlafen family member 11 0.000364 0.100 1.5
A24P209455 GIMAP4 GTPase, IMAP family member 4 0.000383 0.100 1.8
A23P84775 PLRG1 pleiotropic regulator 1 0.000386 0.100 1.5
A23P213255 SMARCAD1 SWI/SNF-related, matrix-associated actin-dependent regulator of chromatin, subfamily a, containing 1 DEAD/H box 1
0.000445 0.100 1.6
A23P19565 ASCC3 activating signal cointegrator 1 complex subunit 3 0.000457 0.100 1.4
A23P61854 KIAA0372 tetratricopeptide repeat protein 37 0.000461 0.100 1.4
A23P91891 COPB2 coatomer protein complex, subunit beta 2 0.000471 0.100 1.9
interpretation, we only reported“upregulated”categories to highlight pathway activations caused by the disease rather than pathway inhibitions.
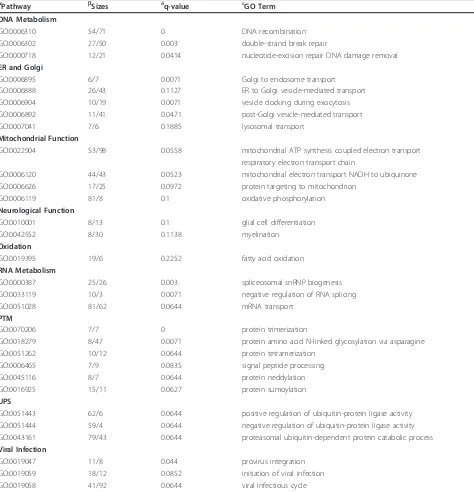
Significant upregulated categories representing gene sets associated with“biological processes”,“cellular com-ponents”, and“KEGG pathways” are shown in Tables 3,
4 and 5. We used same gene set size restriction (5-100 genes) for SAFE analysis of KEGG gene ontology groups including the KEGG Human Disease pathways, of which 25 were annotated in Bioconductor 2.5 for the Agilent platform. We identified that the KEGG ALS pathway was significant (qSAFE= 18%). The KEGG ALS pathway
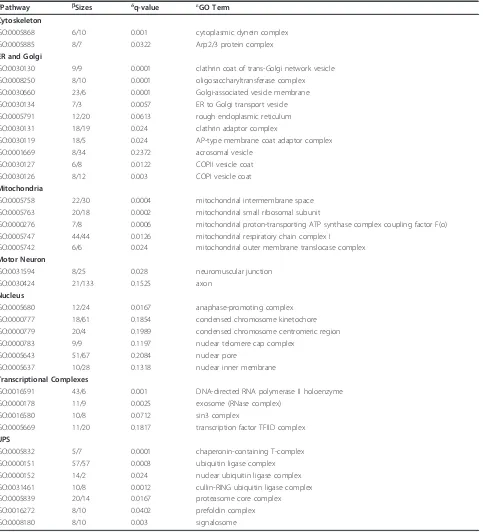
Table 3 SAFE gene ontology pathways related to Biological Processes affected in peripheral blood lymphocytes from ALS patients
aPathway bSizes δq-value εGO Term
DNA Metabolism
GO:0006310 54/71 0 DNA recombination
GO:0006302 27/50 0.003 double-strand break repair
GO:0000718 12/21 0.0414 nucleotide-excision repair DNA damage removal
ER and Golgi
GO:0006895 6/7 0.0071 Golgi to endosome transport
GO:0006888 26/43 0.1127 ER to Golgi vesicle-mediated transport
GO:0006904 10/19 0.0071 vesicle docking during exocytosis
GO:0006892 11/41 0.0471 post-Golgi vesicle-mediated transport
GO:0007041 7/6 0.1885 lysosomal transport
Mitochondrial Function
GO:0022904 53/98 0.0558 mitochondrial ATP synthesis coupled electron transport respiratory electron transport chain
GO:0006120 44/43 0.0523 mitochondrial electron transport NADH to ubiquinone
GO:0006626 17/25 0.0972 protein targeting to mitochondrion
GO:0006119 81/8 0.1 oxidative phosphorylation
Neurological Function
GO:0010001 8/13 0.1 glial cell differentiation
GO:0042552 8/30 0.1138 myelination
Oxidation
GO:0019395 19/6 0.2252 fatty acid oxidation
RNA Metabolism
GO:0000387 25/26 0.003 spliceosomal snRNP biogenesis
GO:0033119 10/3 0.0071 negative regulation of RNA splicing
GO:0051028 81/62 0.0644 mRNA transport
PTM
GO:0070206 7/7 0 protein trimerization
GO:0018279 8/47 0.0071 protein amino acid N-linked glycosylation via asparagine
GO:0051262 10/12 0.0644 protein tetramerization
GO:0006465 7/9 0.0835 signal peptide processing
GO:0045116 8/7 0.0644 protein neddylation
GO:0016925 15/11 0.0627 protein sumoylation
UPS
GO:0051443 62/6 0.0644 positive regulation of ubiquitin-protein ligase activity GO:0051444 59/4 0.0644 negative regulation of ubiquitin-protein ligase activity GO:0043161 79/43 0.0644 proteasomal ubiquitin-dependent protein catabolic process Viral Infection
GO:0019047 11/8 0.044 provirus integration
GO:0019059 18/12 0.0852 initiation of viral infection
GO:0019058 41/92 0.0644 viral infectious cycle
a
Table 4 SAFE gene ontology pathways related to Cellular Components affected in peripheral blood lymphocytes from ALS patients
aPathway bSizes δq-value εGO Term
Cytoskeleton
GO:0005868 6/10 0.001 cytoplasmic dynein complex
GO:0005885 8/7 0.0322 Arp2/3 protein complex
ER and Golgi
GO:0030130 9/9 0.0001 clathrin coat of trans-Golgi network vesicle GO:0008250 8/10 0.0001 oligosaccharyltransferase complex GO:0030660 23/6 0.0001 Golgi-associated vesicle membrane
GO:0030134 7/3 0.0057 ER to Golgi transport vesicle
GO:0005791 12/20 0.0613 rough endoplasmic reticulum
GO:0030131 18/19 0.024 clathrin adaptor complex
GO:0030119 18/5 0.024 AP-type membrane coat adaptor complex
GO:0001669 8/34 0.2372 acrosomal vesicle
GO:0030127 6/8 0.0122 COPII vesicle coat
GO:0030126 8/12 0.003 COPI vesicle coat
Mitochondria
GO:0005758 22/30 0.0004 mitochondrial intermembrane space GO:0005763 20/18 0.0002 mitochondrial small ribosomal subunit
GO:0000276 7/8 0.0006 mitochondrial proton-transporting ATP synthase complex coupling factor F(o) GO:0005747 44/44 0.0126 mitochondrial respiratory chain complex I
GO:0005742 6/6 0.024 mitochondrial outer membrane translocase complex Motor Neuron
GO:0031594 8/25 0.028 neuromuscular junction
GO:0030424 21/133 0.1525 axon
Nucleus
GO:0005680 12/24 0.0167 anaphase-promoting complex
GO:0000777 18/61 0.1854 condensed chromosome kinetochore
GO:0000779 20/4 0.1989 condensed chromosome centromeric region
GO:0000783 9/9 0.1197 nuclear telomere cap complex
GO:0005643 51/67 0.2084 nuclear pore
GO:0005637 10/28 0.1318 nuclear inner membrane
Transcriptional Complexes
GO:0016591 43/6 0.001 DNA-directed RNA polymerase II holoenzyme
GO:0000178 11/9 0.0025 exosome (RNase complex)
GO:0016580 10/8 0.0712 sin3 complex
GO:0005669 11/20 0.1817 transcription factor TFIID complex UPS
GO:0005832 5/7 0.0001 chaperonin-containing T-complex
GO:0000151 57/57 0.0003 ubiquitin ligase complex
GO:0000152 14/2 0.024 nuclear ubiquitin ligase complex
GO:0031461 10/8 0.0012 cullin-RING ubiquitin ligase complex
GO:0005839 20/14 0.0167 proteasome core complex
GO:0016272 8/10 0.0402 prefoldin complex
GO:0008180 8/10 0.003 signalosome
a
was the only significantly upregulated disease pathway among the 25 disease pathways (Additional File 2). In addition, we considered all 34 KEGG Human Disease pathways annotated in Bioconductor 2.5 for the Agilent
platform among 55 total represented in the KEGG data-base (http://www.genome.jp/kegg-bin/get_htext? htext=br08901&query=%22Human%20Diseases% 22&option=-s) [37] by including gene set sizes >100 in a secondary analysis.
We found that only neurodegenerative disease path-ways (4 in total) were significantly upregulated (Addi-tional File 2). In this latter analysis, ALS was less significant than the other three neurodegenerative dis-eases (Huntington’s disease, Parkinson’s disease, Alzhei-mer’s disease), suggesting that neurodegeneration affects lymphocytes to a greater extent than ALS-specific biolo-gical processes. Nevertheless, such interpretation has to be taken with caution. Indeed, some genes represented on the pathway maps of these other three neurodegen-erative diseases are related to the UPS, cytoskeleton or dynein-dynactin complex, and therefore should be represented on the KEGG ALS pathway. However, ALS, Alzheimer’s, Huntington’s and Parkinson’s are all neuro-degenerative diseases related to aging and/or associated with mitochondrial dysfunction. For this reason, results are in alignment with the results of Sariset al.(2009) [11]. Prion disease, generally thought to be less related to the other neurodegenerative disorders, was found not significant (Additional File 2).
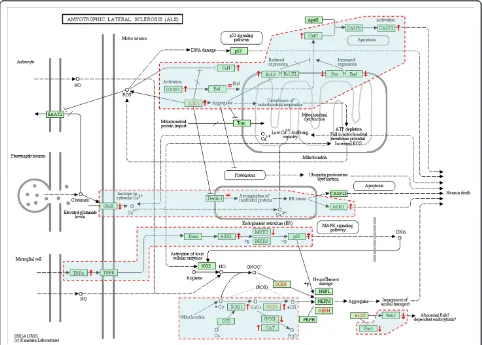
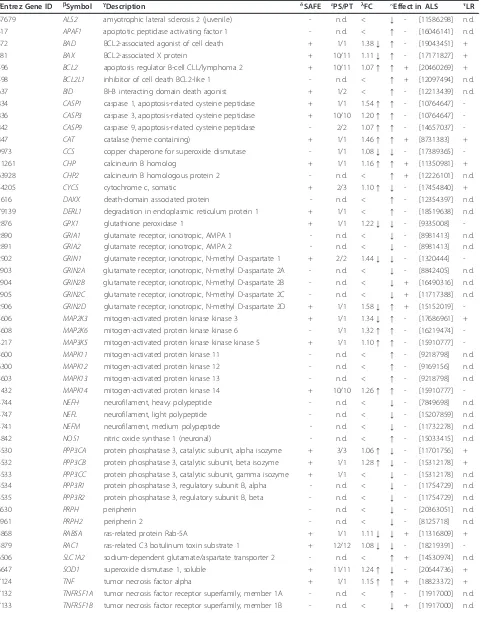
A total of 54 unique gene IDs (including the pseudo-gene caspase 12) constitute the KEGG ALS pathway (hsa05014) [37] and correspond to 36 protein entities defining unique proteins or protein complexes (Figure 2). A total of 35 protein entities corresponding to 53 genes represented on the KEGG ALS pathway map (pseudogene CASP12 excluded) include membrane receptors, cytosolic or secreted proteins, kinases, phos-phatases, proteases, and protein channels, which are likely to play a direct/indirect role in ALS pathogenesis to a variable degree at different stages that lead to motor neuron degeneration. Some protein entities may correspond to different isoforms represented by unique gene IDs. For example, calcineurin (CaN entity) may be composed by three catalytic isoforms (a,b,g) encoded by three different chromosomes and many types of gluta-mate receptors may represent the GluR entity (Figure 2). There were 23 unique genes (43%, 81 probes), the aggregate expression pattern of which contributes to the perturbation of the KEGG ALS pathway (Table 6). The number of protein entities defined by these genes and represented on the KEGG ALS pathway map was 19 out of 35 (54%) (Table 6, Figure 2). The dynamics of up-and down-regulations, assuming they are functionally effective, may be interpreted as responses to signals ori-ginating from serum or cell-cell interactions. For exam-ple upregulation of ASK1 (alias MAP3K5) may be associated with an ER-stress response that correlates with ALS progression (Figure 2). Also, assuming that
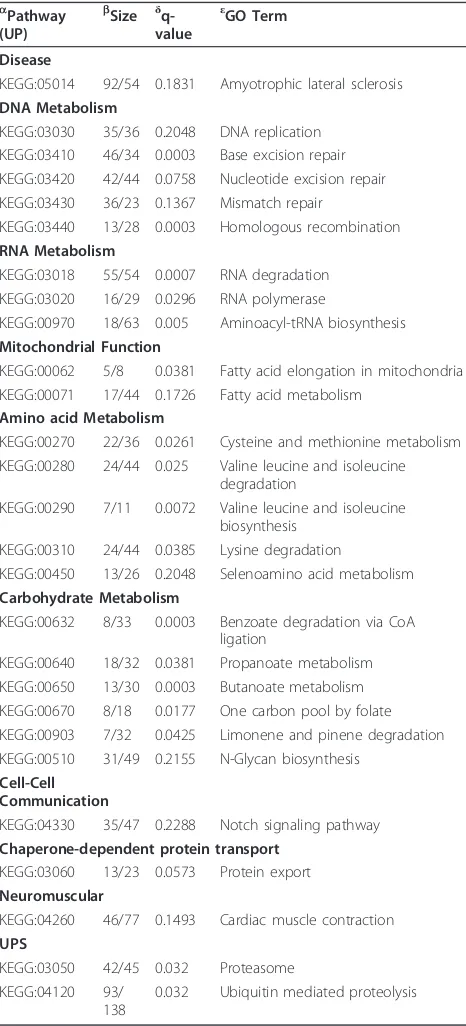
Table 5 SAFE analysis of the KEGG pathway database a
Pathway (UP)
b Size δ
q-value
εGO Term
Disease
KEGG:05014 92/54 0.1831 Amyotrophic lateral sclerosis DNA Metabolism
KEGG:03030 35/36 0.2048 DNA replication KEGG:03410 46/34 0.0003 Base excision repair KEGG:03420 42/44 0.0758 Nucleotide excision repair KEGG:03430 36/23 0.1367 Mismatch repair
KEGG:03440 13/28 0.0003 Homologous recombination RNA Metabolism
KEGG:03018 55/54 0.0007 RNA degradation KEGG:03020 16/29 0.0296 RNA polymerase
KEGG:00970 18/63 0.005 Aminoacyl-tRNA biosynthesis Mitochondrial Function
KEGG:00062 5/8 0.0381 Fatty acid elongation in mitochondria KEGG:00071 17/44 0.1726 Fatty acid metabolism
Amino acid Metabolism
KEGG:00270 22/36 0.0261 Cysteine and methionine metabolism KEGG:00280 24/44 0.025 Valine leucine and isoleucine
degradation
KEGG:00290 7/11 0.0072 Valine leucine and isoleucine biosynthesis
KEGG:00310 24/44 0.0385 Lysine degradation
KEGG:00450 13/26 0.2048 Selenoamino acid metabolism Carbohydrate Metabolism
KEGG:00632 8/33 0.0003 Benzoate degradation via CoA ligation
KEGG:00640 18/32 0.0381 Propanoate metabolism KEGG:00650 13/30 0.0003 Butanoate metabolism KEGG:00670 8/18 0.0177 One carbon pool by folate KEGG:00903 7/32 0.0425 Limonene and pinene degradation KEGG:00510 31/49 0.2155 N-Glycan biosynthesis
Cell-Cell Communication
KEGG:04330 35/47 0.2288 Notch signaling pathway Chaperone-dependent protein transport
KEGG:03060 13/23 0.0573 Protein export Neuromuscular
KEGG:04260 46/77 0.1493 Cardiac muscle contraction UPS
KEGG:03050 42/45 0.032 Proteasome KEGG:04120 93/
138
0.032 Ubiquitin mediated proteolysis
a
transcriptional regulation produces more or less active protein with appropriate subcellular localization and in a timely manner, about half of the genes would have a negative effect on motor neuron survival while the rest would have a positive effect according to current ALS literature. This said contribution of aggregate expression to a pathway does not necessarily signify differential expression of each participant gene in terms of differ-ences between the mean expression levels in lympho-cytes from ALS vs. healthy controls. One limitation is that individual protein entities of the UPS, the dynein-dynactin complex, and TARDBP/TDP43 pathway and other elements of ALS pathogenesis are not represented
on the KEGG ALS pathway, so that other potential aggregate effects relevant of ALS pathogenesis cannot be determined using the current gene set. However, pathway perturbations were determined by SAFE for genes belonging to the UPS both in terms of “biological process” and “cellular components” affected (Tables 3 and 4). Gene ontology categories corresponding to gene sets related to the UPS (AmiGO database) [38] included the following: positive or negative regulation of ubiqui-tin-protein ligase, proteasomal ubiquitin-dependent pro-teins [GO:0051443, 6 propro-teins; GO:0051444, 4 propro-teins; GO:0043161, 43 proteins] (Table 3); chaperonin-con-taining T-complex, ubiquitin ligase complex, nuclear
Figure 2Genes from lymphocytes of ALS patients contributing to the perturbation of the KEGG ALS pathway per SAFE analysis. The KEGG (Kyoto Encyclopedia of Genes and Genomes) ALS pathway map relates to motor neuron degeneration in the context of a
microenvironment represented by glial cells and can be found online at http://www.genome.jp/kegg/pathway/hsa/hsa05014.html. There are 54 unique gene entries (includingCASP12pseudogene) defined by ENTREZ identities. There are 36 protein entities represented on the map that are not all designated by official HUGO gene symbols. Red dashed areas represent subpathway modules affected by differentially expressed genes. Up or down-regulations determined following SAFE for DS7000 are shown by (↑) or (↓), unchanged is shown by (=) (fold changes in expression and HUGO gene symbols are reported in Table 6). HUGO aliases for protein entities represented on the map are as follows:ALS2[ALS2],Apaf1 [APAF1],ASK1[MAP3K5],Bad[BAD],Bax[BAX],Bcl2[BCL2],Bcl-XL[BCL2L1],Bid[BID],CaN[CHP,CHP2,PPP3CA,PPP3CB,PPP3CC,PPP3R1,PPP3R2], CASP1[CASP1],CASP3[CASP3],CASP9[CASP9],CASP12[CASP12],CAT[CAT],CCS[CCS],CytC[CYCS],Daxx[DAXX],Derlin-1[DERL1],EAAT2 [SLC1A2],GPX1[GPX1],GluR[GRIA1,GRIA2,GRIN1,GRIN2A,GRIN2B,GRIN2C,GRIN2D],MKK3[MAP2K3],MKK6[MAP2K6],p38[MAPK11,MAPK12,
Table 6 Genes differentially expressed in lymphocytes from ALS patients compared to healthy controls and contributing to the KEGG ALS pathway as determined by SAFE
aEntrez Gene ID bSymbol gDescription δSAFE εPS/PT lFC Effect in ALS τLR
57679 ALS2 amyotrophic lateral sclerosis 2 (juvenile) - n.d. < ↓ - [11586298] n.d.
317 APAF1 apoptotic peptidase activating factor 1 - n.d. < ↑ - [16046141] n.d.
572 BAD BCL2-associated agonist of cell death + 1/1 1.38↓ ↑ - [19043451] +
581 BAX BCL2-associated X protein + 10/11 1.11↓ ↑ - [17171827] +
596 BCL2 apoptosis regulator B-cell CLL/lymphoma 2 + 10/11 1.07↑ ↑ + [20460269] +
598 BCL2L1 inhibitor of cell death BCL2-like 1 - n.d. < ↑ + [12097494] n.d.
637 BID BH3 interacting domain death agonist + 1/2 < ↑ - [12213439] n.d.
834 CASP1 caspase 1, apoptosis-related cysteine peptidase + 1/1 1.54↑ ↑ - [10764647]
-836 CASP3 caspase 3, apoptosis-related cysteine peptidase + 10/10 1.20↑ ↑ - [10764647]
-842 CASP9 caspase 9, apoptosis-related cysteine peptidase - 2/2 1.07↑ ↑ - [14657037]
-847 CAT catalase (heme containing) + 1/1 1.46↑ ↑ + [8731383] +
9973 CCS copper chaperone for superoxide dismutase - 1/1 1.08↓ ↓ - [17389365]
-11261 CHP calcineurin B homolog + 1/1 1.16↑ ↑ + [11350981] +
63928 CHP2 calcineurin B homologous protein 2 - n.d. < ↑ + [12226101] n.d.
54205 CYCS cytochrome c, somatic + 2/3 1.10↑ ↓ - [17454840] +
1616 DAXX death-domain associated protein - n.d. < ↑ - [12354397] n.d.
79139 DERL1 degradation in endoplasmic reticulum protein 1 + 1/1 < ↑ - [18519638] n.d.
2876 GPX1 glutathione peroxidase 1 + 1/1 1.22↓ ↓ - [9335008]
-2890 GRIA1 glutamate receptor, ionotropic, AMPA 1 - n.d. < ↓ - [8981413] n.d.
2891 GRIA2 glutamate receptor, ionotropic, AMPA 2 - n.d. < ↓ - [8981413] n.d.
2902 GRIN1 glutamate receptor, ionotropic, N-methyl D-aspartate 1 + 2/2 1.44↓ ↓ - [1320444] -2903 GRIN2A glutamate receptor, ionotropic, N-methyl D-aspartate 2A - n.d. < ↓ - [8842405] n.d. 2904 GRIN2B glutamate receptor, ionotropic, N-methyl D-aspartate 2B - n.d. < ↓ + [16490316] n.d. 2905 GRIN2C glutamate receptor, ionotropic, N-methyl D-aspartate 2C - n.d. < ↓ + [11717388] n.d. 2906 GRIN2D glutamate receptor, ionotropic, N-methyl D-aspartate 2D + 1/1 1.58↓ ↑ + [15152019]
-5606 MAP2K3 mitogen-activated protein kinase kinase 3 + 1/1 1.34↓ ↑ - [17686961] +
5608 MAP2K6 mitogen-activated protein kinase kinase 6 - 1/1 1.32↑ ↑ - [16219474]
-4217 MAP3K5 mitogen-activated protein kinase kinase kinase 5 + 1/1 1.10↑ ↑ - [15910777]
-5600 MAPK11 mitogen-activated protein kinase 11 - n.d. < ↑ - [9218798] n.d.
6300 MAPK12 mitogen-activated protein kinase 12 - n.d. < ↑ - [9169156] n.d.
5603 MAPK13 mitogen-activated protein kinase 13 - n.d. < ↑ - [9218798] n.d.
1432 MAPK14 mitogen-activated protein kinase 14 + 10/10 1.26↑ ↑ - [15910777]
-4744 NEFH neurofilament, heavy polypeptide - n.d. < ↓ - [7849698] n.d.
4747 NEFL neurofilament, light polypeptide - n.d. < ↓ - [15207859] n.d.
4741 NEFM neurofilament, medium polypeptide - n.d. < ↓ - [11732278] n.d.
4842 NOS1 nitric oxide synthase 1 (neuronal) - n.d. < ↑ - [15033415] n.d.
5530 PPP3CA protein phosphatase 3, catalytic subunit, alpha isozyme + 3/3 1.06↑ ↓ - [11701756] + 5532 PPP3CB protein phosphatase 3, catalytic subunit, beta isozyme + 1/1 1.28↑ ↓ - [15312178] + 5533 PPP3CC protein phosphatase 3, catalytic subunit, gamma isozyme + 1/1 < ↓ - [15312178] n.d. 5534 PPP3R1 protein phosphatase 3, regulatory subunit B, alpha - n.d. < ↓ - [11754729] n.d. 5535 PPP3R2 protein phosphatase 3, regulatory subunit B, beta - n.d. < ↓ - [11754729] n.d.
5630 PRPH peripherin - n.d. < ↓ - [20363051] n.d.
5961 PRPH2 peripherin 2 - n.d. < ↓ - [8125718] n.d.
5868 RAB5A ras-related protein Rab-5A + 1/1 1.11↓ ↓ + [11316809] +
5879 RAC1 ras-related C3 botulinum toxin substrate 1 + 12/12 1.08↓ ↓ - [18219391] -6506 SLC1A2 sodium-dependent glutamate/aspartate transporter 2 - n.d. < ↑ + [14530974] n.d.
6647 SOD1 superoxide dismutase 1, soluble + 11/11 1.24↑ ↓ - [20644736] +
7124 TNF tumor necrosis factor alpha + 1/1 1.15↑ ↑ + [18823372] +
ubiquitin ligase complex, cullin-RING ubiquitin ligase complex, proteasome core complex, prefoldin complex, and signalosome [GO:0005832, 7 proteins; GO:0000151, 57 proteins; GO:0000152, 2 proteins; GO:0031461, 8 proteins; GO:0005839, 14 proteins, GO:0016272, 10 proteins; GO:0008180, 10 proteins] (Table 4). Consider-ing gene listConsider-ing overlaps, UPS GO categories for biologi-cal processes and cellular components found significant by SAFE, represent altogether 234 unique proteins
defined by official HUGO (Human Genome Organiza-tion) gene nomenclature. Among 220 unique genes that were differentially expressed, as determined by SAM and LIMMA, (Figure 1, Additional File 1), nine are related to the UPS, including four E3 ubiquitin ligases (RNF149, TRIM22, UBR1, and UBR2) (Table 7). Also, ANAPC4, SHFM1, SUGT1, UBR1 and UBR2 were represented by the UPS GO groups found significant by SAFE.
Table 6 Genes differentially expressed in lymphocytes from ALS patients compared to healthy controls and contribut-ing to the KEGG ALS pathway as determined by SAFE(Continued)
10452 TOMM40 mitochondrial import receptor subunit TOM40 homolog - n.d. < ↓ - [20797528] n.d. 84134 TOMM40L mitochondrial import receptor subunit TOM40B - 1/1 1.23↓ ↓ - [20797528]
-7157 TP53 tumor protein p53 - n.d. < ↑ - [8609941] n.d.
Genes (53 in total, pseudogeneCASP12excluded) belonging to the KEGG ALS pathway (hsa05014) that describe pathogenic effects in motor neurons are defined by their official HUGO symbol.aEntrez Gene accession number andbHUGO symbol andgdescription are provided.δGenes that contribute to the KEGG ALS pathway through SAFE analysis are marked with a (+) sign and if not with a (-) sign. Number of probes significant (PS) per total number of probe signal intensity values per gene on the Agilent 4 × 44K array (PT) is shown.lFC is average fold change ALS (n = 11) compared to healthy controls (n = 11) considering one or more probe signal intensity values per gene, with upregulated genes indicated by (↑) and downregulated genes by (↓). Less than 1.05 fold changes are indicated by (<).PMID referenced positive (+) or negative (-) effect on motor neuron survival if wild type protein activity or function is increased (↑) or normal function or activity is altered (↓). Genes that were not determined (n.d.) to contribute to the KEGG ALS pathway or with an FC < 1.05, are also referenced for known effects.
τLymphocyte response (LR) represented by the genes contributing to the KEGG ALS pathway is shown.
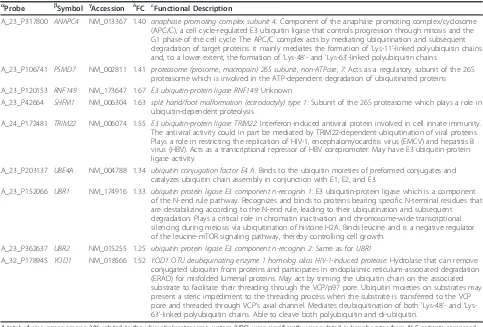
Table 7 Differentially expressed genes related to the UPS, as determined by SAM and LIMMA aProbe bSymbol gAccession δFC εFunctional Description
A_23_P317800 ANAPC4 NM_013367 1.40 anaphase promoting complex subunit 4:Component of the anaphase promoting complex/cyclosome (APC/C), a cell cycle-regulated E3 ubiquitin ligase that controls progression through mitosis and the G1 phase of the cell cycle. The APC/C complex acts by mediating ubiquitination and subsequent degradation of target proteins: it mainly mediates the formation of‘Lys-11’-linked polyubiquitin chains and, to a lower extent, the formation of‘Lys-48’- and‘Lys-63’-linked polyubiquitin chains
A_23_P106741 PSMD7 NM_002811 1.41 proteasome (prosome, macropain) 26S subunit, non-ATPase, 7:Acts as a regulatory subunit of the 26S proteasome which is involved in the ATP-dependent degradation of ubiquitinated proteins A_23_P120153 RNF149 NM_173647 1.67 E3 ubiquitin-protein ligase RNF149:Unknown
A_23_P42664 SHFM1 NM_006304 1.63 split hand/foot malformation (ectrodactyly) type 1:Subunit of the 26S proteasome which plays a role in ubiquitin-dependent proteolysis
A_24_P172481 TRIM22 NM_006074 1.55 E3 ubiquitin-protein ligase TRIM22:Interferon-induced antiviral protein involved in cell innate immunity. The antiviral activity could in part be mediated by TRIM22-dependent ubiquitination of viral proteins. Plays a role in restricting the replication of HIV-1, encephalomyocarditis virus (EMCV) and hepatitis B virus (HBV). Acts as a transcriptional repressor of HBV corepromoter. May have E3 ubiquitin-protein ligase activity.
A_23_P203137 UBE4A NM_004788 1.34 ubiquitin conjugation factor E4 A:Binds to the ubiquitin moieties of preformed conjugates and catalyzes ubiquitin chain assembly in conjunction with E1, E2, and E3.
A_23_P152066 UBR1 NM_174916 1.33 ubiquitin protein ligase E3 component n-recognin 1:E3 ubiquitin-protein ligase which is a component of the N-end rule pathway. Recognizes and binds to proteins bearing specific N-terminal residues that are destabilizing according to the N-end rule, leading to their ubiquitination and subsequent degradation. Plays a critical role in chromatin inactivation and chromosome-wide transcriptional silencing during meiosis via ubiquitination of histone H2A. Binds leucine and is a negative regulator of the leucine-mTOR signaling pathway, thereby controlling cell growth.
A_23_P362637 UBR2 NM_015255 1.25 ubiquitin protein ligase E3 component n-recognin 2:Same as forUBR1
A_32_P178945 YOD1 NM_018566 1.52 YOD1 OTU deubiquinating enzyme 1 homolog alias HIV-1-induced protease:Hydrolase that can remove conjugated ubiquitin from proteins and participates in endoplasmic reticulum-associated degradation (ERAD) for misfolded lumenal proteins. May act by triming the ubiquitin chain on the associated substrate to facilitate their threading through the VCP/p97 pore. Ubiquitin moieties on substrates may present a steric impediment to the threading process when the substrate is transferred to the VCP pore and threaded through VCP’s axial channel. Mediates deubiquitination of both‘Lys-48’- and‘ Lys-63’-linked polyubiquitin chains. Able to cleave both polyubiquitin and di-ubiquitin.
A total of nine genes among 206 related to the ubiquitin/proteasome system (UPS) were significantly upregulated in lymphocytes from ALS patients compared to controls, as determined by SAM (q < 1%) and LIMMA analyses (p < 0.001). Among them, four genes encode E3 ubiquitin ligases (RNF149,TRIM22,UBR1, and
UBR2) and one gene a deubiquitinase (YOD1).aAgilent Array 4 × 44K probe IDs,bgene symbol,gNCBI GenBank accession number,δfold change in expression and
Assessment of alteration of UPS-related gene expression in lymphocytes from ALS patients based on microarray data
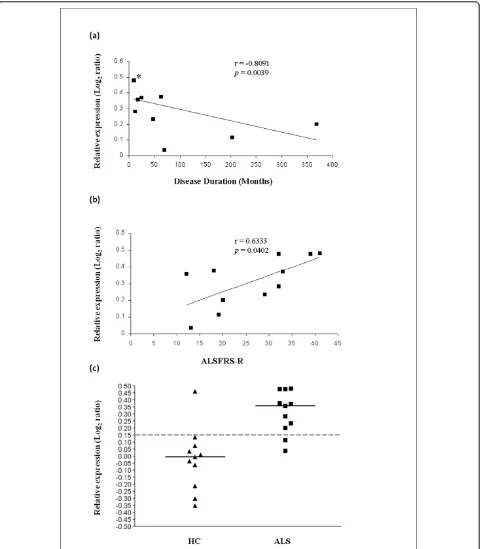
Correlation of ANAPC4, SHFM, SUGT1, UBR1 and UBR2 with demographic and disease parameters was determined. Among these five genes,UBR2 (Ubiquitin-protein ligase E3-alpha-2) encoded (Ubiquitin-protein is known to act in conjunction with UBR1 in a quality control path-way for degradation of unfolded cytosolic proteins [39]. We calculated Spearman correlation between expression data and length of the disease from symptom onset and the ALS Functional Rating Scale-Revised score (ALSFRS-R) at the time of peripheral blood sampling. Significant correlation was found between UBR2 increased gene expression and time of disease from onset to time of lymphocyte sampling (r = -0.8091, p = 0.0039), as well as ALSFRS-R (r = 0.6333, p = 0.0402) (Figure 3, Table 8). Similar to Sariset al.(2009) [11], we found no correlation between the expression of these genes with gender, age at onset, age at collection, and site of onset. However, unlike Sariset al.(2009) [11] but similar to Zhanget al. (2006) [13] we present correla-tions of individual genes with disease duration and ALSFRS-R.
Assessment of alteration of the UPS in PBMCs from ALS patients using proteasome inhibition assays
We employed the MG132 proteasome inhibition assay to test whether the UPS transcriptional alterations described above are accompanied by ubiquitination changes at the protein level. MG132 blocks the proteo-lytic activity of the 26S proteasome complex reversibly, which inhibits the degradation of ubiquitin-conjugated proteins and has multiple effects including, for instance, reducing muscle atrophy associated with disuse [40] or increasing caspase-mediated generation of TDP-43 C-terminal fragments [41]. We prepared peripheral blood mononuclear cell (PBMC) short-term cultures from ALS patients (n = 6) and healthy control subjects (n = 5). High molecular weight (HMW) poly-ubiquitinated pro-tein forms were detected in propro-tein lysates of these PBMCs by Western blot analysis using monoclonal anti-ubiquitin antibody similarly to Jury et al.(2003) [42]. For PBMCs from healthy control subjects, cultured in RPMI [10% FCS] medium, accumulation of HMW poly-ubiquitinated proteins was induced by MG132 treat-ment, but this accumulation was partially mitigated by the supplementation of the RPMI [10% FCS] medium with matched autologous human serum at a final con-centration of 20% (Figure 4). For PBMCs from ALS patients, cultured in RPMI [10% FCS] medium, accumu-lation of HMW poly-ubiquinated proteins was induced by MG132 treatment, and this accumulation was further
increased by addition of autologous human serum from each ALS patient (Figure 4).
Discussion
Figure 3Relationship betweenUBR2transcriptional expression in lymphocytes from ALS patients and progression of the disease. Expression ofUBR2varies inversely with the length of the disease from onset to lymphocyte gene expression testing, and varies directly with the ALS-FRS-R score. Duration of the disease from onset to sampling (i.e.Disease Duration)(a)(*three close values) or the ALSFRS-R score at the time of sampling(b)are indicated on the x-axis. Log2ratios of expression obtained from the dual mode reference design are represented on the y axis. Dot plot(c)shows that with a cut-off of 0.15, discrimination between ALS patients [ALS] and healthy controls [HC] forUBR2
identified by various genetic analyses for their associa-tion with ALS. The fact that SAFE, LIMMA, and SAM identifiedSOD1 mRNA upregulation to be significant confirms findings by Gagliardiet al. (2010). Gagliardiet al.showed that SOD1 mRNA levels were increased in spinal cord, brain stem, and lymphocytes of sporadic ALS patients, but did not correlate with gender, age or duration of the disease [12].
For the first time, gene expression data from the blood compartment from sporadic ALS patients could be asso-ciated with the KEGG ALS disease pathway and KEGG disease pathways of neurodegenerative disorders such as Alzheimer’s, Parkinson’s and Huntington’s diseases. Considering that global genome-wide subtle changes in gene expression were used for this determination, this result is rather unexpected. Protein activity changes that are caused by the presence of the disease are generally not expected to consistently correspond to transcrip-tional regulations. Our use of purified lymphocytes has likely provided a better dataset to study ALS-specific signature in the blood compartment as opposed to total blood.
However, because of the small sample size of our study (n = 22) and because ALS is a heterogeneous ease, it is not possible to capture the breadth of the dis-ease process occurring during onset and progression of the disease. In addition, disease responses in lympho-cytes may not mirror many of the disease processes occurring in brain, which depend on the alteration of the blood brain barrier and the microenvironment represented by glia and microglia. Furthermore, assum-ing that transcriptional regulation produces more or less active protein with appropriate subcellular localization and in a timely manner, about half of the genes based on their expression would have a negative effect on motor neuron survival while the rest would have a
positive effect according to current ALS literature (Table 6). This clearly indicates very limited replication of processes occurring in brain or spinal cord of ALS patients. Thus, while similar pathways are affected in motor neurons and lymphocytes due to a possible sys-temic common cause(s), it is expected that some responses may differ in their details possibly reflecting differential susceptibility.
In our pathway analysis of the dataset DS7000 gener-ated with Agilent Human Whole Genome 4 × 44K Array, SAFE identified alteration of gene expression per-taining to gene ontology (GO) categories relevant to ALS pathogenesis (and/or other neurological diseases), such as DNA metabolism, RNA splicing, mitochondrial function, oxidation, ER and Golgi functions, UPS, neu-rological function, post-translational modification and viral infection. These results are consistent with findings by Saris et al. (2009) that were determined by whole blood RNA profiling [11]. However, following pathway analysis using SAFE, we went further in the analysis of transcriptional alterations of the UPS by identifying a correlation between the expression of differentially expressed individual UPS-related genes and the time of presence of the disease or the ALSFRS-R. Indeed, whole exome sequencing identified mutations in the gene encoding valosin-containing protein (VCP), a key com-ponent of the UPS, as a cause of familial ALS, demon-strating that disturbances of UPS function may be closely linked to ALS pathogenesis [45]. A total of nine differentially expressed genes, were related to the UPS including four ubiquitin ligases representative of UPS GO groups identified by SAFE (ANAPC4, SHFM1, UBR1, andUBR2). Differential expression of the“N-end rule” ubiquitin ligase UBR2 gene [46] in lymphocytes from ALS patients was found to correlate with disease duration and ALSFRS-R at the time of sampling. Although, overallUBR2 mRNA expression is upregu-lated in ALS patients compared to healthy controls, a decrease in expression correlated with more advanced stage or severity. This apparent paradox can be explained by the possibility that an initial disease pro-cess to which healthy controls are never exposed, causes an initial upregulation of UBR2 mRNA expression which then declines as the disease progresses with increasing impairment of the UPS machinery. One pos-sible mechanism of action of E3 ubiquitin ligases UBR1 and UBR2 could be to facilitate targeting of foldable conformers to the proteasome [39] and to provide pro-tection against toxicity of (unknown) misfolded proteins that accumulate during the disease course in lympho-cytes from ALS patients. This mechanism is similar to the E3 ubiquitin ligase dorfin (encoded byRNF19A) that prevents mutant SOD1-mediated neurotoxicity and improves symptoms in the transgenic G93A SOD1
Table 8 Correlation between expression data of differentially expressed UPS genes and ALSFRS-R or disease duration
Spearman Correlation
Gene Probe Disease Duration ALSFRS-R
ANAPC4 A_23_P317800 r = -0.0364 r = -0.2642 p = 0.9241 p = 0.4348
SHFM1 A_23_P42664 r = 0.3909 r = -0.3144
p = 0.2366 p = 0.3415
SUGT1 A_23_P162787 r = 0.3636 r = -0.3736
p = 0.2731 p = 0.2608
UBR1 A_23_P152066 r = 0.0636 r = 0.2323
p = 0.8603 p = 0.4854
UBR2 A_23_P362637 r = -0.8091 r = 0.6333
p = 0.0039* p = 0.0402*
mouse model [47,48]. Indeed, the presence of some cel-lular toxicity in PBMCs was shown by De Marco et al. (2010) [49] who determined that the cytoplasmic frac-tion of TDP-43 in circulating PBMCs of sporadic and familial ALS patients was increased. In addition, by ana-logy with mutant SOD1-mediated toxicity, human wild-type TDP-43-mediated neurotoxicity might be partially alleviated by co-expression with ubiquilin 1 (encoded by UBQLN1) involved in autophagy and proteasome target-ing [50,51]. Moreover, mutations in ubiquilin 2 (encoded by UBQLN2) have been associated with X-linked juvenile ALS and adult sporadic ALS [52]. Ubi-quilins bind to both ubiquitin ligases and the protea-some, providing a connector function within the UPS [53].
Our proteasome inhibition assays also indicate that lymphocytes from ALS patients exposed to serum fac-tors and metabolitesin vivohave acquired new proper-ties with regard to the UPS and other pathways that are normally perturbed in degenerating motor neurons. In this respect, the study by Watanabe et al.(2010) [54], showing that metabolic alterations of the UPS may take place in the skin of ALS patients, follows the same para-digm. In addition, using short-term PBMC cultures Zhanget al. (2011) [13] showed that monocytes in ALS patients have acquired unique properties that relate to neuroinflammation and innate immunity.
Conclusions
Our approach demonstrates that subtle changes in gene expression measured by Agilent Human Whole Genome 4 × 44K Array may be interpreted objectively. Without underestimating the complexity of ALS pathogenesis, our analyses with these arrays identify multiple new directions worth further investigation, including sys-temic UPS pathway alterations, in the search of biomar-kers associated with the cause(s) or the progression of ALS. Overall, it remains to be determined which proper-ties the circulating lymphocytes acquire by long distance signaling in the peripheral blood system, and which properties they acquire by local signaling or local cell-cell contact due to trafficking of the lymphocytes at the sites of neurodegeneration in brain or spinal cord.
Additional material
Additional file 1: SAM analysis (q < 1%) and LIMMA analysis conducted independently using DS7000. Probe set IDs, gene symbol, GenBank NCBI accession number, fold change (FC) ALSvs. healthy controls, local FDR (q value in %), LIMMA significance p value and q value, and log2ratios of normalized expression data and gene descriptions are shown. FC >1 signifies higher expression in the ALS group.
Additional file 2: SAFE results of the KEGG disease pathways. Raw SAFE data are presented for the 25 disease pathways (gene set size
5-100) and 34 disease pathways (including gene sets with >100 genes) analyzed using the DS7000 microarray dataset. These pathways represent cancer, circulatory, genetic, immune, neurological and urological diseases.
Acknowledgements and Funding
We would like to thank Drs. Herbert L Bonkovsky and Farah K Mougeot for critical review of the manuscript. We also thank the Carolinas
Neuromuscular/ALS-MDA Center staff for their help with consenting patients and acquisition of patients’samples and data. This work was supported by grants from the Carolinas ALS Research Fund of the Carolinas Healthcare Foundation, the Charlotte-Mecklenburg Health Services Foundation (HSF), and a grant from the North Carolina Translational and Clinical Sciences Institute (Award 10KR40936).
Author details
1Department of Neurology, ALS Biomarker Laboratory - James G Cannon
Research Center, Carolinas Medical Center, 1542 Garden Terrace, Charlotte, NC 28203-6110, USA.2Department of Neurology, Carolinas Neuromuscular/ ALS-MDA Center, Carolinas Medical Center, 1010 Edgehill Road North, Charlotte, NC 28207-1885, USA.3Department of Neurology, University of North Carolina School of Medicine-Charlotte Campus, Carolinas Medical Center, 1000 Blythe Blvd, Charlotte, NC 28203-5812, USA.4Department of Biostatistics, University of North Carolina at Chapel Hill, 4115B McGavran-Greenberg Hall, CB #7420, Chapel Hill, NC 27599-7420, USA.
Authors’contributions
J-LM conceived the study and designed the microarray experiments and proteasome inhibition experiments, conducted MIDAS-TM4 data normalization, SAM and LIMMA analyses, and Western blot analyses with ImageJ program, and wrote the manuscript. J-LM isolated lymphocytes from ALS patients and controls which were lysed in TriZol prior to shipping to Cogenics, Inc. for microarray experiments with Agilent Human Whole Genome 4 × 44k Arrays. FAW and ZL performed the SAFE analyses and compared MIDAS-TM4 normalization to several alternative methods of normalization (MIDAS-TM4 producing best normalization), verified SAM and LIMMA analyses. AEP isolated PBMCs from ALS patients and healthy controls, carried out the proteasome inhibition assays and Western blotting. BRB coordinated ALS patients and healthy controls sample collection, verified diagnosis and disease characteristics at the time of lymphocyte sampling and contributed to revisions of the manuscript and to the emphasis on clinical significance of the results. All authors have read and approved the final manuscript.
Competing interests
The authors declare that they have no competing interests.
Received: 24 May 2011 Accepted: 25 October 2011 Published: 25 October 2011
References
1. Bodansky A, Kim JM, Tempest L, Velagapudi A, Libby R, Ravits J:TDP-43 and ubiquitinated cytoplasmic aggregates in sporadic ALS are low frequency and widely distributed in the lower motor neuron columns independent of disease spread.Amyotroph Lateral Scler2010, 11(3):321-327.
2. van Es MA, Veldink JH, Saris CG, Blauw HM, van Vught PW, Birve A, Lemmens R, Schelhaas HJ, Groen EJ, Huisman MH, van der Kooi AJ, de Visser M, Dahlberg C, Estrada K, Rivadeneira F, Hofman A, Zwarts MJ, van Doormaal PT, Rujescu D, Strengman E, Giegling I, Muglia P, Tomik B, Slowik A, Uitterlinden AG, Hendrich C, Waibel S, Meyer T, Ludolph AC, Glass JD,et al:Genome-wide association study identifies 19p13.3 (UNC13A) and 9p21.2 as susceptibility loci for sporadic amyotrophic lateral sclerosis.Nat Genet2009,41(10):1083-1087.
3. van Es MA, van Vught PW, Blauw HM, Franke L, Saris CG, Andersen PM, van den Bosch L, de Jong SW, van’t Slot R, Birve A, Lemmens R, de Jong V, Baas F, Schelhaas HJ, Sleegers K, van Broeckhoven C, Wokke JH,
as a susceptibility gene in sporadic amyotrophic lateral sclerosis: a genome-wide association study.Lancet Neurol2007,6(10):869-77. 4. van Es MA, van Vught PW, Veldink JH, Andersen PM, Birve A, Lemmens R,
Cronin S, van der Kooi AJ, de Visser M, Schelhaas HJ, Hardiman O, Ragoussis I, Lambrechts D, Robberecht W, Wokke JH, Ophoff RA, van den Berg LH:Analysis of FGGY as a risk factor for sporadic amyotrophic lateral sclerosis.Amyotroph Lateral Scler2009,10(5-6):441-7.
5. van Es MA, van Vught PW, Blauw HM, Franke L, Saris CG, van den Bosch L, de Jong SW, de Jong V, Baas F, van’t Slot R, Lemmens R, Schelhaas HJ, Birve A, Sleegers K, van Broeckhoven C, Schymick JC, Traynor BJ, Wokke JH, Wijmenga C, Robberecht W, Andersen PM, Veldink JH, Ophoff RA, van den Berg LH:Genetic variation in DPP6 is associated with susceptibility to amyotrophic lateral sclerosis.Nat Genet2008,40(1):29-31.
6. Daoud H, Belzil V, Desjarlais A, Camu W, Dion PA, Rouleau GA:Analysis of the UNC13A gene as a risk factor for sporadic amyotrophic lateral sclerosis.Arch Neurol2010,67(4):516-7.
7. Shatunov A, Mok K, Newhouse S, Weale ME, Smith B, Vance C, Johnson L, Veldink JH, van Es MA, van den Berg LH, Robberecht W, van Damme P, Hardiman O, Farmer AE, Lewis CM, Butler AW, Abel O, Andersen PM, Fogh I, Silani V, Chiò A, Traynor BJ, Melki J, Meininger V, Landers JE, McGuffin P, Glass JD, Pall H, Leigh PN, Hardy J,et al:Chromosome 9p21 in sporadic amyotrophic lateral sclerosis in the UK and seven other countries: a genome-wide association study.Lancet Neurol2010,9(10):986-94. 8. The Euro-MOTOR project.[http://www.euromotorproject.eu]. 9. Kudo LC, Parfenova L, Vi N, Lau K, Pomakian J, Valdmanis P, Rouleau GA,
Vinters HV, Wiedau-Pazos M, Karsten SL:Integrative gene-tissue microarray-based approach for identification of human disease biomarkers: application to amyotrophic lateral sclerosis.Hum Mol Genet
2010,19(16):3233-3253.
10. Lin J, Diamanduros A, Chowdhury SA, Scelsa S, Latov N, Sadiq SA:Specific electron transport chain abnormalities in amyotrophic lateral sclerosis.J Neurol2009,256(5):774-782.
11. Saris CG, Horvath S, van Vught PW, van Es MA, Blauw HM, Fuller TF, Langfelder P, DeYoung J, Wokke JH, Veldink JH, van den Berg LH, Ophoff RA:Weighted gene co-expression network analysis of the peripheral blood from Amyotrophic Lateral Sclerosis patients.BMC Genomics2009,10:405.
12. Gagliardi S, Cova E, Davin A, Guareschi S, Abel K, Alvisi E, Laforenza U, Ghidoni R, Cashman JR, Ceroni M, Cereda C:SOD1 mRNA expression in sporadic amyotrophic lateral sclerosis.Neurobiol Dis2010,39(2):198-203. 13. Zhang R, Hadlock KG, Do H, Yu S, Honrada R, Champion S, Forshew D,
Madison C, Katz J, Miller RG, McGrath MS:Gene expression profiling in peripheral blood mononuclear cells from patients with sporadic amyotrophic lateral sclerosis (sALS).J Neuroimmunol2010, 230(1-2):114-123.
14. Lincecum JM, Vieira FG, Wang MZ, Thompson K, De Zutter GS, Kidd J, Moreno A, Sanchez R, Carrion IJ, Levine BA, Al-Nakhala BM, Sullivan SM, Gill A, Perrin S:From transcriptome analysis to therapeutic anti-CD40L treatment in the SOD1 model of amyotrophic lateral sclerosis.Nat Genet
2010,42(5):392-9.
15. Garbuzova-Davis S, Saporta S, Sanberg PR:Implications of blood-brain barrier disruption in ALS.Amyotroph Lateral Scler2008,9(6):375-376. 16. Palmer C, Diehn M, Alizadeh AA, Brown PO:Cell-type specific gene
expression profiles of leukocytes in human peripheral blood.BMC Genomics2006,7:115.
17. Min JL, Barrett A, Watts T, Pettersson FH, Lockstone HE, Lindgren CM, Taylor JM, Allen M, Zondervan KT, McCarthy MI:Variability of gene expression profiles in human blood and lymphoblastoid cell lines.BMC Genomics2010,11:96.
18. Kerr MK:Linear models for microarray data analysis: hidden similarities and differences.J Comput Biol2003,10(6):891-901.
19. Tusher VG, Tibshirani R, Chu G:Significance analysis of microarrays applied to the ionizing radiation response.Proc Natl Acad Sci USA2001, 98(9):5116-5121.
20. Barry WT, Nobel AB, Wright FA:Significance analysis of functional categories in gene expression studies: a structured permutation approach.Bioinformatics2005,21(9):1943-1949.
21. Brooks BR, Miller RG, Swash M, Munsat TL:El Escorial revisited: revised criteria for the diagnosis of amyotrophic lateral sclerosis.Amyotroph Lateral Scler Other Motor Neuron Disord2000,1(5):293-299.
22. Repnik U, Knezevic M, Jeras M:Simple and cost-effective isolation of monocytes from buffy coats.J Immunol Methods2003,278(1-2):283-292. 23. Rosa GJ, Steibel JP, Tempelman RJ:Reassessing design and analysis of
two-colour microarray experiments using mixed effects models.Comp Funct Genomics2005,6(3):123-131.
24. The NCBI Gene Expression Omnibus database.[http://www.ncbi.nlm.nih. gov/geo].
25. Sioson AA, Mane SP, Li P, Sha W, Heath LS, Bohnert HJ, Grene R:The statistics of identifying differentially expressed genes in Expresso and TM4: a comparison.BMC Bioinformatics2006,7:215.
26. Münch C, Rosenbohm A, Sperfeld AD, Uttner I, Reske S, Krause BJ, Sedlmeier R, Meyer T, Hanemann CO, Stumm G, Ludolph AC:Heterozygous R1101K mutation of the DCTN1 gene in a family with ALS and FTD.Ann Neurol2005,58(5):777-80.
27. Kabashi E, Valdmanis PN, Dion P, Spiegelman D, McConkey BJ, Vande Velde C, Bouchard JP, Lacomblez L, Pochigaeva K, Salachas F, Pradat PF, Camu W, Meininger V, Dupre N, Rouleau GA:TARDBP mutations in individuals with sporadic and familial amyotrophic lateral sclerosis.Nat Genet2008,40(5):572-4.
28. Liu-Yesucevitz L, Bilgutay A, Zhang YJ, Vanderwyde T, Citro A, Mehta T, Zaarur N, McKee A, Bowser R, Sherman M, Petrucelli L, Wolozin B:Tar DNA binding protein-43 (TDP-43) associates with stress granules: analysis of cultured cells and pathological brain tissue.PLoS One2010,5(10):e13250. 29. Schilders G, van Dijk E, Pruijn GJ:C1D and hMtr4p associate with the
human exosome subunit PM/Scl-100 and are involved in pre-rRNA processing.Nucleic Acids Res2007,35(8):2564-2572.
30. Jurica MS, Licklider LJ, Gygi SR, Grigorieff N, Moore MJ:Purification and characterization of native spliceosomes suitable for three-dimensional structural analysis.RNA2002,8(4):426-439.
31. Kovar H:Dr. Jekyll and Mr. Hyde: The Two Faces of the FUS/EWS/TAF15 Protein Family.Sarcoma2011,2011:837474.
32. Kolb SJ, Sutton S, Schoenberg DR:RNA processing defects associated with diseases of the motor neuron.Muscle Nerve2010,41(1):5-17. 33. Gregory SG, Schmidt S, Seth P, Oksenberg JR, Hart J, Prokop A, Caillier SJ,
Ban M, Goris A, Barcellos LF, Lincoln R, McCauley JL, Sawcer SJ, Compston DA, Dubois B, Hauser SL, Garcia-Blanco MA, Pericak-Vance MA, Haines JL, Multiple Sclerosis Genetics Group:Interleukin 7 receptor alpha chain (IL7R) shows allelic and functional association with multiple sclerosis.Nat Genet2007,39(9):1083-1091.
34. Hu WH, Hausmann ON, Yan MS, Walters WM, Wong PK, Bethea JR: Identification and characterization of a novel Nogo-interacting mitochondrial protein (NIMP).J Neurochem2002,81(1):36-45.
35. Subramanian A, Tamayo P, Mootha VK, Mukherjee S, Ebert BL, Gillette MA, Paulovich A, Pomeroy SL, Golub TR, Lander ES, Mesirov JP:Gene set enrichment analysis: a knowledge-based approach for interpreting genome-wide expression profiles.Proc Natl Acad Sci USA2005, 102(43):15545-15550.
36. Gatti DM, Barry WT, Nobel AB, Rusyn I, Wright FA:Heading down the wrong pathway: on the influence of correlation within gene sets.BMC Genomics2010,11:574.
37. The KEGG ALS Pathway.[http://www.genome.jp/kegg/pathway/hsa/ hsa05014.html].
38. The AmiGO gene ontology database.[http://amigo.geneontology.org]. 39. Nillegoda NB, Theodoraki MA, Mandal AK, Mayo KJ, Ren HY, Sultana R,
Wu K, Johnson J, Cyr DM, Caplan AJ:Ubr1 and Ubr2 function in a quality control pathway for degradation of unfolded cytosolic proteins.Mol Biol Cell2010,21(13):2102-2116.
40. Jamart C, Raymackers JM, Li An G, Deldicque L, Francaux M:Prevention of muscle disuse atrophy by MG132 proteasome inhibitor.Muscle Nerve
2010,43(5):708-715.
41. Kleinberger G, Wils H, Ponsaerts P, Joris G, Timmermans JP, Van Broeckhoven C, Kumar-Singh S:Increased caspase activation and decreased TDP-43 solubility in progranulin knockout cortical cultures.J Neurochem2010,115(3):735-747.
42. Jury EC, Kabouridis PS, Abba A, Mageed RA, Isenberg DA:Increased ubiquitination and reduced expression of LCK in T lymphocytes from patients with systemic lupus erythematosus.Arthritis Rheum2003, 48(5):1343-1354.
44. Fujita A, Sato JR, Rodrigues Lde O, Ferreira CE, Sogayar MC:Evaluating different methods of microarray data normalization.BMC Bioinformatics
2006,7:469.
45. Johnson JO, Mandrioli J, Benatar M, Abramzon Y, van Deerlin VM, Trojanowski JQ, Gibbs JR, Brunetti M, Gronka S, Wuu J, Ding J, McCluskey L, Martinez-Lage M, Falcone D, Hernandez DG, Arepalli S, Chong S, Schymick JC, Rothstein J, Landi F, Wang YD, Calvo A, Mora G, Sabatelli M, Monsurrò MR, Battistini S, Salvi F, Spataro R, Sola P, Borghero G,et al: Exome sequencing reveals VCP mutations as a cause of familial ALS.
Neuron2010,68(5):857-64.
46. Kume K, Iizumi Y, Shimada M, Ito Y, Kishi T, Yamaguchi Y, Handa H:Role of N-end rule ubiquitin ligases UBR1 and UBR2 in regulating the leucine-mTOR signaling pathway.Genes Cells2010,15(4):339-49.
47. Niwa J, Ishigaki S, Hishikawa N, Yamamoto M, Doyu M, Murata S, Tanaka K, Taniguchi N, Sobue G:Dorfin ubiquitylates mutant SOD1 and prevents mutant SOD1-mediated neurotoxicity.J Biol Chem2002,
277(39):36793-36798.
48. Sone J, Niwa J, Kawai K, Ishigaki S, Yamada S, Adachi H, Katsuno M, Tanaka F, Doyu M, Sobue G:Dorfin ameliorates phenotypes in a transgenic mouse model of amyotrophic lateral sclerosis.J Neurosci Res
2010,88(1):123-135.
49. De Marco G, Lupino E, Calvo A, Moglia C, Buccinnà B, Grifoni S, Ramondetti C, Lomartire A, Rinaudo MT, Piccinini M, Giordana MT, Chiò A: Cytoplasmic accumulation of TDP-43 in circulating lymphomonocytes of ALS patients with and without TARDBP mutations.Acta Neuropathol
2011,121(5):611-22.
50. Hanson KA, Kim SH, Wassarman DA, Tibbetts RS:Ubiquilin modifies TDP-43 toxicity in a Drosophila model of amyotrophic lateral sclerosis (ALS).J Biol Chem285(15):11068-11072.
51. Kim SH, Shi Y, Hanson KA, Williams LM, Sakasai R, Bowler MJ, Tibbetts RS: Potentiation of amyotrophic lateral sclerosis (ALS)-associated TDP-43 aggregation by the proteasome-targeting factor, ubiquilin 1.J Biol Chem
2009,284(12):8083-8092.
52. Deng HX, Chen W, Hong ST, Boycott KM, Gorrie GH, Siddique N, Yang Y, Fecto F, Shi Y, Zhai H, Jiang H, Hirano M, Rampersaud E, Jansen GH, Donkervoort S, Bigio EH, Brooks BR, Ajroud K, Sufit RL, Haines JL, Mugnaini E, Pericak-Vance MA, Siddique T:Mutations in UBQLN2 cause dominant X-linked juvenile and adult-onset ALS and ALS/dementia.
Nature2011,477(7363):211-5.
53. Kleijnen MF, Shih AH, Zhou P, Kumar S, Soccio RE, Kedersha NL, Gill G, Howley PM:The hPLIC proteins may provide a link between the ubiquitination machinery and the proteasome.Mol Cell6(2):409-19. 54. Watanabe T, Okeda Y, Yamano T, Ono S:An immunohistochemical study
of ubiquitin in the skin of sporadic amyotrophic lateral sclerosis.J Neurol Sci2010,298(1-2):52-56.
Pre-publication history
The pre-publication history for this paper can be accessed here: http://www.biomedcentral.com/1755-8794/4/74/prepub
doi:10.1186/1755-8794-4-74
Cite this article as:Mougeotet al.:Microarray analysis of peripheral blood lymphocytes from ALS patients and the SAFE detection of the KEGG ALS pathway.BMC Medical Genomics20114:74.
Submit your next manuscript to BioMed Central and take full advantage of:
• Convenient online submission
• Thorough peer review
• No space constraints or color figure charges
• Immediate publication on acceptance
• Inclusion in PubMed, CAS, Scopus and Google Scholar
• Research which is freely available for redistribution