Tribology in Industry
www.tribology.rs
Mathematical Modelling and Optimization of the
Compressive Strength, Hardness and Density of a
Periwinkle-Palm Kernel and Phenolic Resin
Composite Brake Pad
B. Dan-asabe
a, A. Stephen
aaDepartment of Mechanical Engineering, Ahmadu Bello University, Zaria, Nigeria.
Keywords:
Periwinkle shell powder Composite brake pad Mathematical model Quartic model
Palm kernel shell powder Compressive strength Mixture design
A B S T R A C T
A composite of periwinkle shell powder, palm kernel shell powder, phenolic resin and other additives was developed in a form of a pad. Specimen composite samples were produced by compression at a temperature of 140 ͦC and mixture design using Design Expert software was used to analyse and optimise the samples. Mathematical models of the compressive stength, hardness and density were developed and statistically validated. Comparison of the models with experimental results showed that the compressive strength suited best with the cubic model, the hardness fitted with quadratic while the density agreed with all the models but suited best with cubic model. Optimized formulation with an objective of maximization compressive strength and hardness and minimization of the density was determined at 10.02, 10.78, 59.20 and 20 % of periwinkle shell powder (filler), palm kernel shell powder (filler), phenolic resin (matrix) and additives respectively.
© 2018 Published by Faculty of Engineering Corresponding author:
Bashar Dan-asabe
Ahmadu Bello University, Samaru, Zaria, Nigeria.
E-mail: [email protected]
1. INTRODUCTION
Development of composite brake pad that maximizes compressive strength and hardness and minimizes wear and density is essential in terms of cost savings using natural fibres of plant origin and other synthetic materials while improving the safety on our high ways. The importance of brake pad is to transform the kinetic energy of a vehicle to heat energy via friction and ejecting the heat to the surrounding environment [1]. Over 2,000 different materials and their variants have been used in commercial
brake components [2]. The first brake pad material composed of cotton material impregnated with bitumen solution was invented by Herbert Frood [3] in 1879 which led to the establishment of the first brake pad company known as Ferodo Company. Composite brake pad constituents’ materials are composed of varied composition of abrasives, binders, friction modifiers, fillers and reinforcements [4,5].
A composite material basically consists of matrix and reinforcement/filler. Combinations of different matrices and or different
R
ES
EA
R
reinforcements have been used to develop hybrid composites [6]. Some recent works on development and characterization of polymeric composites brake pad have been summarized thus. Olabisi et al. [7] developed a composite brake pad using pulverized cocoa beans shells as filler and epoxy as binder. Ademoh et al. [8] developed a composite brake pad using maize husks as filler and epoxy as binder. Thiyagarajan et al. [9] determined the influence of thermal conductivity and thermal stability of non‑ asbestos semi‑metallic disc brake pad as a necessary requirement for friction materials.
Mixture experiments are a special case of response surface experiments where the response depends on the proportions of the various components and not on absolute amounts. An example is the strength of an alloy which depends on the various constituents’ metals. Design variable constituents must be nonnegative and add up to one [10,11]. A general regression function of a 3rd degree polynomial that can be fitted to experimental data with q number of factors is given in the following [12,10]:
𝑌 = ∑ 𝑏𝑖𝑥𝑖 𝑞
𝑖=1
+ ∑ ∑ 𝑏𝑖𝑗𝑥𝑖 𝑥𝑗 𝑞
𝑖≤𝑗 𝑞
+ ∑ ∑ 𝑏𝑖𝑗∗𝑥𝑖 𝑥𝑗(𝑥𝑖− 𝑥𝑗) 𝑞
𝑖≤𝑗 𝑞
+ ∑ ∑ ∑ 𝑏𝑖𝑗𝑘𝑥𝑖 𝑥𝑗𝑥𝑘 𝑞
𝑞
𝑖≤𝑗≤𝑘 𝑞
(1)
The response for a three component mixture (𝑥1, 𝑥2 and 𝑥3) using Sheffe’s canonical polynomials can be evaluated in terms of linear, quadratic, cubic, special cubic, quartic and special quartic prediction models respectively as given in the following [10,13]:
𝑦(𝑥𝑖) = 𝑏1𝑥1+ 𝑏2𝑥2+ 𝑏3𝑥3 (2)
𝑦(𝑥𝑖) = 𝑏1𝑥1+ 𝑏2𝑥2+ 𝑏3𝑥3+ 𝑏12𝑥1𝑥2+ 𝑏13𝑥1𝑥3+ 𝑏23𝑥2𝑥3 (3)
𝑦(𝑥𝑖) = 𝑏1𝑥1+ 𝑏2𝑥2+ 𝑏3𝑥3+ 𝑏12𝑥1𝑥2+ 𝑏13𝑥1𝑥3+ 𝑏23𝑥2𝑥3+ 𝑏123𝑥1𝑥2𝑥3+ 𝑏∗12𝑥1𝑥2(𝑥1−𝑥2) +
𝑏∗13𝑥1𝑥3(𝑥1−𝑥3) + 𝑏∗23𝑥2𝑥3(𝑥2−𝑥3) (4)
𝑦(𝑥𝑖) = 𝑏1𝑥1+ 𝑏2𝑥2+ 𝑏3𝑥3+ 𝑏12𝑥1𝑥2+ 𝑏13𝑥1𝑥3+ 𝑏23𝑥2𝑥3+ 𝑏123𝑥1𝑥2𝑥3 (5)
𝑦(𝑥𝑖) = 𝑏1𝑥1+ 𝑏2𝑥2+ 𝑏3𝑥3+ 𝑏12𝑥1𝑥2+ 𝑏13𝑥1𝑥3+ 𝑏23𝑥2𝑥3+ 𝑏∗12𝑥1𝑥2(𝑥1−𝑥2) + 𝑏∗13𝑥1𝑥3(𝑥1−𝑥3) + 𝑏∗23𝑥2𝑥3(𝑥2−𝑥3) + 𝑏1∗23𝑥12𝑥2𝑥3+ 𝑏12∗3𝑥1𝑥22𝑥3+ 𝑏123∗𝑥1𝑥2𝑥32+ |𝑏12∗𝑥1𝑥2(𝑥1−𝑥2)2+
𝑏13∗𝑥1𝑥3(𝑥1−𝑥3)2+ 𝑏23∗𝑥2𝑥3(𝑥2−𝑥3)2 (6)
𝑦(𝑥𝑖) = 𝑏1𝑥1+ 𝑏2𝑥2+ 𝑏3𝑥3+ 𝑏12𝑥1𝑥2+ 𝑏13𝑥1𝑥3+ 𝑏23𝑥2𝑥3+ 𝑏1∗23𝑥12𝑥2𝑥3+ 𝑏12∗3𝑥1𝑥22𝑥3+ 𝑏123∗𝑥1𝑥2𝑥32 (7)
where the coefficients 𝑏1, 𝑏2, 𝑏3, 𝑏12, 𝑏13, 𝑏23, 𝑏123, 𝑏∗12, 𝑏∗13, 𝑏∗23, 𝑏1∗23, 𝑏12∗3, 𝑏123∗, 𝑏12∗, 𝑏13∗ and 𝑏23∗ are constants determined simultaneously with the experimental variables and characterized results.
Mixture experiments are widely used today in formulation experiments, blending experiments and marketing choice experiments where the goal is to determine the most preferred attribute composition of a product at a given price [14]. Many researchers have used mixture design, response surface methodology (RSM) and other statistical methods to design and model their experimental data. Dan-asabe et al. [15] modelled and optimized the properties of a hybrid composite using mixture design. Agunsoye et al. [16] investigated the use of Delonix regia (Dr) seed particles as reinforcement for polymeric recycled low density polyethylene (RLDPE) composite produced using compression molding and predicted the tensile property of the RLDPE/Dr particle composites using mono-variate regression model. Javier [17] analyses the choice of slack-variable regression model amongst others mixture design experiments models such as Scheffé model and Kronecker model.
composition and physico-chemical properties of soy, peanut and cow milk. Other researchers have used mixture design experiment and response models in optimization of juices and food ingredients [23,24].
The research work involved statistical mixture design, characterization, mathematical modelling, analysis and optimisation of a composite brake pad. The composite constituent consist of phenolic resin as matrix, periwinkle and palm kernel shell as fillers and other additives that include abrasives and friction modifiers. Natural fibres of plant origins have lower densities and provide good specific properties, better insulating advantage and low energy consumption during their growth or processing [25,26].
2. EXPERIMENT
2.1 Materials and Methods
Materials
Materials used are periwinkle shell powder, palm kernel shell powder, phenolic resin and additives comprising of friction modifier (saw dust and calcium oxide) and abrasive (iron filings and aluminum oxide).
Preparation
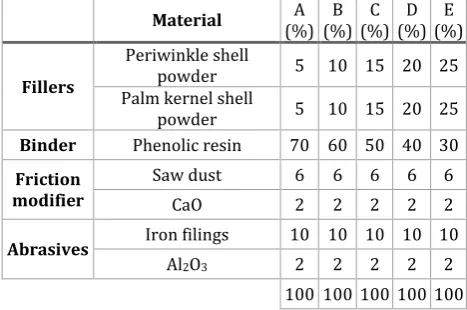
Appropriate amount of phenolic resin and polishing agent measured in weight percentage (Table 1) were thoroughly mixed in a container. Ground periwinkle shell powder, palm kernel shell powder, friction modifier and abrasives all measured in weight percentage (Table 1) were thoroughly mixed homogenously and then transferred to a rectangular steel open mold of dimensions 120×60×7 mm. A counter mold (lid) was placed unto the open mold to allow impregnation of the binder into the fillers and other additives (friction modifiers and abrasives). The mold setup was then placed in between the platens of a compressive press and compressed to a pressure of 100 MPa at a temperature of 140 °C for five minutes. The composite sample was thereafter removed and cured in an oven at a temperature of 120 °C for eight (8) hours. The process was carried out for various weights of the periwinkle, palm kernel,
phenolic resin and constant additives as shown in Table 1.
Table 1. Composition of the composite brake pad for the various samples A to E.
Material (%) A (%) B (%) C (%) D (%) E
Fillers
Periwinkle shell
powder 5 10 15 20 25
Palm kernel shell
powder 5 10 15 20 25
Binder Phenolic resin 70 60 50 40 30
Friction modifier
Saw dust 6 6 6 6 6
CaO 2 2 2 2 2
Abrasives Iron filings 10 10 10 10 10
Al2O3 2 2 2 2 2
100 100 100 100 100
2.2 Experimental Design
The design was conducted using Design Expert version software [13]. The factors or design input variables are (in weight percentage): periwinkle, palm kernel, phenolic resin and additives in accordance with a similar mixture design as employed by Dan-asabe [6] and Elkamel et al. [18]. The objective or response variable of interest is the best sample composition that provides the maximum compressive strength and hardness with minimization of density. Ranges were used to set up a constrained design of a four component mixture design of a user defined and all-constituent-blends [27] as follows:
5 % ≤ 𝑥1≤ 25 % (8)
5 % ≤ 𝑥2≤ 25 % (9)
30 % ≤ 𝑥3≤ 70 % (10)
𝑥4= 20 % (11)
Table 2. Design points of the mixture design at 20 % additives (𝑥4= 20).
Actual Composition
(%) Compressive
strength (MPa)
𝒚(𝒙𝒊): 𝑹𝟏
Hardne ss (HRF)
𝒚(𝒙𝒊): 𝑹𝟑
Density
(g/cm3)
𝒚(𝒙𝒊): 𝑹𝟐
𝒙𝟏 𝒙𝟐 𝒙𝟑
5 5 70 3.154 72.1 0.980
10 10 60 10.808 82.4 1.000
15 15 50 8.192 99.7 1.015
20 20 40 4.346 112.7 1.034
25 25 30 1.769 131.3 1.071
Table 3. Design points in L-pseudo coding at 20 % additives (𝑧4= 0).
L-pseudo coding Compres
sive strength
(MPa)
𝒚(𝒛𝒊): 𝑹𝟏
Hardne ss (HRF)
𝒚(𝒛𝒊): 𝑹𝟑
Density
(g/cm3)
𝒚(𝒛𝒊): 𝑹𝟐
𝒛𝟏 𝒛𝟐 𝒛𝟑
0 0 1 3.154 72.1 0.980
0.125 0.125 0.75 10.808 82.4 1.000
0.25 0.25 0.5 8.192 99.7 1.015
0.375 0.375 0.25 4.346 112.7 1.034
0.5 0.5 0 1.769 131.3 1.071
3. CHARACTERIZATION
3.1 Compressivestrength
This was determined using a Universal Testing Machine (EnerPac P-391) in accordance with ASTM D71372 [28]. Sample specimen dimensions of 20×20×13 mm3 were produced for the test. Compressive load was applied axially onto the specimen till it ruptured. The compressive strength was then determined using Eq. 13.
𝜎 = 𝐹𝐴 (MPa) (13)
where 𝐹 = force, and 𝐴 = cross-sectional area.
3.2 Hardness
The hardness test was carried out using the INDENTEC Universal Hardness Testing Machine with a steel ball as the indentor. The sample was first machined to a size of 30×25×13 mm3 and then grinded [6]. The sample was then inserted beneath the indentor and the hardness value taken at three points on the surface of the sample. The average of the values was then recorded.
3.3 Density
The density of the composite was determined by measuring the volume and mass of the composite sample. The mass was measured with the aid of a digital weighing balance machine [29]. The volume was found using Archimedes’ principle. The density was determined from Eq. 14 as follows:
𝜌 = 𝑚𝑉 (g/cm3) (14)
4. RESULTS AND DISCUSSION
4.1 Statistical analysis, validation and modelling of experimental results
The summary statistics of the models from Design Expert Package are shown in Tables 4, 5 and 6. For the compressive strength (Table 4), the linear, quadratic models are ruled (poor models) due to lower R-squared and adjusted R-squared with negative predicted R-squared [19,30]. The quartic model has R-squared value of 100 % implying accurate prediction of the experimental points but unsuitable for prediction of new points outside of experimental data (zero adjusted R-squared and predicted R-R-squared values). However, the cubic model gives good values of R-squared and adjusted R-R-squared suitable for prediction within experimental point [31,32] and not outside the limit of the experiment (poor predicted R-squared). The statistical significance of the cubic model is fairly good at 13.27 % (greater than the acceptable 5 %) principally as a result of the low predictability of -64 % predicted R-squared. Nevertheless, the cubic model is satisfactory with adequate precision value of 13, greater than the minimum bench mark of 4 [13,33]. Additionally, its value of the standard deviation is small compared to the linear and quadratic models.
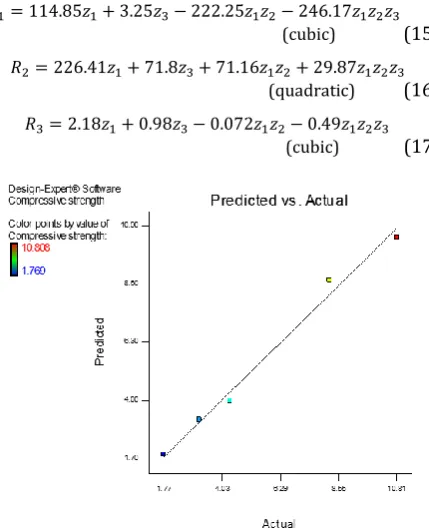
predicts the experimental points but with the cubic having the highest prediction variability of 96.88 %. The cubic model also has a p-value error significant value of 1.1 % and highest adequate precision value of 170.245. Standard deviation of the cubic model is thus the lowest. Moreover, validation of the compressive strength (cubic), hardness (quadratic) and density (cubic) models could also be observed from Figs. 1, 2 and 3 where the slope of the model (predicted response) against experimental points passing through (or closely) all the points and approximating to unity.
The cubic model of compressive strength, quadratic model of the hardness and cubic model of the density are given respectively in L-pseudo coding in Eqs. 15, 16, and 17. The actual formulations (in %) can be converted to the L-pseudo coding using Eq. 12 and respective properties can be predicted using these equations:
𝑅1= 114.85𝑧1+ 3.25𝑧3− 222.25𝑧1𝑧2− 246.17𝑧1𝑧2𝑧3
(cubic) (15)
𝑅2= 226.41𝑧1+ 71.8𝑧3+ 71.16𝑧1𝑧2+ 29.87𝑧1𝑧2𝑧3
(quadratic) (16)
𝑅3= 2.18𝑧1+ 0.98𝑧3− 0.072𝑧1𝑧2− 0.49𝑧1𝑧2𝑧3 (cubic) (17)
Fig. 1. Experimental vs. predicted results of the compressive strength (cubic model).
Table 4. Model summary statistics for compressive strength.
Source deviation Standard p-value Adequate precision R-Squared Adjusted R-Squared Predicted R-Squared
Linear 3.98 0.5164 1.467 0.1520 -0.1307 -2.4060
Quadratic 2.64 0.2480 3.936 0.7516 0.5032 -3.1753
Cubic 0.78 0.1327 12.258 0.9891 0.9564 -0.6418
Quartic - - - 1 - -
Table 5. Model summary statistics for hardness.
Source Standard
deviation p-value
Adequate
precision R-Squared
Adjusted R-Squared
Predicted R-Squared
Linear 2.41 0.0003 39.025 0.9922 0.9896 0.9679
Quadratic 1.82 0.003 42.210 0.9941 0.9779 0.9832
Cubic 2.53 0.0683 26.121 0.9971 0.9885 0.5658
Quartic - - - 1 - -
Table 6. Model summary statistics for density.
Source Standard
deviation p-value
Adequate
precision R-Squared
Adjusted R-Squared
Predicted R-Squared
Linear 0.00072 0.025 18.920 0.9597 0.9568 0.8742
Quadratic 0.00052 0.011 21.615 0.9890 0.9779 0.8094
Cubic 0.00006 0.011 170.245 0.9999 0.9997 0.9688
Quartic - - - 1 - -
Fig. 2. Experimental vs. predicted results of the hardness (quadratic model).
Fig. 3. Experimental vs. predicted results of the density (cubic model).
4.2 Response Optimization
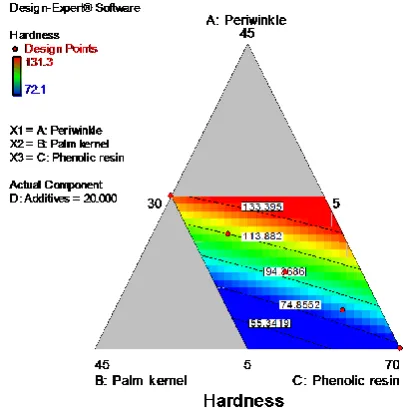
The objective of a brake pad material is to maximize the compressive strength and hardness value and minimize the density [33]. The criteria for optimization are given in Table 7. The optimized model compositions plots of the compressive strength, hardness and density are respectively shown in Figs. 4, 5 and 6. The result of Figure 4 showed that the compressive strength was maximized (red graduated colour) at the percentage range for the respective periwinkle and palm kernel fillers of 8 – 30 % and at higher percentage of phenolic resin (40 – 68 %). Figure 5 showed that the hardness value increases as the percentage of the periwinkle and palm kernel increases and at lower percentage of the phenolic resin. Figure 6 showed that the density increases
as the percentage of the periwinkle and palm kernel increases and at lower percentage of the phenolic resin. Conversely, the density was minimized at lower percentages of the periwinkle and palm kernel shell powders and at higher percentage of the phenolic resin.
Table 7. Optimisation criteria. Material property Objective criteria
Periwinkle (%) Within range 5 to 25
Palm kernel (%) Within range 5 to 25
Phenolic resin (%) Within range 30 to 70
Additive (%) Constant at 20
Compressive
strength (MPa) Maximise within range 4.65 to 10
Hardness (HRF) Maximise within range 72.1 to 131.3
Density (g/cm3) Minimise within range 0.98 to 1
Fig. 4. Composition plot of the compressive strength.
Table 8. Optimization result.
Periwinkle (%) Palm kernel (%) Phenolic resin (%) Compressive strength (MPa) Hardnes (HRF) Density (g/cm3)
10.02 10.777 59.202 10.443 83.265 0.98
10.445 11.277 58.278 10.411 83.485 0.98
10.743 11.629 57.628 10.353 83.758 0.98
Fig. 6. Composition plot of the density.
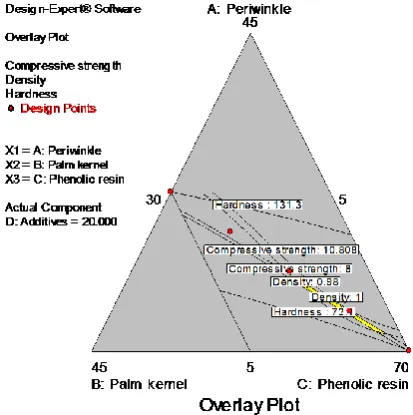
Fog. 7. Optimised overlay of formulations.
The result of the optimization was shown in Table 8 depicting three optimized formulation for the respective compressive strength, hardness and density. Either of the optimized formulations provides an optimum formulations since the response maximization of strength and minimization of density are approximately the same. The criteria of Table 7 was used to provide the overlay plot of Fig. 7 of the optimized region (shaded) of the compressive
strength, hardness and density superimposed on one another. Any point within the shaded region is a desirable likelihood of the optimum formulation [33]. However, formulation with 10.02, 10.78, 59.20 and 20 % additives was selected the optimum best due to its higher desirability value of 0.894 as compared with 0.889 and 0.879 for the other formulation. This formulation corresponds to 10.44 MPa, 83.265HRF and 0.98 g/cm3 of the compressive strength, hardness and density respectively.
Additionally, the percentage water absorption after 3 number of days was determined as 0.49, 1.24, 1.14, 1.11 and 0.59 % for samples A, B, C, D and E respectively. The optimized sample is close to sample B (of 1.24 % water absorption). This can be used to infer a very low (negligible) porosity of the composites [34-36].
5. CONCLUSION
Results of the statistical modeling showed that cubic model suited well with the experimental result of the compressive strength and density while the hardness fitted well with the quadratic model. The compressive strength is useful in predicting experimental response and less meaningful in predicting new response giving significance error of 13.37 % (p-value). However, the hardness and density models are useful in predicting new formulations with prediction accuracy of 98.32 and 96.88 %. Validity of the models were confirmed using p-value, adequate precision and graphical plots of experimental and model values with slope approximating to unity. The optimization of the formulations was determined within the region of sample B.
RECOMENDATION
REFERENCES
[1] B. Dan-asabe, P.B. Madakson, J. Manji, Material Selection and Production of a Cold-Worked Composite Brake Pad, World Journal of Engineering and Pure and Applied Sci., vol. 2, no. 3, pp. 92-97, 2012.
[2] P.J. Blau, Compositions, Functions, and Testing of Friction Brake Materials and Their Additives,Oak Ridge National Laboratory, 2001.
[3] G. Nicholson, Facts About Friction, Gedoran, Winchester: P&W Price Enterprises, 1995. [4] R.T. Spurr, Fillers in Friction Materials, Wear,
vol. 22, iss. 3, pp. 367-409, 1972, doi: 10.1016/0043-1648(72)90395-X
[5] L. Gudmand-Hoyer, T.G. Bach, M. Per, Tribological properties of automotive disc brakes with solid, Wear, vol. 232, iss. 2, pp. 168-175, 1999, doi: 10.1016/S0043-1648(99)00142-8
[6] B. Dan-asabe, Development of a Doum Palm Leaves/Banana Stem-Kankara Clay Hybrid Particulate Reinforced PVC Composite for Piping Applications, PhD thesis, Department of Mechanical Engineering, Ahmadu Bello University, Zaria, 2017.
[7] A.I. Olabisi, A.N. Adam, O.M. Okechukwu, Development and Assessment of Composite Brake Pad Using Pulverized Cocoa Beans Shells Filler, International Journal of Materials Science and Applications, vol. 5, iss. 2, pp. 66-78, 2016. [8] N.A. Ademoh, Development and Evaluation of
Maize Husks (Asbestos-Free) Based Brake Pad, Industrial Engineering Letters, vol. 5, no. 2, pp. 67-80, 2015.
[9] V. Thiyagarajan, K. Kalaichelvan, R. Vijay, D.L., Singaravelu, Influence of thermal conductivity and thermal stability on the fade and recovery characteristics of non‑asbestos semi‑metallic disc brake pad, Journal of Brazillian Society Mechanical Science Engineering, vol. 38, iss. 4, pp. 1207-1219, 2016, doi: 10.1007/s40430-015-0448-8
[10] W.G. Oehlert, A First Course in Design and Analysis of Experiments, Library of Congress Cataloging-in-Publication Data, 2010.
[11] A.W. Shewhart, S.S. Wilks, Experiments with Mixtures -Designs, Models, and the Analysis of Mixture Data, New York: John Wiley & Sons, Inc., 2002.
[12] R.U. Owolabi, M.A. Usman, A.J. Kehinde, Modelling and optimization of process variables for the solution polymerization of styrene using response surface methodology, Journal of King Saud University - Engineering Sciences, vol. 30, iss. 1, 2018, doi: 10.1016/j.jksues.2015.12.005
[13] Stat-Ease, Design-Expert® Software Version 10 Free Trial, available at https://www.statease.com/software/dx10-trial.html, accessed: 20.06.2017
[14] J.B. Wiley, D. Ragavarao, P. Chitturi, Choice-Based Conjoint Analysis Models and Designs, New York: CRC Taylor & Francis Group, 2010, doi: 10.1201/9781420099973
[15] B. Dan-asabe, S.A. Yaro, D.S. Yawas, S.Y. Aku, Statistical Modeling and Optimization of the Flexural Strength, Water Absorption and Density of a Doum Palm-Kankara Clay Filler Hybrid Composite, Journal of King Saud University - Engineering Sciences, In Press, 2017, doi: 10.1016/j.jksues.2017.11.003
[16] J.O. Agunsoye, S. A. Bello, L.O. Kolawole, Experimental Investigation and Theoretical Prediction of Tensile Properties of Delonix regia Seed Particle Reinforced Polymeric Composites, Journal of King Saud University - Engineering Sciences, In Press, 2017, doi: 10.1016/j.jksues.2017.01.005
[17] C.S. Javier, Selecting the Slack Variable in Mixture Experiment, Selección de la variable de holgura en experimentos para mezclas, vol. 16, iss. 4, pp. 613-623, 2015, doi: 10.1016/j.riit.2015.09.013
[18] A. Elkamel, R. Fatoni, L. Simon, OptimalProduct Design of Wheat Straw Polypropylene Composites, in 3rd International Conference on Industrial Engineering and Operations Management, 3-6, July, 2012, IEOM 2012, Istanbul, Turkey, pp. 2116-2126.
[19] R. Fatoni, Product Design of Wheat Straw Polypropylene Composite, PhD thesis, University of Waterloo, Ontario, 2012.
[20] W.S. Chow, Y.P. Yap, Optimization of process variables on flexural properties of epoxy/organo-montmorillonite nanocomposite by response surface methodology, eXPRESS Polymer Letters, vol. 2, no. 1, pp. 2–11, 2008, doi: 10.3144/expresspolymlett.2008.2
[21] S.O. Obam, The accuracy of Scheffe’s third degree over second-degree, optimization regression polynomials, Nigerian Journal of Technology, vol. 25, no. 2, pp. 1-10, 2006.
[22] F.M. Kpodo, E.O. Afoakwa, B.B. Amoa, F.K.S. Saalia, A.S. Budu, Application of multiple component constraint mixture design for studying the effect of ingredient variations on the chemical composition and physico-chemical properties of soy-peanut-cow milk, International Food Research Journal, vol. 20, iss. 2, pp. 811-818, 2013.
sapodilla juice using response surface methodology, Journal of Food Engineering, vol. 74, iss. 3, pp. 352-358, 2006, doi: 10.1016/j.jfoodeng.2005.03.005
[24] A.J. Trevisan, J.A. Areas, Development of corn and flaxseed snacks with high-fibre content using response surface methodology (RSM), International Journal of Food Sciences and Nutrition, vol. 63, iss. 3, pp. 362-367, 2012, doi: 10.3109/09637486.2011.629179
[25] F.Z. Arrakhiz, M.E. Achaby, C.A. Kakou, S. Vaudreuil, K. Benmoussa, R. Bouhfid, Mechanical properties of high density polyethylene reinforced with chemically modified Coir fibers: impact of chemical treatments, Material Design, vol. 37, pp. 379-383, 2012, doi: 10.1016/j.matdes.2012.01.020
[26] H. Essabir, E. Hilali, A. Elgharad, H.E. Minor, A. Imad, A. Elamraoui, Mechanical and thermal properties of bio-composites based on polypropylene reinforced with Nut–shells of Argan particles, Mater Des., vol. 49, pp. 442-448, 2013, doi: 10.1016/j.matdes.2013.01.025
[27] J. Cornell, Experiments with Mixtures; Designs, Models, and the Analysis of Mixture Data, New York: Wiley Inter-science, 2002.
[28] ASTM D7137, Standard Test Method for Compressive Residual Strength Properties of Damaged Polymer Matrix Composite Plates, 2012. [29] ASTM D792, Standard Test Methods for Density
and Specific Gravity (Relative Density) of Plastics by Displacement, 2013.
[30] H. Le Man, S.K. Behera, H.S. Park, Optimization of operational parameters for ethanol production
from Korean food waste leachate, Int. J. Environ. Sci. Technol., vol. 7, iss. 1, pp. 157-164, 2010. [31] A. Koocheki, A.R. Taherian, S. Razavi, A.
Bostan. Response surface methodology for optimization of extraction yield, viscosity, hue and emulsion stability of mucilage extracted from Lepidium perfoliatum seeds, Food Hydrocolloids, vol. 23, iss. 8, pp. 2369-2379, 2009, doi: 10.1016/j.foodhyd.2009.06.014 [32] A. Rai, B. Mohanty, R. Bhargava, Supercritical
extraction of sunflower oil: a central composite design for extraction variables, Food Chemestry, vol. 192, pp. 647-659, 2016, doi: 10.1016/j.foodchem.2015.07.070
[33] B. Dan-asabe, A.A. Galadi, Mathematical Modeling of the Flexural Strength, Impact Energy and Water Absorption of a Pineapple Fibre-HDPE Composite using RSM Technique, Journal of Polymer & Composites, vol. 5, no. 2, pp. 42-49, 2017.
[34] F.R. Gibson, Principle of composite material mechanic, Florida: US, CRC Press, 3rd edition, 2011. [35] A.F. Angelin, R.C.C. Lintz, L.A. Gachet-Barbosa,
W.R. Osório, The effects of porosity on mechanical behavior and water absorption of an environmentally friendly cement mortar with recycled rubber, Construction and Building Materials, vol. 151, pp. 534-545, 2017, doi: 10.1016/j.conbuildmat.2017.06.061