Validity and Reliability of the Utilitarian Value, Hedonic Value, Brand
Satisfaction, Emotional Attachment, Brand Trust and Mobile Phone
Brand Loyalty Scales
Linda Seduram1, Selvan Perumal2 and Hasnizam Bin Shaari3
1, 2, 3 School of Business Management, University Utara Malaysia, 06010 Sintok, Kedah, Malaysia.
Corresponding email: [email protected]
Article Information
Abstract
Keywords
Utilitarian and Hedonic value, Brand Satisfaction,
Emotional Attachment, Brand Trust,
Mobile phone brand loyalty,
The main purpose of this study is to investigate reliability and validity of small data pertaining to link of utilitarian value, hedonic value, brand satisfaction, emotional attachment, and brand trust on mobile phone brand loyalty in Malaysia. Hence, the goodness of measures was examined via academicians and data analysis with SPSS20. Overall, the values of alpha coefficients were above 0.90. The result of exploratory factor analysis (EFA) revealed that all factors loaded more than 0.75. The findings of this study showed that all the measures were reliable and valid. Therefore, the questionnaire developed was appropriate to be used in investigating the effects of utilitarian value, hedonic value, brand satisfaction, emotional attachment and brand trust on mobile phone brand loyalty in Malaysia. Thus, the identification and development of improved instruments that reflect Malaysian customers’ evaluation upon mobile phone brand loyalty can be a useful tool for future academicians or researchers in the area of mobile phone brand loyalty topic, since there is lack of studies that tackle the issue of brand loyalty in mobile phone context.
INTRODUCTION
to sustain their market shares in this highly competitive market (Euromonitor International, 2016). This clearly shows that, mobile phone industry in Malaysia exhibits high levels of brand switching among customers.
Mutually, scholars and practitioners admit that the best core marketing strategy to retain the existing customer is via strengthening customer’s brand loyalty (Lam & Shankar, 2014; Petzer, Mostert, Kruger & Kuhn 2014; Lee, Moon, Kim & Yi, 2015). By creating and maintaining customer brand loyalty, a company develops long term, mutually beneficial relationship with the customers (Pan, Sheng and Xie, 2012). Hence, it is fair to say that customer brand loyalty is the keys to a mobile phone manufacture’s survival in this fiercely competitive market. Despite the importance of mobile phone brand loyalty, researchers have paid scant attention to understand customers’ brand loyalty regarding smartphones (Lin, Huang & Hsu, 2015). Correspondingly, study by Lam and Shankar (2014), pointed out that prior research focusses on only one or two key drivers of mobile phone brand loyalty (e.g. brand trust and brand satisfaction) in isolation rather than offering a comprehensive set of drivers in an integrated manner. Researchers have acknowledged that perceive value (utilitarian value and hedonic value), brand satisfaction, emotional attachment, brand trust are key drivers of brand loyalty but there were very limited empirical study on the basis of the integration of these key drivers on brand loyalty, in particular, in context of Malaysia mobile phone industry. This sparks the researcher’s interest to address this insufficiency and pursued to bridge the existing research gap
Review of Literature
Primarily, utilitarian value refers to instrumental, functional and practical usefulness or benefits derived from a product (Voss, Spangenberg & Grohmanm, 2003). Hedonic value refers to aesthetics, experiential, or sensory related benefits from using a particular brand mobile phone (Voss et al, 2003). In mobile phone context, the utilitarian value and hedonic value are important factors when customers select the mobile brand (Sheng & Teo, 2012). In fact, recent studies (e.g. Lam & Shankar, 2014; Dastan & Gecti, 2014) indicated that customers consider utilitarian value and hedonic value when they purchase advanced technology product such as smartphone. In addition, numerous studies showed substantial association between utilitarian value, hedonic value and loyalty (Chai, Malhotra & Alpert, 2015; Chang, 2013; Hu & Chuang, 2012).
Brand satisfaction is customer’s overall evaluation of whether a brand meets their performance expectations or fulfills usage needs (Grace & O’cass, 2005). In the mobile phone context, customers are likely to continue using the phone when they are satisfied (Lee et al., 2015; Wahid, Kassim, Igau & Harun, 2014). Because customers use mobile devices frequently, their satisfaction with the brand is likely to affect their brand repurchase. The linkage between brand satisfaction and brand loyalty has been well established and is a matter of extensive research (Lam & Shankar, 2014; Sahin, Zehir & Kitapci, 2011; Lin et al., 2015).
Emotional attachment is self-implicated emotion-laden bond between the customer and a brand (Thomson, MacInnis & Park, 2005; Lam & Shankar, 2014). In context of mobile phone, while the smartphone industry has experienced tremendous growth, the emotional attachment between smartphones owners and their phones are also becoming stronger (Dastan & Gecti, 2014). Also, Lam and Shankar (2014) explained that customers can become emotionally attached to mobile device because customers extremely rely on their smartphones to retrieve information by a simple browse and click to access their smartphone as they travel, commute and when relax at home. Previous research also have recognized the relationship between emotional attachment and brand loyalty (Jang, Kim & Lee, 2015; Theng So, Grant Parsons & Yap, 2013; Hwang & Kandampully, 2012).
Brand trust has been defined as the willingness of a regular customer to rely on the capability of a brand to perform its promised function (Chaudhuri & Holbrook, 2001). In mobile phone context, mobile devices need to work effectively at all times, store and transmit the right information, so uncertainty in mobile device performance can be high (Lam & Shankar, 2014). According to Chaudhuri and Holbrook (2001), consumer’s trust upon a brand reduces consumer’s uncertainty. Therefore, brand trust plays a very important role in mobile setting. Moreover, previous studies have extensively examined the link between brand trust and brand loyalty and the relationship has been well established (Lee et al., 2015; Ok, Choi & Hyun, 2011; Laroche, Habibi, Richard & Sankaranarayanan, 2012).
sensitive (Delgado-Ballester & Munuera-Aleman, 2001). In fact, they serve as powerful ambassadors for the brand (Hess, Story & Danes, 2011), and they are less likely to be tempted by the competitors’ marketing promotions or switch to competitors (Wang & Li, 2012). Further, brand loyalty can increase customer’s spending towards a specific brand and reduced marketing costs of a company (Gummesson, 2002). Hence, the importance of loyalty has been widely recognized in the marketing literature and brand loyalty has been considered as a key for a business’s success since long time ago. Therefore, understanding the development or determinants of brand loyalty is of extremely important for highly competitive industry such as mobile phone industry.
Purpose of Study
The main aim of this study is to ensure the reliability and validity of the constructs (utilitarian value, hedonic value, brand satisfaction, emotional attachment, brand trust and mobile phone brand loyalty) in this study. According to Sekaran (2003), pre-test is highly recommended for the subjective assessment to be made on the survey instrument to ensure that the questions are understandable and appropriate items are used in measuring the constructs. Hence, the researcher consulted few academicians from marketing field (face and content validity) and small number of data were analyzed (exploratory factor analysis and reliability analysis) to ensure the goodness of the measures.
MATERIALS AND METHODS Procedure and Participant
A pilot study is conducted mainly to assess the validity and reliability of the instrument. A pilot study basically suggests going for a small scale study for the trial purpose before conducting the full-fledged study (Gay, Mills, & Airasian, 2006). According to Malhotra (2008), the sample size for pilot study is suggested to be comparatively smaller which could range from 15-30 respondents. However, a total of 60 respondents were targeted for the purpose of this study. The pilot study was carried out in Klang Valley, Malaysia. Klang Valley was chosen in this study because Klang Valley registered 30.2% mobile phone users in 2014 which is more than a quarter of Malaysia’s total mobile phone users (Malaysia Communication and Multimedia Commission, 2015). The data were collected through mall intercept at Midvalley Megamall which is one of the largest shopping mall in Klang Valley (exhibiting high traffic flow and shopper demographic diversity). Data collection via mall-intercept was selected due to its ability to access potential respondents over a short period of time and enable respondents to seek clarification if needed which will help to improvise the format of the instrument. Thus, a total of 60 completed surveys were obtained, however 4 cases were eliminated due to incomplete and unusable responses. Finally, a total of 56 responses being used for the data analysis using SPSS version 20. In addition, the assessments and recommendations of Universiti Utara Malaysia’s (UUM) marketing Professors added the face and content validity of the instrument. It took approximately 1 month to complete the entire process.
Instrumentation and Measurement
RESULT
Profile of Respondent
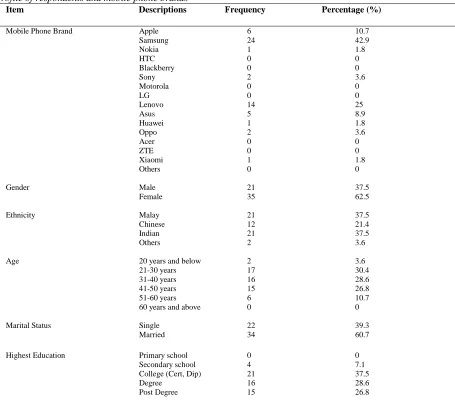
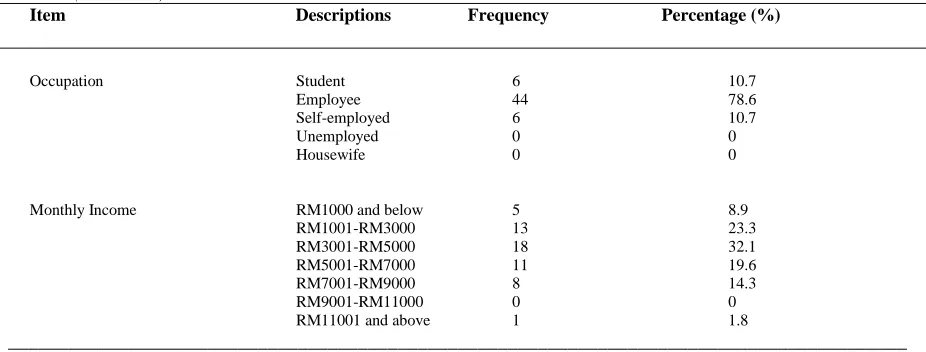
For the respondents’ demographic characteristics, the majority of respondents were using Samsung brand mobile phone (42.95%), followed by Lenovo (25%), Apple (10.7%), Asus (8.9), Oppo (3.6%), Sony (3.6), Nokia (1.8), Huawei (1.8%) and Xiaomi (1.8%). Of the 56 respondents, 37.5% were male and 62.5% were female. Among the respondents who participated in this survey, 3.6% were below than 20 years of age, 30.4% were between 21 and 30 years of age, 28.6% were between 31 and 40 years of age, 26.8% were between 41 and 50 years of age and finally 10.7% were between 51 and 60 years of age. As for ethnic background, about 37.5% of the respondents were Malays, 37.5% Indians, 21.4% Chinese and 3.6% comprise of other races mainly compose of Kadazan and Eurasian. A majority 60.7% of the respondents surveyed were married and 39.3% of the respondents were single. The education level of respondents were varied with 37.5% of the respondents were diploma and certificate holders, 28.6% were having degree, 26.8% were masters and PhD holders, and 7.1% of the respondents were only secondary school leavers. Most of the respondents were employed (78.6%), followed by self-employed (10.7%) and student (10.7%). As for monthly income, 32.1% of the respondents indicated their household income to be from RM3001 till RM5000, 23.2% (RM1001-RM3000), 19.6% (RM5001-RM7000), 14.3% (RM7001-RM9000), 8.9% earning less than RM1000 and 1.8% reported over RM11001. The detailed results of demographic profile illustrated in Table 1.
Table 1:
Profile of respondents and mobile phone brands
Item Descriptions Frequency Percentage (%)
Mobile Phone Brand Apple 6 10.7
Samsung 24 42.9
Nokia 1 1.8
HTC 0 0
Blackberry 0 0
Sony 2 3.6
Motorola 0 0
LG 0 0
Lenovo 14 25
Asus 5 8.9
Huawei 1 1.8
Oppo 2 3.6
Acer 0 0
ZTE 0 0
Xiaomi 1 1.8
Others 0 0
Gender Male 21 37.5
Female 35 62.5
Ethnicity Malay 21 37.5
Chinese 12 21.4
Indian 21 37.5
Others 2 3.6
Age 20 years and below 2 3.6
21-30 years 17 30.4
31-40 years 16 28.6
41-50 years 15 26.8
51-60 years 6 10.7
60 years and above 0 0
Marital Status Single 22 39.3
Married 34 60.7
Highest Education Primary school 0 0
Secondary school 4 7.1
College (Cert, Dip) 21 37.5
Degree 16 28.6
Table 1 (continued)
Item Descriptions Frequency Percentage (%)
Occupation Student 6 10.7
Employee 44 78.6
Self-employed 6 10.7
Unemployed 0 0
Housewife 0 0
Monthly Income RM1000 and below 5 8.9
RM1001-RM3000 13 23.3
RM3001-RM5000 18 32.1
RM5001-RM7000 11 19.6
RM7001-RM9000 8 14.3
RM9001-RM11000 0 0
RM11001 and above 1 1.8
__________________________________________________________________________________________
Face and Content validity
Content validity is mainly conducted to ensure how well the domain content of a construct is captured by its items (Hair, Black, Babin & Anderson, 2010). To achieve content validity, items from previous studies published in leading academic journals were adapted (Saunders, Lewis, & Thornhill, 2007). In addition, content and face validity were conducted in this study by seeking opinions of marketing experts from UUM about the measures’ representativeness and appropriateness as suggested by Sekaran (2003). They were also requested to check whether there is any repetition, or there is any over or under representation of measures. The experts’ suggestions and opinions helped the researcher to improvise the instrument that utilized for the pilot study.
Construct Validity
Content validity by asking a panel or group of experts is mostly a judgmental assessment of the items, constructs, and instrument as a whole which have been developed and based on extensive literature. On the other hand, construct validity is performed to ascertain that a test is evaluating the construct it was actually supposed to (Brown, 1996). Moreover, construct validity is said to be necessary for ensuring overall validity. As such, in order to evaluate the construct validity, exploratory factor analysis was conducted in this study using principal components method in the SPSS 20. Factor analysis aims to identify the items explaining same construct.
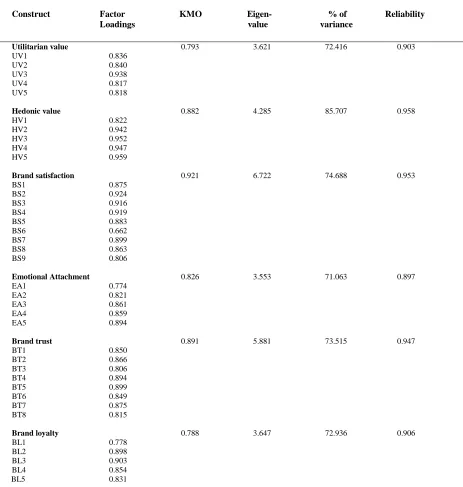
The KMO (Kaiser-Mayer-Olkin) index, in particular, is recommended when the cases to variable ratio are less than 1:5 (Williams, Brown & Onsman, 2010). Therefore, in this study KMO measure of sampling adequacy was examined to ascertain the suitability of the factorability aspect of factor analysis. The KMO index ranges from 0 to 1, with 0.50 and above are considered suitable for factor analysis. In this study, the KMO ranged from 0.788 to 0.921 exhibiting pertinence of factor analysis in this study. Then, the factor loadings of each item were checked to ensure that all values are more than 0.50 as suggested by Hair et al., (2010). In this study, factor loadings of all items are ranged from 0.662 to 0.959. Furthermore, statistician view variables that have Eigen values above 1.00 are consider worthy of investigation. The condition was fulfilled where the eigenvalues were over 3. Finally, the percentage of variance in this study ranged from 71.063 to 85.707 which shows that the constructs reasonably attempt to explain the proposed research model. The detailed results of factor analysis are in Table 2.
Reliability Analysis (Internal Consistency)
Table 2:
Result of Exploratory Factor Analysis
Construct Factor KMO Eigen- % of Reliability Loadings value variance
Utilitarian value 0.793 3.621 72.416 0.903
UV1 0.836
UV2 0.840
UV3 0.938
UV4 0.817
UV5 0.818
Hedonic value 0.882 4.285 85.707 0.958
HV1 0.822
HV2 0.942
HV3 0.952
HV4 0.947
HV5 0.959
Brand satisfaction 0.921 6.722 74.688 0.953
BS1 0.875
BS2 0.924
BS3 0.916
BS4 0.919
BS5 0.883
BS6 0.662
BS7 0.899
BS8 0.863
BS9 0.806
Emotional Attachment 0.826 3.553 71.063 0.897
EA1 0.774
EA2 0.821
EA3 0.861
EA4 0.859
EA5 0.894
Brand trust 0.891 5.881 73.515 0.947
BT1 0.850
BT2 0.866
BT3 0.806
BT4 0.894
BT5 0.899
BT6 0.849
BT7 0.875
BT8 0.815
Brand loyalty 0.788 3.647 72.936 0.906
BL1 0.778
BL2 0.898
BL3 0.903
BL4 0.854
BL5 0.831
CONCLUSION
Appendix A. Questionnaire
Factors
Utilitarian value
This brand of mobile phone is… UV1 ineffective-effective UV2 not helpful-helpful UV3 not functional-functional UV4 not necessary-necessary UV5 impractical-practical
Hedonic value
This brand of mobile phone is… HV1 not fun-fun
HV2 dull-exciting
HV3 not delightful-delightful HV4 not thrilling-thrilling HV5 unejoyable-enjoyable
Brand satisfaction
BS1 I am very satisfied with the service provided by this brand. BS2 This brand does a good job of satisfying my needs. BS3 The phones provided by this brand are very satisfactory.
BS4 I believe that using this brand is usually a very satisfying experience. BS5 I made the right decision when I decided to use this brand.
BS6 I am addicted to this brand in some way. BS7 I am very satisfied with this brand.
BS8 This brand fulfils my expectations completely. BS9 I have positive attitude towards this brand.
Emotional Attachment
EA1 I feel emotionally attached to the brand that I am currently using. EA2 This brand means a lot to me personally.
EA3 Even if it were to my advantage to switch to another brand, I would not feel good about switching to that brand.
EA4 I identify myself with this brand.
EA5 I feel a special bond between myself and this brand.
Brand trust
BT1 This brand meets my expectations. BT2 I feel confidence in this brand. BT3 This brand never disappoints me. BT4 This brand guarantees satisfaction.
BT5 This brand would be honest and sincere in addressing my concerns. BT6 I could rely on this brand to solve any problem with the phone. BT7 This brand would make any effort to satisfy me in case of a problem.
BT8 This brand would compensate me in some way for the problem with the phone.
Mobile phone brand loyalty
BL1 I am a loyal customer of this brand. BL2 I will buy this brand in my next purchase.
BL3 I consider my current brand as a first choice for mobile phone brands. BL4 I have said positive things about this brand to other people.
REFERENCES
Aggarwal, R. (2014). Consumer Loyalty Behaviour : What is Done and What Else to be Done. SOP Transsaction on Marketing Research, 1(1), 1–22.
Brown, J. D. (1996). Testing in language programs. Upper Saddle River, NJ: Prentice Hall Regents.
Castro, K., & Pitta, D. a. (2012). Relationship development for services: an empirical test. Journal of Product & Brand Management, 21(2), 126–131.
Chai, J. C. Y., Malhotra, N. K., & Alpert, F. (2015). A two-dimensional model of trust–value– loyalty in service relationships. Journal of Retailing and Consumer Services, 26, 23–31.
Chang, C. C. (2013). Examining users??? intention to continue using social network games: A flow experience perspective. Telematics and Informatics, 30(4), 311–321.
Chaudhuri, A., & Holbrook, M. B. (2001). The Chain of Effects from Brand Trust and Brand Affect to Brand Performance: The Role of Brand Loyalty. Journal of Marketing, 65(2), 81–93.
Cooper, D. R., & Schindler, P. S. (2006). Business research methods with CD. (9th edition). McGraw-Hill.
Dastan, I., & Gecti, F. (2014). Relationships among Utilitarian and Hedonic Values, Brand Affect and Brand Trust in the Smartphone Industry. Journal of Management Research, 6(2), 124.
Delgado‐Ballester, E., & Luis Munuera‐Alemán, J. (2001). Brand trust in the context of consumer loyalty. European Journal of Marketing, 35(11/12), 1238-1258.
Euromonitor International (2014). Passport: Mobile Phones in Malaysia. Available from http://www.euromonitor.com/mobile-phones-in-malaysia/report
Euromonitor International (2016). Passport: Mobile Phones in Malaysia. Available from http://www.euromonitor.com/mobile-phones-in-malaysia/report.
Finstad, K. (2010). Response Interpolation and Scale Sensitivity: Evidence against five point likert Scale. Journal of Usability Studies, 5 (3), 104-110.
Gay, L. R., Mills, G. E., & Airasian, P. (2006). Educational research: competencies for analysis and applications (8th ed.). Uppersaddle River, New Jersey: Pearson Education International.
Grace, D. & O'Cass, A. (2005). Examining the effects of service brand communications on brand evaluation. Journal Of Product & Brand Management, 14(2), 106-116.
Gummesson, E. (2002). Relationship Marketing in the New Economy. Journal of Relationship Marketing, 1(1), 37-57.
Hair, J. F., Jr., Black, W. C., Babin, B. J., Anderson, R. E., & Tatham, R. L. (2010). Multivariate data analysis (7th ed.) NJ: Pearson Prentice Hall.
Hess, J., Story, J., & Danes, J. (2011). A three‐stage model of consumer relationship investment. Journal of Product & Brand Management, 20(1), 14-26.
Hu, F. L., & Chuang, C. (2012). A study of the relationship between value perception and loyalty Intention toward an E-retailer website. Journal of Internet Banking and Commerce, 17(1), 1-18.
Hwang, J., & Kandampully, J. (2012). The role of emotional aspects in younger consumer-brand relationships. Journal of Product & Brand Management, 21(2), 98–108.
Jang, Y. J., Kim, W. G., & Lee, H. Y. (2015). Coffee shop consumers’ emotional attachment and loyalty to green stores: The moderating role of green consciousness. International Journal of Hospitality Management, 44, 146–156.
Karjaluoto, H., Jayawardhena, C., Leppäniemi, M., & Pihlström, M. (2012). How value and trust influence loyalty in wireless telecommunications industry. Telecommunications Policy, 36(8), 636–649.
Lam, S. Y., & Shankar, V. (2014). Asymmetries in the effects of drivers of brand loyalty between early and late adopters and across technology generations. Journal of Interactive Marketing, 28(1), 26–42.
Laroche, M., Habibi, M.R., Richard, M., Sankaranarayanan, R. (2012). The effects of social media based brand communitties on brand community markers, value creation practices, brand trust and brand loyalty. Computers in Human Behaviour, 28, 1755-1767.
Lee, D., Moon, J., Kim, Y. J., & Yi, M. Y. (2014). Antecedents and consequences of mobile phone usability: Linking simplicity and interactivity to satisfaction, trust, and brand loyalty. Information & Management. Lin, T.-C., Huang, S.-L., & Hsu, C.-J. (2015). A dual-factor model of loyalty to IT product – The case of
smartphones. International Journal of Information Management, 35(2), 215–228.
Malaysian Communications and Multimedia Commission. (2015). Communications & Multimedia Pocket Book of
Statistics Q1. Retrieved from
http://www.skmm.gov.my/skmmgovmy/media/General/pdf/MCMC-Q1-2015_PocketBook.pdf
Ok, C., Choi, Y. G., & Hyun, S. S. (2011). Roles of Brand Value Perception in the Development of Brand Credibility and Brand Prestige. 2011 ICHRIE Conference.
Oliver, R. L. (1997). Customer satisfaction: A behavioural perspective on the consumer. New York: McGraw-Hill.
Pan, Y., Sheng, S., & Xie, F. T. (2012). Antecedents of customer loyalty: An empirical synthesis and reexamination. Journal of Retailing and Consumer Services, 19(1), 150–158.
Petzer, D., Mostert, P., Kruger, L., & Kuhn, S. (2014). The Dimensions of Brand Romance As Predictors of Brand Loyalty among Cell Phone Users. South African Journal of Economic & Management Sciences, 17(4), 457-470.
Rowinski, D. (2014). Why 2014 is the year of the cheap smartphone. Retrieved April 9, 2015, from http://readwrite.com/2014/03/24/cheap-smartphone-2014.
Şahin, A., Zehir, C., & Kitapçi, H. (2011). The effects of brand experiences, trust and satisfaction on building brand loyalty; an empirical research on global brands. Procedia - Social and Behavioral Sciences, 24, 1288–1301. Saunders, M., Lewis, P. & Thornhill, A. (2007). Research methods for business students (4th edition). London:
Prentice Hall.
Sekaran, U. (2003). Research method for business: a skill building approach (4th ed.). Singapore: John Wiley & Sons.
Sheng, M. L., & Teo, T. S. H. (2012). Product attributes and brand equity in the mobile domain: The mediating role of customer experience. International Journal of Information Management, 32(2), 139–146.
Theng So, J., Grant Parsons, A., & Yap, S. (2013). Corporate branding, emotional attachment and brand loyalty: the case of luxury fashion branding. Journal of Fashion Marketing And Management: An International Journal, 17(4), 403-423.
Thomson, M., MacInnis, D. J., & Whan Park, C. (2005). The Ties That Bind: Measuring the Strength of Consumers’ Emotional Attachments to Brands. Journal of Consumer Psychology, 15(1), 77–91.
Voss, K., Spangenberg, E., & Grohmann, B. (2003). Measuring the Hedonic and Utilitarian Dimensions of Consumer Attitude. Journal of Marketing Research, 40(3), 310-320.
Wahid, A., Kassim, M., Igau, O. a, Harun, A., & Tahajuddin, S. (2014). Mediating Effect of Customer Satisfaction on Perceived Product Quality, Perceived Value, and Their Relation to Brand Loyalty. International Journal of Research in Management & Business Studies, 1(2), 13–18.
Wang, W., & Li, H. (2012). Factors Influencing Mobile Services Adoption: A Brand ‐ Equity. Internet Research, 22(2), 142-179.