_____________________________________________________________________________________________________
*Corresponding author: Email: [email protected];
Optimum Manpower Allocation in Health Care Using
Statistical Process Control
William E. Odinikuku
1*, Jephthah A. Ikimi
1and Ikechukwu P. Onwuamaeze
11
Department of Mechanical Engineering, Petroleum Training Institute, Warri, Nigeria.
Authors’ contributions
This work was carried out in collaboration among all authors. Author WEO designed the study, performed the statistical analysis, wrote the protocol and wrote the first draft of the manuscript. Authors JAI and IPO managed the analyses of the study. All authors read and approved the final manuscript.
Article Information
DOI: 10.9734/JERR/2019/v8i116981
Editor(s):
(1)Dr. Guang Yih Sheu, Associate Professor, Chang-Jung Christian University, Taiwan.
Reviewers:
(1)Zimeras Stelios, University of the Aegean, Greece. (2)Ngoyi k. Zacharie bukonda, Wichita State University, USA. (3)R. Gomathi, Bannari Amman Institute of Technology, India. Complete Peer review History:https://sdiarticle4.com/review-history/52322
Received 14 August 2019 Accepted 23 October 2019 Published 01 November 2019
ABSTRACT
In many countries manpower problems in the field of health care are regular items on the agenda of policy makers. To avoid mismatches between demand of care and supply of care on national and regional levels, manpower planning models and methods are used to determine adequate numbers of medical specialists to fulfill the future demand of care. Inadequate or inefficient allocation of manpower to various departments in an organization or workplace can lead to undesired outcomes which may include: down time, reduced productivity, workers fatigue, increased production costs, etc. As a result of the above stated problem, there is need to devise a statistical model that will ensure optimal allocation of manpower.
In this study, the optimum allocation of two hundred and fifty two general nurses to fifteen wards at a hospital code named WCH located in South-South geopolitical zone, Nigeria was achieved using statistical process control. The study involved the analysis of data obtained from our hub of study for a period of two months. The C-chart was used to check if the process of allocation was in control or not.
The result obtained from the study showed that the manpower allocation process was out of statistical control as the allocation of the children emergency ward was outside the upper control limit of the c-chart plot.
Keywords: Manpower allocation; health care; general nurse; statistical process control; c-chart.
1. INTRODUCTION
Many organizations are faced with problems of poor utilization of human resources due to lack of manpower planning which leads to difficulty in achieving corporate organizational objectives. Manpower planning helps organizations to have accurate estimate of number of employees to accomplish set objectives, reduce waste in employment, eliminate the mistakes involved in staffing and enhance effective utilization of its human resources [1]. Productivity level increases when resources are utilized in the best possible
manner. Statistical process control is a
technology widely used in manufacturing to improve quality of products and productivity of workers [2]. It is is a collection of tools designed to continuously improve process performance and reduce variability. The SPC since its
inception has been widely applied in
manufacturing industries [3]. Recently, it is increasingly being applied to service industries including health care. Examples of notable applications of SPC to health care include that of Benneyan and Lloyd [4], Mohammed [5], Mohammed et al. [6], Diaz and Neuhauser [7], Adab et al. [8], Woodhall [9] among others.
There are different control charts available in the literatures, see Wheeler and Chambers [10], Ryan [11] and Montgomery [12]. Mohammed et al. [13] also provided cases where the four commonly used control charts; c-chart, p-chart,
u-chart and XmR-charts (also known as the individual charts) can be used in health care with detailed examples. In this study, statistical process control was employed to optimally allocate nurses to fifteen wards in a hospital and the c-chart was used to check if the allocation was in control.
2. METHODOLOGY
The data for the study were obtained through personal interviews with the hospital staff and observations at the selected wards used in this study. Fifteen wards at the hospital were studied and information on the total number of patients requiring urgent medical attention as well as the number of nurses allocated to each ward to attend to all the sick patients for a period of two months were obtained. The data gathered from this organization were analyzed using statistical process control (SPC). During data gathering, assurance was given to the organization studied that the data would be kept confidential and
restricted to academic use only. This is to ensure that the correct data was released if at
all.
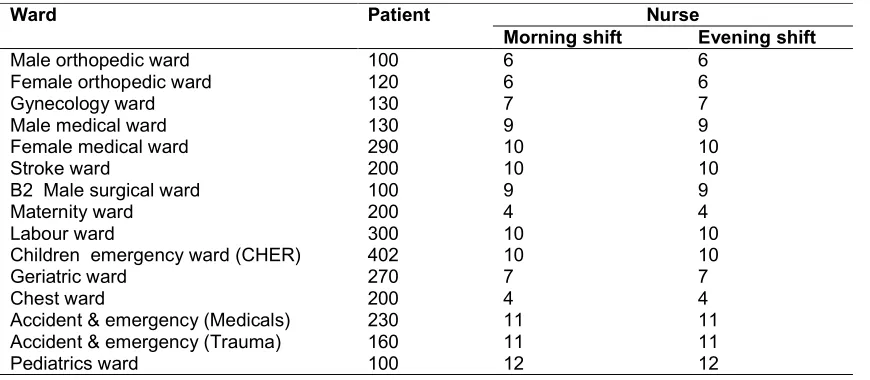
The data obtained from our study is presented in table 1. The table shows the number of sick patients in fifteen wards that need urgent medical attention and the number of available nurses assigned to each ward.
Table 1. Data obtained from WCH
Ward Patient Nurse
Morning shift Evening shift
Male orthopedic ward 100 6 6
Female orthopedic ward 120 6 6
Gynecology ward 130 7 7
Male medical ward 130 9 9
Female medical ward 290 10 10
Stroke ward 200 10 10
B2 Male surgical ward 100 9 9
Maternity ward 200 4 4
Labour ward 300 10 10
Children emergency ward (CHER) 402 10 10
Geriatric ward 270 7 7
Chest ward 200 4 4
Accident & emergency (Medicals) 230 11 11
Accident & emergency (Trauma) 160 11 11
2.1 Method of Data Analysis
The basic model used in this study is the Statistical Process Control (SPC) which involves the use of control charts to study how a process changes over time. Data are plotted in time order. A control chart has a central line for the
average ( ̅ ), an upper line for the upper control
limit ( ) and a lower line for the lower control
limit ( ). These lines are determined from
historical data. By comparing current data to these lines, you can draw conclusions about whether the process variation is consistent (in control) or is unpredictable (out of control, affected special causes of variation). For the purpose of this study, the C-chart was selected because the data to be analyzed are in subgroup which closely follows the Poisson’s distribution. The following equations were used to compute the upper and lower control limits for C-charts:
= + 3√ (1)
= − 3√ (2)
= (3)
Where:
= central line value
= Upper control limit
= lower control limit
The allocation of nurses to each of the fifteen (15) wards is computed using:
=
.
. × . (4)
3. RESULTS AND DISCUSSION
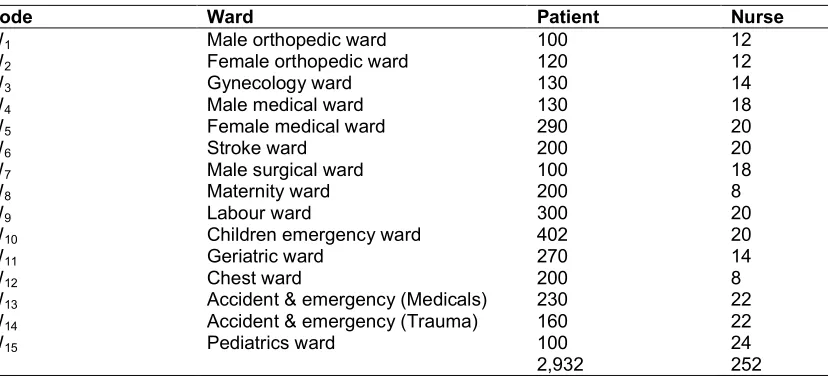
Table 2 shows the total number of two hundred and fifty two (252) nurses available to attend to two thousand, nine hundred and thirty two (2,932) sick persons that need urgent medical attention in fifteen wards at the hospital studied. The total number of nurses was obtained by adding up the number of nurses in the fifteen wards.
3.1 Allocation of Nurses
Total number of nurses available to attend to sick persons in fifteen wards at the hospital = 252.
From equation (4),
=
× .
1 = × 252 = 8.59 ≅ 9 (5)
2 = × 252 = 10.23 ≅ 11 (6)
3 = × 252 = 11.17 ≅ 11 (7)
4 = × 252 = 11.17 ≅ 11 (8)
5 = × 252 = 24.92 ≅ 25 (9)
Table 2. Total number of nurses in ward
Code Ward Patient Nurse
W1 Male orthopedic ward 100 12
W2 Female orthopedic ward 120 12
W3 Gynecology ward 130 14
W4 Male medical ward 130 18
W5 Female medical ward 290 20
W6 Stroke ward 200 20
W7 Male surgical ward 100 18
W8 Maternity ward 200 8
W9 Labour ward 300 20
W10 Children emergency ward 402 20
W11 Geriatric ward 270 14
W12 Chest ward 200 8
W13 Accident & emergency (Medicals) 230 22
W14 Accident & emergency (Trauma) 160 22
W15 Pediatrics ward 100 24
6 = × 252 = 17.19 ≅ 17 (10)
7 = × 252 = 8.59 ≅ 9 (11)
8 = × 252 = 17.19 ≅ 17 (12)
9 = × 252 = 25.78 ≅ 26 (13)
10 = × 252 = 34.55 ≅ 35 (14)
11 = × 252 = 23.21 ≅ 24 (15)
12 = × 252 = 17.19 ≅ 17 (16)
13 = × 252 = 19.77 ≅ 20 (17)
14 = × 252 = 13.75 ≅ 14 (18)
15 = × 252 = 8.59 ≅ 9 (19)
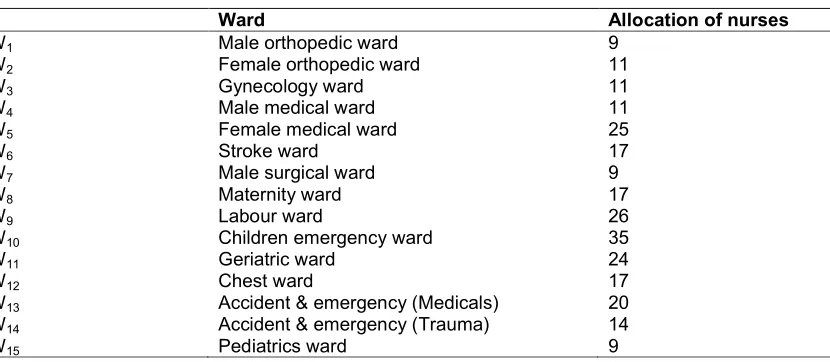
Table 3 shows the allocation of two hundred and fifty two (252) nurses into fifteen wards at the hospital. From the result obtained, the children emergency ward had the highest allocation of nurses, followed by labour ward, female medical ward, geriatric ward and accident and emergency (medical). While the male orthopedic and pediatrics wards each had the lowest allocation of nine (9) nurses.
In table 4, the actual number of nurses obtained from our hub of investigation was compared with calculated number of nurses. From table 4, it can be seen that the actual number and calculated
number of nurses in Female Orthopedic ward, Accident & Emergency (Medicals), Stroke ward, Male Orthopedic ward, Gynecology ward and Female medical ward were very close.
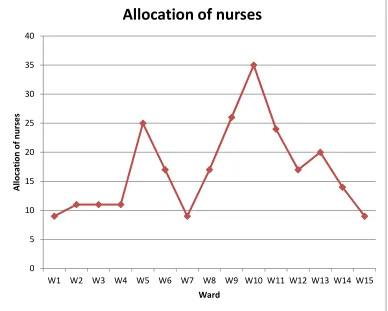
Fig. 1 shows the allocation of two hundred and fifty two nurses to fifteen (15) wards with the aid of a line chart. From Fig. 1, it can be seen that the children emergency ward had the highest allocation of thirty five (35) nurses. This is closely followed by labour ward, female medical ward, geriatric ward and accident and emergency ward having allocation of twenty six (26) nurses, twenty five (25) nurses, twenty four (24) nurses and twenty (20) nurses respectively. While both the pediatrics and male orthopedic wards had the lowest allocation of nine (9) nurses.
Fig. 2 is a bar chart showing the allocation of two hundred and fifty two nurses to fifteen (15) wards at Warri Central Hospital. From Fig. 2, it can be seen that the children’s emergency ward had the highest allocation of thirty five (35) nurses. This is closely followed by labour ward, female medical ward, geriatric ward and accident and emergency ward having allocation of twenty six
(26) nurses, twenty five (25) nurses, twenty four (24) nurses and twenty (20) nurses
respectively. The pediatrics ward and male orthopedic ward had the lowest allocation of nine (9) nurses.
Fig. 3 is a pie chart showing the allocation of two hundred and fifty two nurses to fifteen (15) wards at the hospital. From Fig. 3, it can be seen that the children’s emergency ward had the highest allocation of thirty five (35) nurses. This
Table 3. Allocation of nurses
Ward Allocation of nurses
W1 Male orthopedic ward 9
W2 Female orthopedic ward 11
W3 Gynecology ward 11
W4 Male medical ward 11
W5 Female medical ward 25
W6 Stroke ward 17
W7 Male surgical ward 9
W8 Maternity ward 17
W9 Labour ward 26
W10 Children emergency ward 35
W11 Geriatric ward 24
W12 Chest ward 17
W13 Accident & emergency (Medicals) 20
W14 Accident & emergency (Trauma) 14
Table 4. Comparison between actual number and calculated number of nurses
Ward Number of nurses
Actual Calculated
Male orthopedic ward 12 9
Female orthopedic ward 12 11
Gynecology ward 14 11
Male medical ward 18 11
Female medical ward 20 25
Stroke ward 20 17
Male surgical ward 18 9
Maternity ward 8 17
Labour ward 20 26
Children emergency ward 20 35
Geriatric ward 14 24
Chest ward 8 17
Accident & emergency (Medicals) 22 20
Accident & emergency (Trauma) 22 14
Pediatrics ward 24 9
is closely followed by labour ward, female medical ward, geriatric ward and accident and emergency ward having allocation of twenty six (26) nurses, twenty five (25) nurses, twenty four
(24) nurses and twenty (20) nurses
respectively. The pediatrics ward and male orthopedic ward had the lowest allocation of nine (9) nurses.
Fig. 1. Line chart plot of nurses in fifteen wards
0 5 10 15 20 25 30 35 40
W1 W2 W3 W4 W5 W6 W7 W8 W9 W10 W11 W12 W13 W14 W15
A
llo
ca
ti
o
n
o
f
n
u
rs
e
s
Ward
Fig. 2. Bar chart of nurses in fifteen wards
Fig. 3. Pie chart of nurses in fifteen wards
0 5 10 15 20 25 30 35 40
W1 W2 W3 W4 W5 W6 W7 W8 W9 W10 W11 W12 W13 W14 W15
N
u
rs
e
Ward
Bar chart
W1 W2 W3 W4 W5 W6 W7 W8
3.2 Computation of Trial Control Limits
These trial control limits are computed to determine whether a process is in statistical control or not.
From equation (3), we have the central line, ̅:
Where
̅ = = = 16.8 (20)
Using equations (3.1) and (3.2), we compute the
upper control limit (UCL) and the lower control
limit (LCL):
= + 3
= 16.8 + 3√16.8
= 29.10 (21)
= − 3 = 16.8 − 3√16.8
= 4.50 (22)
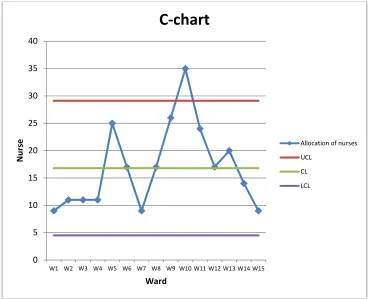
3.3 C-chart Plot
The control chart in Fig. 4 is plotted using Microsoft Office Excel 2007. A control Excel process is a useful tool for studying how processes or other data changes over time. The chart consists of four lines; the data which is indicated with a blue line, a straight green line
representing the average or centre line (CL), a
red line showing the upper control limit (UCL)
and a purple line indicating the lower control limit
(LCL). It can be seen that the chart is out of
statistical control as there is a point outside the specified control limits. Every other point is observed to be within the control limits. The points in the control charts correspond to the number of wards studied.
3.4 Discussion
Table 2 shows the allocation of two hundred and fifty two (252) nurses into fifteen wards at the hospital using equation (4). From the result obtained, the children emergency ward had the highest allocation of nurses, followed by labour ward, female medical ward, geriatric ward and accident and emergency (medical). While the male orthopedic and pediatrics wards had the lowest allocation of nine (9) nurses.
In table 3, the actual number of nurses obtained from data gathered is compared with calculated number of nurses obtained using equation (4).
From table 3, it can be seen that the actual number and calculated number of nurses in Female Orthopedic ward, Accident & Emergency (Medicals), Stroke ward, Male Orthopedic ward, Gynecology ward and Female medical ward are very close.
Fig. 1 shows the allocation of two hundred and fifty two nurses to fifteen (15) wards with the aid of a line chart. From Fig. 1, it can be seen that the children emergency ward had the highest allocation of thirty five (35) nurses. This is closely followed by labour ward, female medical ward, geriatric ward and accident and emergency ward having allocation of twenty six (26) nurses, twenty five (25) nurses, twenty four (24) nurses and twenty (20) nurses respectively. While the pediatrics ward and male orthopedic ward had the lowest allocation of nine (9) nurses.
Fig. 2 is a bar chart showing the allocation of two hundred and fifty two nurses to fifteen (15) wards. From Fig. 2, it can be seen that the children’s emergency ward had the highest allocation of thirty five (35) nurses. This is closely followed by labour ward, female medical ward, geriatric ward and accident and emergency ward having allocation of twenty six (26) nurses, twenty five (25) nurses, twenty four (24) nurses and twenty (20) nurses respectively. The pediatrics ward and male orthopedic ward had the lowest allocation of nine (9) nurses.
Fig. 3 is a pie chart showing the allocation of two hundred and fifty two nurses to fifteen (15) wards. From Fig. 3, it can be seen that the children’s emergency ward had the highest allocation of thirty five (35) nurses. This is closely followed by labour ward, female medical ward, geriatric ward and accident and emergency ward having allocation of twenty six (26) nurses, twenty five (25) nurses, twenty four (24) nurses and twenty (20) nurses respectively. The pediatrics ward and male orthopedic ward had the lowest allocation of nine (9) nurses.
Fig. 4 shows a C-chart plot of allocation of two hundred and fifty two nurses to fifteen wards at the hospital studied. The values for the centre
line (CL), upper control limits (UCL) and lower
Fig. 4. Control chart of nurses in fifteen wards
(W10) is outside the upper control limit. It can be
seen that the allocation of nurses to the
children’s emergency ward exceeds the
maximum number stated. Therefore, the
allocation of nurses to this ward needs to be reviewed for the process to be in control. The remaining fourteen wards are in statistical control as none of them have points outside the control limits.
4. CONCLUSION
Optimum manpower allocation in healthcare using statistical process control has been studied. The study includes the analysis of data obtained from fifteen wards at our hub of investigation, the allocation of nurses available to these wards; the use of a line chart, pie chart and bar chart to show the allocations, determination of the upper control limit (UCL) and the lower control limit (LCL) of the control chart, quality control chart plot using Microsoft Office Excel 2007, and checking if the process is in statistical control.
The data obtained from our hub of study was analyzed using statistical process control. The results obtained showed that the manpower
allocation process was out of control as the manpower allocation of the children’s emergency ward was found to be outside the control limits. In this study, the optimum allocation of two hundred and fifty two nurses to fifteen wards using statistical process control was successfully determined.
COMPETING INTERESTS
Authors have declared that no competing interests exist.
REFERENCES
1. Wajiga H, Ndaghu JT. Significance of
Manpower Planning For Effective
Utilization of Human Resources in an
Organization: A Concept Approach.”
International Management Invention
(IJBMI). 2017;6(8):16-22.
2. Olatunde A. On the Importance of
Statistical Process Control in Health Care. Research Journal of Medical Sciences. 2009;3(2):87-90.
3. Wetherill GB. Sampling Inspection and
Quality Control. 2nd Edition. New York:
John Wiley & Sons, Inc; 1977.
0 5 10 15 20 25 30 35 40
W1 W2 W3 W4 W5 W6 W7 W8 W9 W10 W11 W12 W13 W14 W15
N
u
rs
e
Ward
C-chart
Allocation of nurses
UCL
CL
4. Benneyan JC, Lloyd RC. Statistical Process Control as a Tool for Research and Healthcare Improvement. Quality & Safety Health Care; 2003;12:458- 464.
5. Mohammed MA. Using statistical process
control to improve the quality of health Care. Quality & Safety HealthCare. 2004; 13:245-245.
6. Mohammed MA, Worthington P, Woodall
WH. Plotting Basic Control Charts: Tutorial Notes for Healthcare Practitioners. Quality & Safety Health Care. 2008;17:137-145.
7. Diaz M, Neuhauser D. Pasteur and
Parachutes: When Statistical Process Control is better than a Randomized Controlled Trial. Quality & Safety Health Care. 2005;14:140-143.
8. Adab P, Rouse A, Mohammed MA.
Performance League Tables: The NHS Deserves Better. BMJ. 2002;324:95-98.
9. Woodall WH. The Use of Control
Charts in Health-Care and Public Health Surveillance (With Discussion). Journal
of Quality Technology. 2006;38:104-
105.
10. Wheeler DJ, Chambers DS.
Understanding Statistical Process Control.
2nd Edition. Knoxville, TN: SPC Press;
1992.
11. Ryan TP. Statistical Methods for Quality
Improvement. Second Edition. New York: John Wiley & sons; 2000.
12. Montgomery DC. Introduction to Statistical
Quality Control. 6th Edition. New York, NY:
John Wiley & Sons; 2009.
13. Mohammed MA, Worthington P, Woodall
WH. Plotting Basic Control Charts: Tutorial
Notes for Healthcare Practitioners.
Quality & Safety Health Care. 2008;17: 137-145.
© 2019 Odinikuku et al.; This is an Open Access article distributed under the terms of the Creative Commons Attribution License (http://creativecommons.org/licenses/by/4.0), which permits unrestricted use, distribution, and reproduction in any medium, provided the original work is properly cited.
Peer-review history: