Turkish Journal of Fisheries and Aquatic Sciences 14: 143-153 (2014)
www.trjfas.org ISSN 1303-2712 DOI: 10.4194/1303-2712-v14_1_16
© Published by Central Fisheries Research Institute (CFRI) Trabzon, Turkey in cooperation with Japan International Cooperation Agency (JICA), Japan
Potential for Improvement of Common Carp Production Efficiency by
Mechanical Processing of Cereal Diet
Introduction
Common carp (Cyprinus carpio L.) is the major freshwater fish species farmed in Central and Eastern Europe (Stibranyiová and Adámek, 1998; Mráz and Picková, 2009). In the Czech Republic, carp comprises 86-87% of the total fish production (Czech Ministry of Agriculture 2011) and mainly consists of semi-intensive culture in ponds (Miah et al., 1997; FAO 1997; Reddy et al., 2002; Pokorný and Hauser, 2002). The profitability of pond aquaculture is dependent on the use of economical feeds (Pigott and Tucker, 2002), and the key to efficient semi-intensive systems is the reliance on a combination of natural and artificial feed (Moore, 1985; Kaushik, 1995; Bauer and Schlott, 2006). Artificial supplements used in the Czech Republic are based almost entirely on cereal grains, an easily available economic source of energy (Turk, 1994, 1995; Mráz and Picková, 2009). Compared to pelleted feeds, cereals represent an easy and cheap source of digestible energy in form of carbohydrates, especially starch. Common carp have high activity of α-amylase and therefore efficient starch digestion; a practical benefit for pond aquaculture (Steffens, 1989). Nevertheless, cereals
represent the highest cost item in common carp culture, with large quantities used in production of 2-3-year-old fish (Hůda, 2009). The availability of low cost feed plays a primary role in pond aquaculture economics (Horváth et al., 1992), and currently, all common cereal grain species are used for artificial feeding (Hůda, 2009).
A proper adjustment of cereals leads to an increased feed efficiency (nutritional value, acceptability and digestibility) and thus to an increase in fish growth. Contemporary fish farming aims to develop new methods of enhancing the production effectiveness of cereals by mechanical adjustment: pressing, grinding, and/or thermal treatment (Zeman, 2002; Urbánek, 2009). The way in which feed is processed affects the availability of nutrients (Tabachek, 1985; Pigott and Tucker, 2002). Current practice is crushing seeds in a cylinder press to improve digestibility. The principle is to rupture the seed coat to give access to microorganisms so that they can begin to digest the carbohydrate (Zeman, 2002). The objectives of the study were to determine the fish growth and condition in semi-intensive pond culture if pre-treated feed would improve productivity.
Jan Másílko1,*, Petr Hartvich1, Michael Rost2, Martin Urbánek3, David Hlaváč1, Petr Dvořák1
1
University of South Bohemia in Ceske Budejovice, Faculty of Fisheries and Protection of Waters, South Bohemian Research Center of Aquaculture and Biodiversity of Hydrocenoses, Institute of Aquaculture, Husova trida 458/102, 370 05 Ceske Budejovice, Czech Republic.
2
University of South Bohemia, Faculty of Economics, Studentska 13, 370 05 Ceske Budejovice , Czech Republic. 3
The Czech Fish Farmers Association, Prazska 495/58, 371 38, Ceske Budejovice, Czech Republic.
* Corresponding Author: Tel.: +420.387 774645; Fax: ; E-mail: [email protected]
Received 23 October 2013 Accepted 20 January 2014
Abstract
The effect of supplemental feeding with modified cereals (pressed triticale, barley, rye and pressed wheat in combination with rape) on the growth of common carp was studied under semi-intensive pond farming conditions. Non-pressed triticale, barley and rye were used for comparison. Two groups were selected as a control dependent only on natural zooplankton. For the evaluation, we employed five models designated M1 – linear mixed models with a random intercept; M2 – linear mixed models with a random slope; M3 – a linear mixed model with a random intercept and slope; M4 – written as model M3 with a power variance function, where the error variance was modelled and M5 – written as model M4 with a power variance function, with a different model of error variance. Model M5 took heterogeneous errors with respect to differing strata. Common carp that were fed supplements of modified cereals showed a significant lower variability of weight (lower SD and narrower 95% CI) compared to the non-pressed diets and pressed barley and rye that yielded higher production. These results suggest that pressed cereals increase yield in commercial production of common carp under semi-intensive conditions.
146
Materials and Methods
Study Area and Experimental Ponds
The experiment was conducted near Třeboň in the Czech Republic at 48°59'N, 14°46'E. This region is characterized as a plain basin with numerous ponds at mean altitudes of 410–450 m above sea level. The climate is temperate with the average annual temperature of 7.5°C. Annual precipitation is approximately 600–650 mm.
The experiment was conducted over 111 days from 23 May 2008 to 11 September 2008 in 9 earthen experimental ponds of the 300m2 each with continuous water inflow. These experimental ponds had uniform characteristics in terms of size, bottom composition, wall construction, water volume, retention time and physico-chemical properties of water as they were located next to each other and had water inflow from the same pond. The ponds were filled to a depth of 1 m and had an average capacity of 300 m3. Ponds were stocked with fish of the same age and the same genetic origin namely three-year-old Třeboň scaly common carp, of mean weight 988±31 g ind-1 at a density of 363 fish ha-1. This density is typical for semi-intensive culture of carp in the Třeboň region.
Individual fish which was stocked into the experimental ponds were marked individually with a microchip in the dorsal musculature using a DataMars Needle Kit. During the experiment (on days 31, 53, 73 and 98) control catches were executed in each experimental pond. Fish were collected and the individual body length and individual weight were measured. After each control measurement, the fish were released back to the same experimental ponds. At the end of the experiment (day 111) individual body length and individual weight were also measured in order to assess individual growth characteristics over the entire rearing period in all experimental ponds of all fish.
Temperature and dissolved oxygen of the water inflow were monitored three times a week at 08:00 -10:00 h. Measurements used the MKT 44A INSA (oximeter INSA Company s.r.o., Prague, Czech Republic).
The zooplankton community in each
experimental pond was sampled bi-weekly from the
beginning of June to the beginning of September. Samples of zooplankton were taken from all ponds using a 10 L Schindler’s quantitative sampler (100 μm mesh). The samples were pooled and preserved with 4% formaldehyde in polyethylene tubes. Quantitative and qualitative analyses were carried out under a stereomicroscope (Olympus BX51 binocular microscope fitted with an Olympus E-510 digital camera) in a Sedwick-Rafter chamber.
Experimental Supplemental Feeding
Seven fish groups in separate experimental ponds were fed with different supplemental cereal feeds: (i) barley, (ii) pressed barley, (iii) rye, (iv) pressed rye, (v) triticale, (vi) pressed triticale, and (vii) pressed wheat and rape (50%/50%). Two additional groups provided only with naturally available food served as controls. The chemical analysis of the feed showed that the differences among the cereals in digestible energy (DE), protein content and carbohydrates were minimal (Table 1). The pressed form of barley, rye, triticale, wheat, and rape was made using a pressing cylinder (type KB 160/2) to obtain the final particle size of 1.3 mm with the aim of eliminating the losses caused by floating.
Feeding Management
The cereals were placed three times a week by hand (Monday, Wednesday and Friday) on the feeding pits (concrete panel) at 08:00-09:00 h at an initial rate of 5% of fish stock biomass. Feeding pits consist of a concrete place on the bottom of each experimental pond. There it is easy to check if and how much feed is consumed by the fish.
Formulae for Growth, Feed Conversion and Feed Retention and Condition
Standard formulae were used to assess growth, feed utilization and other relevant parameters during the feeding trial. The Specific Growth Rate was estimated according to Virk and Saxena (2003). The Feed Conversion Ratio [FCR] was calculated as described by Steffens (1989) and the Fulton coefficient [FC] was estimated according to Arlinghaus and Hallermann (2007)
Table 1. Chemical analysis and Digestible energy (DE) in cereals used in the experiment
Dry matter
(g.kg-1) Protein (g.kg-1) (g.kgFat -1)
Starch (g.kg-1)
DE a)
(MJ.kg-1) (MJ.ind.-1) (MJ.ind-1.day-1)
Barley 870 110 21 676 12.489 31.78 0.286
Pressed barley 870 110 21 676 12.489 31.78 0.286
Rye 870 85.6 13.8 721 12.499 31.81 0.286
Pressed rye 870 85.6 13.8 721 12.499 31.81 0.286
Triticale 880 106 19 715 12.928 31.73 0.285
Pressed triticale 880 106 19 715 12.928 31.73 0.285
Pressed wheat and rape 876 180 360 90 14.211b) 28.42 0.255
147
Statistical Analysis and Growth Models
One-way ANOVA with fixed effects was used to test the hypothesis of equal mean weight of stocked fish in all groups. Homogeneity of variance was tested through Bartlett’s test (Bartlett, 1937). For planned variance comparisons we used classical two samples
F-test (Mason et al., 2003). Confidence intervals for standard deviation based on normal asymptotic theory are also provided.
Due to the fact that we were primarily interested in the fourth growing season, which is crucial for final production, we used linear models to describe the growth data. The growth trajectory could be roughly characterized as increasing at a constant rate during the experimental period, which could be satisfactorily described through the linear model. To fit linear growth models, we used several linear mixed models that could be expressed in matrix form
i i i i
i Xβ Zb ε
y (Laird and Ware 1982). We
assume the vector of random effect to be
Ψ)
N(0,
~
b
i and within-group error) , 0 N(
~ 2 i
i Λ
ε .
We employed five models designated M1 – a linear mixed model with a random intercept; M2 – a linear mixed model with a random slope; M3 – a linear mixed model with a random intercept and slope; M4 – written as model M3 with a power variance function, where the error variance was
modelled as Var(
ij)
2tij 2ijand with one
covariate function g(tij,
ij) tij ij ; and M5 –written as model M4 with a power variance function,
with the error variance modelled as
ij s
ij
ij t
Var( )2 2 and one covariate
function sij
ij ij
ij t
t
g( , ) . The later model takes
heterogeneous errors with respect to differing strata, e.g. different diet, into account.
Model Selection and Hypothesis Testing
For fitting the linear mixed-effect model we used the maximum likelihood (ML) details of the applied algorithm, provided, for example, by Pinheiro and Bates (2000). This method enables the use of Information Theory for model selection. For this purpose we used Akaike information criterion, AIC = -2log(
θ
|X)+2k, which approximates the Kullback-Leibler distance (Burnham and Anderson, 2002) and the Bayesian information criterion (BIC). In this formula, log(θ
|X) calculates the numerical value of the log-likelihood function evaluated at its maximum for a particular model. The vectorθ
contains the estimated parameters of the evaluated model and k is the number of estimated parameters. For more detailson this topic see Akaike (1974). The model with the smallest AIC value was selected as the most suitable model among the tested models.
Software
The numerical evaluation was carried out with the programming environment R 2.8.1 (R development core team, 2008). For the estimation of the parameters in linear mixed models we used the library name written by Pinheiro et al. (2008).
Results
Growth Models and Analysis with Respect to Diet
The hypothesis of homogeneity of the experimental fish groups with respect to their weight at the beginning of the experiment was tested through one-way analysis of variance with result F = 1.540 e.g. p = 0.160. Therefore, we can conclude that all groups were, on average, of similar weight at the start of the experiment. The hypothesis of equal variance in all groups at the start of the experiment was confirmed by Bartlett’s test with results
2 = 2.416 e.g. p = 0.933.We provide Akaike Information Criterion (AIC) and Bayesian Information Criterion (BIC) for each of the fitted models, and also compare the models by the likelihood ratio test. A larger p-value for the likelihood ratio and smaller AIC and BIC values for the considered model indicate that it should be preferred (P<0.0001). Model M3 is better than model M2 due to smaller AIC and BIC values (Table 2). The preferred model is model M5 with AIC = 7578 and BIC 7702. This model has the following form
) ( ( 1 8 18 7 17 6 16 5 15 4 14 3 13 2 12 1 0 8 08 7 07 6 06 5 05 4 04 3 03 2 02 0 i i i i i i i i i i i i i i i i ij b D D D D D D D b D D D D D D D y
(M5)where
D
2i is the binary variable taking the value 1 if the i-th fish receive barley and 0 otherwise. The coefficient D3i is a binary indicator variable for the pressed form of barley, D4i is a binary indicator for rye and so on (Table 3). The coefficient 0 and1
are, respectively, the average intercept and average slope for fish under natural diet (control groups).
In such parameterization the coefficient 0k
148
interaction of barley, pressed barley, rye, pressed rye, triticale, and pressed triticale with time (Table 3).
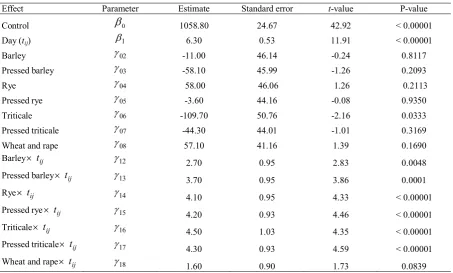
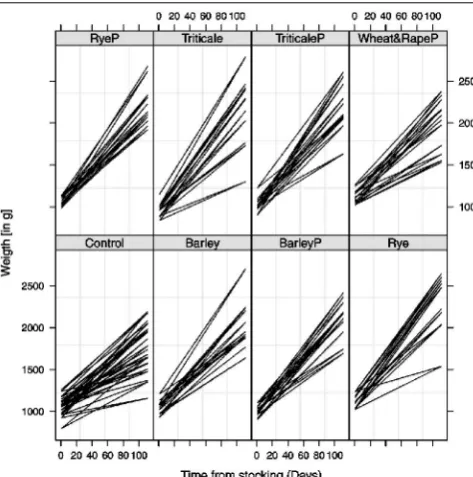
Both forms of triticale and rye have the highest value of the linear regression coefficient, indicating that these cereals are more efficient than the others. Detailed analysis of the weight variability is shown below in Table 5. Random components b0i and b1i in
each model shown in Table 4 are assumed to be the result of bivariate normal distribution
N(0,
Ψ)
whereT
)
0
,
0
(
0
andΨ
is variance-covariance matrixestimated as
371 . 2 144 . 0
144 . 0 298 . 98
Ψˆ . We provide a
predicted growth trajectory for all combinations of experimental fish groups. Pressed feeds produced lower variability and higher daily weight gain than the non-pressed cereals (Figure 1). Only the pressed form of triticale showed a lower average value of daily weight gain than whole triticale (Table 5).
Individual Fish Weight
At the end of the experiment (111 days),
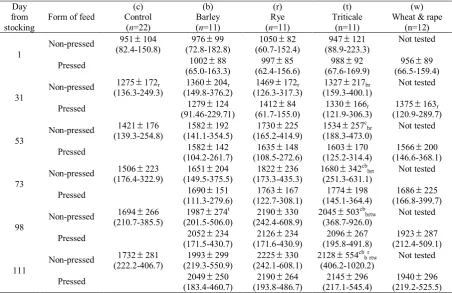
common carp on diets supplemented with intact rye and those fed pressed rye reached the highest individual weight at 2225±330 g.ind-1 and 2190±264 g.ind-1, respectively. The third highest weight 2145±296 g ind-1 was obtained with pressed triticale. Common carp fed a diet supplement of intact non-pressed triticale reached the final weight of 2128±554 g ind-1. A lower final weight of 2049±250 g ind-1 was found for common carp fed pressed barley and 1993±299 g ind-1 for those fed with non-pressed barley. The group fed pressed wheat and rape had final individual weight 1940±296 g ind-1. The lowest final weight was found for carp in the control groups at 1732±281 g ind-1 (Table 5).
Significant differences (P<0.05) were observed in standard deviation (SD) values during the course of the experiment (Table 5). At the end of the experiment, the highest SD values were found for supplemental feeding without adjustment: triticale, SD 554 g ind-1; rye, SD 330 g ind-1; and barley, SD 299 g ind-1. The average SD value of fish weight in fish fed the non-pressed variants reached 394 ind-1 at the end of the experiment. All fish fed pressed cereals
Table 2. Summary statistics for the fitted models
Model AIC BIC log(
θ
|X) Test Likelihood ratio P-valueM1 7973 8053 -3969
M2 7710 7789 -3837
M3 7669 7758 -3815 M2 vs. M3 44.31 < 0.0001
M4 7646 7739 -3802 M3 vs. M4 25.33 < 0.0001
M5 7578 7702 -3761 M4 vs. M5 81.96 < 0.0001
Table 3. Parameter estimates and associated statistic for fixed effects in the linear mixed model M5
Effect Parameter Estimate Standard error t-value P-value
Control
0 1058.80 24.67 42.92 < 0.00001Day (tij) 1 6.30 0.53 11.91 < 0.00001
Barley 02 -11.00 46.14 -0.24 0.8117
Pressed barley 03 -58.10 45.99 -1.26 0.2093
Rye 04 58.00 46.06 1.26 0.2113
Pressed rye 05 -3.60 44.16 -0.08 0.9350
Triticale 06 -109.70 50.76 -2.16 0.0333
Pressed triticale 07 -44.30 44.01 -1.01 0.3169
Wheat and rape 08 57.10 41.16 1.39 0.1690
Barley tij 12 2.70 0.95 2.83 0.0048
Pressed barley tij 13
3.70 0.95 3.86 0.0001
Rye tij 14
4.10 0.95 4.33 < 0.00001
Pressed rye tij 15 4.20 0.93 4.46 < 0.00001
Triticale tij 16 4.50 1.03 4.35 < 0.00001
Pressed triticale tij 17 4.30 0.93 4.59 < 0.00001
149
showed significantly lower SD values (P<0.05): pressed barley, SD 250 g ind-1; pressed rye, SD 264 g ind-1; and pressed triticale SD 296 g ind-1. The average SD value for fish fed pressed variants was 270 g ind-1 at the end of the experiment.
Weight Gain, Feed Utilization and Condition Factor
Differences among the cereals in digestible
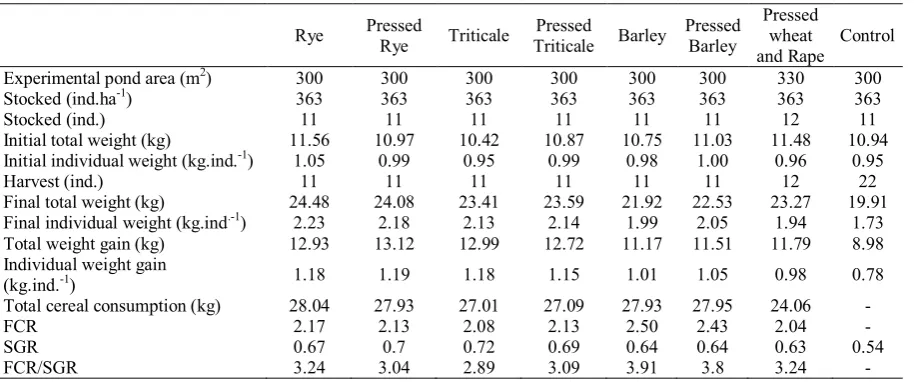
energy (DE) and content of proteins and carbohydrates were minimal (Table 1). Common carp fed pressed rye showed the greatest individual weight gain, 1.192 kg ind-1, with FCR of 2.13 and SGR of 0.7 (Table 6). The non-pressed triticale group showed individual weight gain of 1.180 kg ind-1 with FCR of 2.08 and SGR of 0.72. Common carp fed non-pressed rye showed individual weight gain of 1.175 kg ind-1 with FCR of 2.17 and SGR of 0.67. Intermediate individual weight gain 1.156 kg ind-1 was reached by
Table 4. Regression models for particular diet based on the mixed model M5
Diet Fitted model Variance of ij
Control 1058.8b0i6.3tij b1itij ij
18349 . 0 2 2
604 . 121 )
( ij tij
Var
Barley 1047.8b0i 9.0tij b1i tij ij
08062 . 0 2 2 604 . 121 )
( ij tij
Var
Pressed barley 1000.7b0i 10.0tij b1itij ij
0857 . 0 2 2 604 . 121 )
( ij tij
Var
Rye 1116.8b0i10.4tijb1itijij
0834 . 0 2 2 604 . 121 )
( ij tij
Var
Pressed rye 1055.2b0i10.5tij b1itij ij
15207 . 0 2 2 604 . 121 )
( ij tij
Var
Triticale 919.1b0i10.8tij b1itij ij
10039 . 0 2 2
604 . 121 )
( ij tij
Var
Pressed triticale 1014.5b0i10.6tijb1itijij
15787 . 0 2 2 604 . 121 )
( ij tij
Var
Wheat & rape 1115.9b0i7.9tij b1itij ij
20465 . 0 2 2 604 . 121 )
( ij tij
Var
Table 5. Point estimate (meanSD) of the weight (g) and 95 % confidence interval for standard deviations of the weight with respect to the different diets and time from stocking in grams
Day from stocking
Form of feed
(c) Control
(n=22)
(b) Barley (n=11)
(r) Rye (n=11)
(t) Triticale
(n=11)
(w) Wheat & rape
(n=12)
1
Non-pressed 951104 97699 105082 947121 Not tested
(82.4-150.8) (72.8-182.8) (60.7-152.4) (88.9-223.3)
Pressed 100288 99785 98892 95689
(65.0-163.3) (62.4-156.6) (67.6-169.9) (66.5-159.4)
31
Non-pressed 1275172r 1360204r 1469172r 1327217br Not tested (136.3-249.3) (149.8-376.2) (126.3-317.3) (159.3-400.1)
Pressed 1279124 141284 1330166r 1375163r
(91.46-229.71) (61.7-155.0) (121.9-306.3) (120.9-289.7)
53
Non-pressed 1421176 1582192 1730225 1534257 c
br Not tested (139.3-254.8) (141.1-354.5) (165.2-414.9) (188.3-473.0)
Pressed 1582142 1635148 1603170 1566200
(104.2-261.7) (108.5-272.6) (125.2-314.4) (146.6-368.1)
73
Non-pressed 1506223 1651204 1822236 1680342 cb
brt Not tested (176.4-322.9) (149.5-375.5) (173.3-435.3) (251.3-631.1)
Pressed 1690151 1763167 1774198 1686225
(111.3-279.6) (122.7-308.1) (145.1-364.4) (166.8-399.7)
98
Non-pressed 1694266 1987274 t
2190330 2045503cbbrtw Not tested (210.7-385.5) (201.5-506.0) (242.4-608.9) (368.7-926.0)
Pressed 2052234 2126234 2096267 1923287
(171.5-430.7) (171.6-430.9) (195.8-491.8) (212.4-509.1)
111
Non-pressed 1732281 1993299 2225330 2128554 cb
brrtw Not tested (222.2-406.7) (219.3-550.9) (242.1-608.1) (406.2-1020.2)
Pressed 2049250 2190264 2145296 1940296
(183.4-460.7) (193.8-486.7) (217.1-545.4) (219.2-525.5)
Alphabetical subscripts are used to indicate significant differences among different diets (P-value<0,05; F-test to compare two variances). Alphabetical superscripts are used to indicate significant difference between non-pressed and pressed form of particular feed (P-value<0,05;
150
common carp fed with pressed triticale with FCR 2.13 and with SGR of 0.69.
At stocking in May, the mean FC for carp was 3.07±0.12. During the growing season, FC values slowly increased with increasing fish weight. However, in August (at 73 days), a decrease of FC values in the all groups of fish was observed. At harvest (111 days), the highest FC value was seen in the non-pressed triticale group at 3.36±0.27 and the non-pressed barley group at 3.35±0.23. The group fed pressed wheat and rape reached similar FC values at 3.23±0.27. The pressed barley had FC 3.19±0.49, and the control carp had FC 3.19±0.24. The lowest FC value at the end of the experiment, 3.13±0.23, was found in the group receiving pressed rye.
Environmental Parameters and Zooplankton
The mean value of the temperature and dissolved oxygen were 20.7±1.7°C and 6.07±1.19 mg L-1, respectively. The lowest values of temperature were observed during the September. Both parameters showed no significant difference among the experimental ponds (P0.05). Mean abundance of zooplankton was 135±87 ind L-1. Cladocerans (especially Bosmina longirostris) were dominant throughout the experiment (94%). Copepods, represented mainly by Thermocyclops crassus, comprised 4% of the zooplankton community. Rotifers represented 2%. No significant differences were noted in zooplankton density among the experimental ponds.
Discussion
The common carp is omnivorous with wide food plasticity (Urán et al., 2008). At the beginning of the
growing season, it filters zooplankton and consumes carbohydrates to fulfil its energy needs, using exogenous enzymes obtained from zooplankton (e.g. cladocerans) for digestion of carbohydrates. Skeletons of cladocerans and copepods aid in the mechanical digestion of food (Jancarik, 1964; Strumbauer and Hofer, 1986).
According to Shimeno et al. (1997), in summer a decrease in the activity of glycolytic and lipogenic enzymes occurs, and carp become almost totally herbivorous. In order to digest carbohydrates, endogenous enzymatic activity was found to gradually increase (Shimeno and Shikata, 1993a, b). Hartman (2005) found that unconsumed feed particles appeared on the pond water surface in this period. Their nutritional intake was limited to the necessary essential ration, and only after the ability of the carp to utilize carbohydrates had developed, they started to take up dietary amounts adequate for their growth. This adverse transient period can be shortened by providing pressed cereals, which are more digestible than whole seeds.
In the present study, growth of common carp in the rearing ponds was characterized by two seasonal maxima with the greatest weight increase in June and August. Between the two growth peaks, a reduction in the rate of weight gain was observed, which can be explained both by decreasing quantity of natural food and the gradual adaptation of fish to supplemental feed. It is known, that a reduction in the activity of digestive enzymes at low water temperatures of diet could also be responsible for the decrease in apparent digestibility with the decrease in water temperature. Variations in water temperature have a great effect on fish basal metabolism, because fish are poikilotherms and their metabolic rate is determined by the environmental temperature. A decrease in weight gain
151
in September could be a combined effect influenced by less efficient digestion, basal metabolism associated with worsening environmental conditions caused by decreasing temperature.
According to Dumas et al. (2010) fish weight gain is highly dependent on water temperature. The temperature of most fish species are linked to that of the environment. The digestive system of fish is effectively adapted ambient temperature and the temperature has an influence on fish metabolism. Horn (1998) stated that temperature limits the microbial fermentation in the gut of common carp. Schwarz (1997) reported that common carp digestion is most effective at 23-25°C. When the water temperature decreases from 25 to 18°C, digestion in common carp is significantly reduced (Kim et al., 1998; Yamamoto et al., 2001, 2007; Clements and Raubenheimer, 2006). Water quality parameters (temperature and oxygen) measured during the experimental period corresponded to common values recorded in Czech ponds and remained within the ranges necessary for good growth performance of carp (Billard, 1999). Both parameters showed no significant difference among the experimental ponds (P0.05), indicating that feeding experiments had not been biased by water parameters.
Daily weight gain of common carp fed pressed rye was 1.45% higher, and the conversion of feed 1.85% lower, than in common carp fed non-pressed rye. The results for barley may have been influenced by higher fibre content (5.40%), which reduces the digestibility of other components (Jirásek, 2005). According to Pigott and Tucker (2002) digestion is the most important factor limiting nutrient availability. When altering grains by pressing, digestibility increases as indigestible constituents are crushed and fibre is split. In the pressed barley group, daily weight gain was 2.88% higher and the feed conversion was 2.80% lower than in the non-pressed barley group. Common carp receiving pressed wheat
and rape showed low growth rate. Jackson et al. (1982) found that a high proportion of rape in feed is associated with growth depression in omnivorous fish and α-amylase inhibitors in wheat appear to reduce starch digestibility (Storebakken et al., 2000). The results for the combination of wheat and rape in the present study confirm this. Higher efficiency of pressed cereals was not shown for triticale. Daily weight gain for the non-pressed triticale group was 2.07% higher, and the conversion was 2.35% lower, than in the pressed triticale group. This result could have been influenced by high variation in fish weight or by the degree of pressing of the triticale, which may have led to higher losses of feed due to its dispersion in the water.
Przybyl and Mazurkiewicz (2004) showed that triticale, wheat and rye had a similar feed conversion factor, when used in extruded feeds. The higher FCR for pressed triticale compared to non-pressed grains in our study could be due to the processing methods. When pressing seeds the hull is crushed and the starch gets in contact with the water. We hypothesize that due to the different starch characteristics and higher amount of small starch granules in triticale compared to for example barley, wheat and rye (Ao and Jane, 2007; Gassner et al., 1989) starch from triticale is leaking to the water to a higher degree than from the other cereals. However this needs to be confirmed in another study.
Conclusion
Our results indicate that the production efficiency of cultured common carp can be increased by the supplementation of pressed rye or barley instead of non-pressed cereals. Feeding pressed rye or barley resulted in similar or higher weight gain at lower FCR values, and hence a decrease of feeding costs. In addition common carp fed pressed cereals showed lower variation in weight in comparison with
Table 6. Main management and production data (non-pressed and pressed cereals)
Rye Pressed
Rye Triticale
Pressed
Triticale Barley
Pressed Barley
Pressed wheat and Rape
Control
Experimental pond area (m2) 300 300 300 300 300 300 330 300
Stocked (ind.ha-1) 363 363 363 363 363 363 363 363
Stocked (ind.) 11 11 11 11 11 11 12 11
Initial total weight (kg) 11.56 10.97 10.42 10.87 10.75 11.03 11.48 10.94 Initial individual weight (kg.ind.-1) 1.05 0.99 0.95 0.99 0.98 1.00 0.96 0.95
Harvest (ind.) 11 11 11 11 11 11 12 22
Final total weight (kg) 24.48 24.08 23.41 23.59 21.92 22.53 23.27 19.91
Final individual weight (kg.ind.-1) 2.23 2.18 2.13 2.14 1.99 2.05 1.94 1.73
Total weight gain (kg) 12.93 13.12 12.99 12.72 11.17 11.51 11.79 8.98
Individual weight gain
(kg.ind.-1) 1.18 1.19 1.18 1.15 1.01 1.05 0.98 0.78
Total cereal consumption (kg) 28.04 27.93 27.01 27.09 27.93 27.95 24.06 -
FCR 2.17 2.13 2.08 2.13 2.50 2.43 2.04 -
SGR 0.67 0.7 0.72 0.69 0.64 0.64 0.63 0.54
152
those fed non-pressed cereals. As homogeneous size and weight minimizes manipulation during sorting and hence reduces stress, this finding will positively affect common carp welfare during harvesting. In order to optimise the feeding efficiency, the increased production efficiency of pressed rye and barley needs to be further investigated and verified. There is also a need to investigate why pressed triticale was less effective.
Acknowledgements
The study was supported by projects South Bohemian Research Centre of Aquaculture and Biodiversity of Hydrocenoses Grant nos. CENAKVA CZ.1.05/2.1.00/01.0024, CENAKVA II (the results of the project LO1205 were obtained with a financial support from the MEYS of the CR under the NPU I program) and GA JU 074/2013/Z. We would like to thank the commercial fisheries Rybářství Třeboň a.s. for their material and personal support and especially Sabine Sampels, Ph.D. for her help.
References
Akaike, H. 1974. A new look at the statistical model identification. IEEE Transaction on Automatic Kontrol, 19: 716-723.
doi: 10.1109/TAC.1974.1100705
Ao, Z. and Jane, J. 2007. Characterization and modeling of the A- and B-granule starches of wheat, triticale, and barely. Carbohydrate Polymers, 67: 46-55.
doi: 10.1016/j.carbpol.2006.04.013
Arlinghaus, R. and Hallermann, J. 2007. Effects of air exposure on mortality and growth of undersized pikeperch (Sander lucioperca) at low water temperatures with implications for catch and release. Fisheries Management and Ecology, 14: 155-160. doi: 10.1111/j.1365-2400.2007.00536.x
Bartlett, M.S. 1937. Properties of sufficiency and statistical tests. Proceedings of the Royal Society of London, Series A,160: 268-282. doi: 10.1098/rspa.1937.0109 Bauer, C. and Schlott, K. 2006. Reaction of common carp
(Cyprinus carpio L.) to oxygen deficiency in winter as an example for the suitability of radio telemetry monitoring the reaction of fish to stress factors in pond aquaculture. Aquaculture Research, 37: 248-254. doi: 10.1111/j.1365-2109.2005.01426.x
Billard, R. 1999. The carp: biology and culture. Springer praxis books / aquaculture and fisheries series, Chichester, 342 pp.
Burnham, K.P. and Anderson, D.R. 2002. Model selection and multimodel inference: a practical information-theoretic approach. 2nd. Ed., Springer, New York, 496 pp.
Clements, K.D. and Raubenheimer, D. 2006. Feeding and nutrition, In: D.H. Evans (Ed.), The physiology of fishes. CRC Press, Boca Raton: 47-82.
Czech Ministry of Agriculture. 2011. Report on situation and prospects – Fish, Prague [in Czech], 44 pp. Dumas, A., France, J. and Bureau, D. 2010. Modelling
growth and body composition in fish nutrition: where have we been and where are we going? Aquaculture Research, 41: 161-181. doi:
10.1111/j.1365-2109.2009.02323.x
FAO. 1997. FAO Fisheries Circular, vol. 886, Rome, 163 pp.
Gassner, G., Hohmann, B. and Deutschmann, F. 1989. Mikroskopische Untersuchung pflanzlicher Lebensmittel. 5 Auflage, Wilhelm Röck, Ruhstorf. Hartman, P., Přikryl, I., Štědronský, E. 2005. Hydrobiology
[in Czech], second revised edition, Informatorium Prague, 335 pp.
Horn, M.H. 1998. Feeding and digestion. In: D.H. Evans (Ed.), The Physiology of Fishes. CRC Press. Microbial fermentation, Florida: 46-65.
Horváth, L., Tamas, G. and Seagrave, CH. 1992. Carp and pond fish culture. Halsted Press an Imprint of John Wiley & Sons, Inc., New York, 158 pp.
Hůda, J. 2009. Cereals efficiency in market carp farming. [in Czech]. PhD thesis, University of South Bohemia, České Budějovice, Czech republic.
Jackson, A.J., Capper, B.S. and Matty, A.J. 1982. Evaluation of some plant proteins in complete diets for the tilapia Sarotherodon mossambicus, Aquaculture, 27: 97-109. doi: 10.1016/0044-8486(82)90129-6
Jancarik, A. 1964. Die Verdauung der Hauptnährstoffe beim Karpfen. Z. Fisch. Hilfswiss., B12 (8-10): 603-684. Jirásek, J., Mareš, J. and Zeman, L. 2005. Nutrition
requirement and tables of fish feed nutritive value. [in Czech]. Final report MZLU, Brno, 65 pp.
Kaushik, S.J. 1995. Nutrient requirements, supply and utilization in the context of carp culture. Aquaculture, 129: 225-241. doi: 10.1016/0044-8486(94)00274-R Kim, J.D., Breque, J. and Kaushik, S.J. 1998. Apparent
digestibilities of feed components from fish meal or plant protein based diets in common carp as affected by water temperature. Aquatic Living Resources, 11: 269-272. doi: 10.1016/S0990-7440(98)80011-9 Laird, N.M. and Ware, J.H. 1982. Random-Effects Models
for Longitudinal Data. Biometrics, 38: 963-974. doi: 10.2307/2529876
Mason, R.L., Gunst, R.F. and Hess, J.L. 2003. Statistical Design and Analysis of Experiments With Applications to Engineering and Science, 2nd edition, Wiley & Sons, New Jersey, 728 pp.
doi: 10.1002/0471458503
Miah, M.S., Uddin, M. and Shah, M.S. 1997. Effect of stocking ratios on the growth and production of fishes in mixed polyculture system. Bangladesh Journal of Fisheries.20: 135-138.
Moore, L.B. 1985. The role of feeds and feeding in aquatic animals production. GeoJournal, 10: 245-251. doi: 10.1007/BF00462125
Mráz J. and Picková J. 2009. Differences between lipid content and composition of different parts of fillets from crossbred farmed carp (Cyprinus carpio). Fish Physiology and Biochemistry, 35: 615-623.
doi: 10.1007/s10695-008-9291-5
Pigott, G.M. and Tucker, B.W. 2002. Special Feeds. In: J.E., Halver, R.W., Hardy. (Eds.), Fish Nutrition. Academic press, San Diego: 651-671.
Pinheiro, J.C. and Bates, D.M. 2000. Mixed-effect Models in S and S-plus. Springer-Verlag, New York. doi: 10.1007/978-1-4419-0318-1
Pinheiro, J.C., Bates, D.M., DebRoy, S., Sarkar, D. and R Core Team 2008. Linear and Nonlinear Mixed Effects Models. R package version, 90 pp.
153
Engineering, 18: 555-574. doi: 10.1016/S0925-8574(02)00020-4
Przybyl, A. and Mazurkiewicz, J. 2004. Nutritive value of cereals in feeds for common carp (Cyprinus carpio
L.). Czech Journal of Animal Science, 49(7): 307-314. R Development Core Team 2008. R: A language and environment for statistical computing. R. Foundation for Statistical Computing, Vienna, Austria, URL http://www.R-project.org.
Reddy, P.V.G.K., Gjerde, S.D., Tripathi, R.K., Jana, K.D., Mahapatra, S.D., Gupta, J.N., Saha, M., Sahoo, S., Lenka, P., Govindassamy, M. Rye. and Gjedrem, T. 2002. Growth and survival of six stocks of rohu (Labeo rohita, Hamilton) in mono and polyculture production systems. Aquaculture, 203: 239-250. doi: 10.1016/S0044-8486(01)00540-3
Shimeno, S., Shikata, T., Hosokawa, H., Masumoto, T. and Kheyyali, D. 1997. Metabolic response to feeding rates in common carp, Cyprinus carpio. Aquaculture, 151: 371-377. doi: 10.1016/S0044-8486(96)01492-5 Shimeno, S. and Shikata, T. 1993a. Seasonal changes in
carbohydrate-metabolizing enzyme activity and lipid content of carp reared outdoors. Nippon Suisan Gakkaishi, 59: 653-659. doi: 10.2331/suisan.59.653 Shimeno, S. and Shikata, T. 1993b. Effects of acclimation
temperature and feeding rate on carbohydrate metabolizing enzyme activity and lipid content of common carp. Nippon Suisan Gakkaishi, 59: 661-666. doi: 10.2331/suisan.59.661
Schwarz, F.J. 1997. Fischernährung. In: W. Schäperclaus, M. Lukowicz, (Eds.), Lehrbuch der Teichwirtschaft. Paul Parey, Berlin-Hamburg: 105-156.
Steffens, W. 1989. Principles of Fish Nutrition. Halsted Press. New York, 384 pp.
Stibranyiová, I. and Adámek, Z. 1998. The impact of winter storage of live carp on discharge water quality. Journal of Applied Ichthyology, 14: 91-95.
doi: 10.1111/j.1439-0426.1998.tb00620.x
Storebakken, T., Shearer, K.D., Baeverfjord, G., Nielsen, B.G., Ǻsgård, T., Scott, T. and De Laporte. 2000. Digestibility of macronutrients energy and amino acidsm absorption of elements and absence of intestinal enteritis in Atlantic salmon, Salmo salar, fed
diets with wheat gluten. Aquaculture, 184: 115-132. doi: 10.1016/S0044-8486(99)00316-6
Strumbauer, C. and Hofer, R. 1986. Compensation for amylase inhibitors in the intestine of the carp
(Cyprinus carpio).Aquaculture, 52: 31-33. doi: 10.1016/0044-8486(86)90104-3
Tabachek, J-A.L. 1988. The effect of feed particle size on the growth and feed efficiency of Artic charrr (Salvelinus alpinus L.) Aquaculture, 71: 319-330. doi: 10.1016/0044-8486(88)90201-3
Turk, M. 1994. Croatian freshwater fisheries in 1993. Ribarstvo, Zagreb, 52(3): 119-132.
Turk, M. 1995. Croatian freshwater fisheries in 1994. Ribarstvo, Zagreb, 53(3): 105-118.
Urán, P., Gonçalves, A., Taverne-Thiele, J.J., Schrama, J.W., Verreth, J.A.J. and Rombout, J.H.W.M. 2008. Soybean meal induces intestinal inflammation in common carp (Cyprinus carpio L.). Fish and Shellfish Immunology, 25: 751-760.
doi: 10.1016/j.fsi.2008.02.013
Urbánek, M. 2009. Influence of cereals feeding on produce parameters and quality of flesh in market carp farming. [in Czech]. PhD thesis. University of South Bohemia, České Budějovice, Czech Republic. Virk, P. and Saxena, P.K. 2003. Potential of amaranthus
seeds in supplementary feed and its impact on growth in some carps. Bioresource Technology, 86: 25-27. doi: 10.1016/S0960-8524(02)00139-6
Yamamoto, T., Shima, T., Furuita, H., Shiraishi, M., Javier Sánches-Vázques, F. and Tabata, M. 2001. Influence of decreasing water temperature and shortening of the light phase on macronutrient self-selection by rainbow trout Oncorhynchus mykiss and common carp
Cyprinus carpio. Fisheries Science, 67: 420-429. doi: 10.1046/j.1444-2906.2001.00260.x
Yamamoto, T., Shima T., Furuita, H., Sugita, T. and Suzuki, N. 2007. Effects of feeding time, water temperature, feeding frequency and dietary composition on apparent nutrient digestibility in rainbow trout
Oncorhynchus mykiss and common carp Cyprinus carpio. Fisheries Science, 73: 161-170.
doi: 10.1111/j.1444-2906.2007.01314.x