Ubiquitous Agriculture: Principles, Trends, Future Directions
Manas Kumar Yogi
2, L. Yamuna
21 & 2
Asst. Prof, Department of Computer Science and Engineering, Pragati Engineering College, Kakinada, India
Email – [email protected], [email protected]
1. INTRODUCTION:
Vertical farming is considered as one of the modern agricultural technique in the future urban area, in where most of the people are expected to live Agricultural farming took different forms over the millennium since the invention of agriculture in stone ages to which it finally reached the vertical farming and it may take different dimensions in the future, as the technologies are evolving nonstop. Computer technology during the last decade has numerous changes in the many fields. Looking back the evolution of the computer, in the early ages, the mainframe era was made a big evolution in which only expert accessed the computer. But today, the popular devices as laptops, tablets and Smartphone are owned and accessed by all ages. The third wave of computing (ubiquitous computing) is already upon us, leading to the departure of mainframe and personal computer. As per the recent study, the paradigm shift is evidently occurring from personal to ubiquitous computing in which the evolution of the data-centric application encapsulates the data environment to ontology based application with automated reasoning capabilities[1]).The term “ubiquitous” means “everywhere” and defined many of its attributes. One of the goals of ubiquitous computing is to enable devices to sense changes in their environment and to automatically adapt and act based on these changes and preferences.
2. PRINCIPLES:
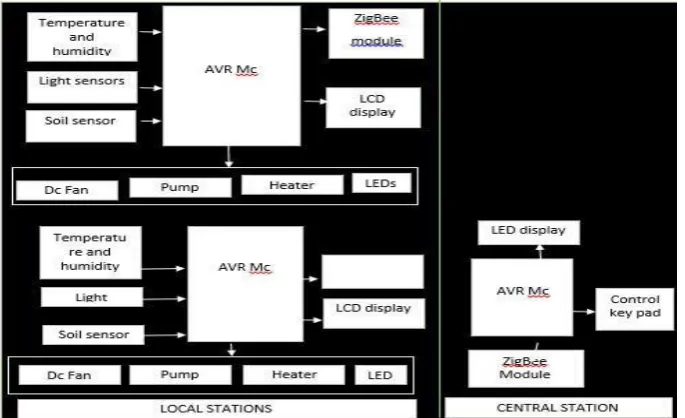
Farming is subjected to various levels of attack from a wide variety of microbes(viruses, bacteria) frequently therefore it leads to economic loss to avoid this we are using INTERNET OF THINGS (IOT) enabled with multiple devices like LED lamp, fans, watering system, heating system all these are observed and controlled by microclimate conditions it means check for appropriate climate condition to that particular product it monitors air, temperature ,humidity, leaf wetness it collects the data from sensors and send to Zigbee devices connects to the GPS for analyzing the information their by data is send to the master coordinator i.e., farmers or to care taker[2].
Fig 1: Architecture of the system
Abstract: Agriculture plays a vital role in India’s economy .It is the seventh largest agriculture product producer but according to the Economic survey 2015 growth in agri-GDP in FY15-16 is just 1.1 percent only. Agriculture sector in India contributes only 16 percentage of GDP and 10 percent of export earnings. Because of negative environmental effects in the form of depleting water table emission of greenhouse gases, and the contamination of surface and ground water it lead to the state of distress which is severely effecting peasants and marginal farmers to improve the productivity to 70 percentage. We present discussion in this paper about the introduction of ubiquitous agriculture concepts which helps to regulate the environmental effects by using different type of sensors mechanism.
A farmer can identify suitable crops for his land based on integrated soil, water, air analysis sensors collect weather data, which can be analyzed and shared with formers for planting more suitable crop.
Mechanized systems these can be used to speedily and accurately plant saplings in fields within the less by using smart vehicles with help of RESOURCE SHARING PLATFORM in this user can use smart tractors, ploughs by selecting required machine and can also lend or share his machine for planting.
Water and fertilizers distribution system: wirelessly connected sensors control water flow in fields this saves wastage and gets activates by intelligent diagnosis, only when the soils get dry because different species required different level of water.
Using excess of fertilizers effects yields so the data from the agriculture lands is going to observed by proficient experts including skillful farmers, researchers, specialists related in the field of agriculture for unknown effect but in remaining conditions crop care taker or former is going to be accessing the available data and providing requirements to the field and also we know that manual pesticide spraying will effect human but here we are using smart devices.
FIG 2:FLOW OF WATER, FERTILIZERS, PESTICIDES THROUGH PIPELINE
Weeds removal system : observing the crop growth and environmental conditions is not sufficient for more productivity use weeds removal system it is automated by sensors equipped control systems weeds removal system connected to sensors can automatically spot weeds and get rids of them .crop care can be designed based on predictive trends further based on analyzed data from the past
Harvesting machinery can be made into more efficient and automated system based on smart tech named agri Aware having Trust Label and Farmer Assistant, respectively for consumers and for farmers.
Crop grading and cleaning systems can be custom designed, improved and automated
Warehousing and crop transport system temperature, moisture and air quality control systems can be continuously monitored and managed to preserve the crop till reaches market because some crops like tomatoes, strawberries are delicate to handle. Overall diagram.
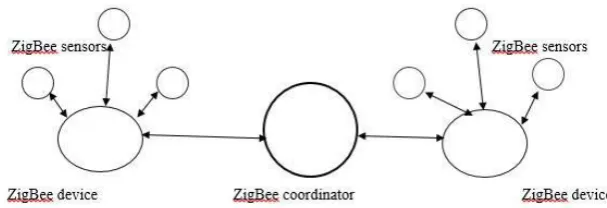
LAYER 1 (Zigbee sensor): It collect information from environmental sensors like hygrometer sensor for soil quality and inlet water, PH sensors, temperature sensor, humidity sensors and also get crop details by using crop status sensors group and all these sensors are controlled by Control Device Group Sensors communicate with the LoRa IoT[3]). device sends information to the cloud for storing information with separation historic data and current data according to user specification.
LAYER 2 (Zigbee device): At this level the data is classified into two type.
Greenhouse control data Crop growth engine
In greenhouse control data it consist of different crops information along with required temperature, water, humidity, light for better productivity and less prone to diseases and monitors the renewable energy use service, environmental control service , ventilation service, environmental monitoring services.
Crop growth sensors it compare with existed data in database to check the condition of the crop if the values are less then it enables intelligent diagnosis for using fertilizer or to use pesticides to regulate the growth with photosynthesis environmental service and automation irrigation service
Intelligent diagnosis algorithm
The intelligent diagnosis engine started to send the condition of the crop model and try to match the rules according to real time sensor data and the history data which is present cloud
The following are the intelligent diagnosis analysis steps Get data
Start diagnosis engine for matching
If it is matched with previous data stored in database Then simply diagnosed according to the rule prescribed Store current status and time in database //for further usage Else send to helpdesk i.e send to experts related to agriculture
Other condition because of any unfortunate condition occur then probability of occurrence is computed and diagnosed.
LAYER 3 (Zigbee coordinator): It provides communication among end user to place their product into the market and also cloud provides user application with internet connection for web services it is used for online transaction for rented machines, fertilizers, pesticides etc.
3. TRENDS:
Fig 4: Communication among sensors using Zigbee
ZIGBEE COORDINATOR DEVICE:
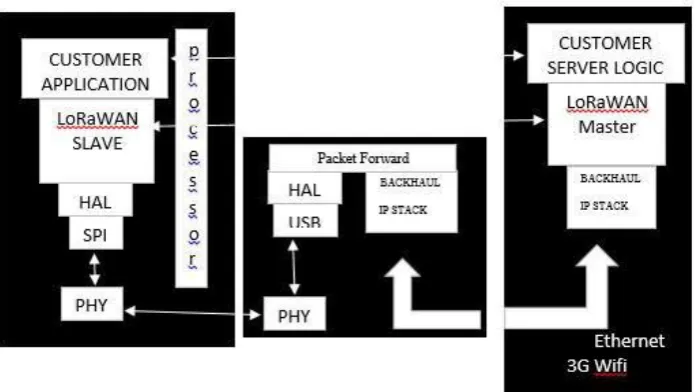
LoRaWAN network architecture is typically laid out in a star-of-stars topology in which gateways is a transparent bridge relaying messages between end-devices and a central network server in the backend. Gateways are connected to the network server via standard IP connections while end-devices use single-hop wireless communication to one or many gateways[5]). All end-point communication is generally bi-directional, but also supports operation such as multicast enabling software upgrade over the air or other mass distribution messages to reduce the on air communication time.
Communication between end-devices and gateways is spread out on different frequency channels and data rates. The selection of the data rate is a trade-off between communication range and message duration between the devices with the spread spectrum technology, communications with different data rates do not interfere with each other and create a set of "virtual" channels increasing the capacity of the gateway. LoRaWAN data rates range from 0.3 kbps to 50 kbps. To maximize both battery life of the end-devices and overall network capacity, the LoRaWAN network server is managing the data rate and RF output for each end-device individually by means of an adaptive data rate (ADR) scheme[6]).
National wide networks targeting internet of things such as critical infrastructure, confidential personal data or critical functions for the society has a special need for secure communication. This has been solved by several layer of encryption:
Unique Network key (EUI64) and ensure security on network level
Unique Application key (EUI64) ensure end to end security on application level
Device specific key (EUI128)
Fig 4: Communication among sensors and web service
The proposed middleware in this paper was implemented with Java and JSP languages, and provides services through Web, users can remotely login to the system via internet, browse and query all the information, including historical sensor data and alerting information, real-time sensor data and alerting information, expert knowledge, intelligent diagnosis and other services.
UI of the integrated system applying the proposed middleware.
The system UI (a) shows historical sensor data that can be queried according to users’ real requirement.
(b) Display real-time sensor data fluctuations such as illumination, temperature, humidity, etc. collected from the environment, at the same time, if an intelligent diagnosis or a real-time alerting is occurred, warning information is respectively displayed in the interface. In addition, (c) was implemented so as to allow managers to directly set a range of environmental parameters and event
Services so that it could provide intelligent diagnosis service such as automatic control of the environment, etc. and the notification service for dangerous situations.
(a) Historical data query (b) Real-time alerting
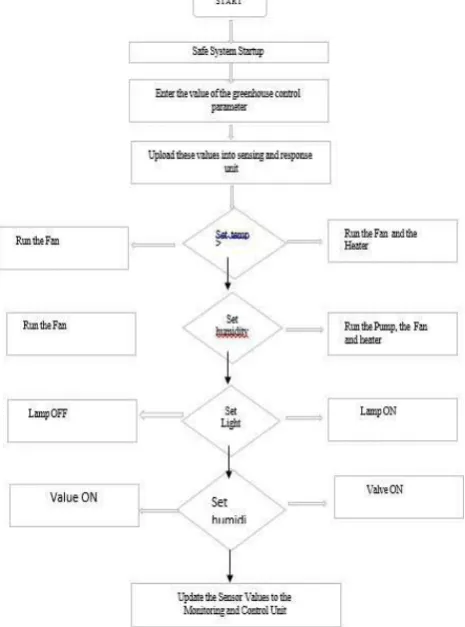
It follows step by step procedure while checking factors like temperature, water level, light, humidity in soil by setting their values using ON and OFF of the specified sensor according to micro conditional climate information about the agricultural product.
Fig 6: Flow Chart For Decision For Making
4. FUTURE CHALLENGES:
One of the major difficulties in this type of agriculture is not centralized but distributed in nature. The challenge is the exact location of the sensors should be carefully chosen. This poses problem when one sensor is not sufficient to measure the input data. A collection of sensors is needed in such case and we don’t have any decisive factor to finalize the count on number of sensors to be deployed in a specific location or area. The next challenge is about the privacy and security. When such a huge number of entities are connected, their interactions and communications should be more carefully scrutinized. First, data from one person’s sensor device must be distinguished from data from another’s. It is necessary to ask sure that false data is not intentionally injected by some other device, masquerading as a bonafide source for that information. Finally, it must be made sure difficult or impossible to steal someone else’sdata. Researchers are currently working on solving each of these problems in an effort to secure such networks. Yet another challenge is data backup for the service provider. Due to huge data injection and varied nature of data, from the view point of service provider’s data control can be an issue. It becomes expensive for the data center maintenance. This aspect cannot be ignored[4]).Yet another challenge is difficulty in integration of sensors and other hardware devices pose latency in operational time. For instance if a farmer does not get a message from the server database regarding changing climatic conditions then the very purpose of smart agriculture will be defeated. The issues should be ironed out in lowest level of design and has to be tested adequately.
5. CONCLUSION:
REFERENCES
1. J. Hwang and H. Yoe,: Study on the context-aware middleware for ubiquitous greenhouses using wireless
sensor networks, Sensors, vol. 11, no. 5, pp. 4539-4561, 2011.
2. J. Lee, H. Lee, J. Hwang, Y. Cho, C. Shin, and H. Yoe,: Design and implementation of wireless sensor
networks based paprika greenhouse system, (Communications in Computer and Information Science, vol. 78,
pp. 638-646, 2010.
3. M. Baek, M. Lee, H. Kim et al.,: A novel model for greenhouse control architecture, Grid and Pervasive
Computing, vol. 7861, pp. 262-269, 2013.
4. Y. Cho, K. Cho, C. Shin, J. Park, and E. Lee,: An agricultural expert cloud for a smart farm, Future
Information Technology, Application, and Service, vol. 164, pp. 657-662, 2012.
5. Wark, T.; Corke, P.; Sikka, P. et al.: Transforming Agriculture through Pervasive Wireless, Sensor Networks,
IEEE Pervasive Computing, 2007, 6 (2), pp. 50-57.
6. M.Mizoguchi, T. Ito, and S.Mitsuishi,: Ubiquitous monitoring of agricultural fields in Asia using wireless