The Thirty-First AAAI Conference on Innovative Applications of Artificial Intelligence (IAAI-19)
Feature Isolation for Hypothesis Testing in Retinal
Imaging: An Ischemic Stroke Prediction Case Study
Gilbert Lim,
1Zhan Wei Lim,
1Dejiang Xu,
1Daniel S.W. Ting,
2Tien Yin Wong,
2Mong Li Lee,
1Wynne Hsu
11School of Computing, National University of Singapore
2Singapore Eye Research Institute, Singapore National Eye Centre, Duke-NUS Medical School
Abstract
Ischemic stroke is a leading cause of death and long-term dis-ability that is difficult to predict reliably. Retinal fundus pho-tography has been proposed for stroke risk assessment, due to its non-invasiveness and the similarity between retinal and cerebral microcirculations, with past studies claiming a cor-relation between venular caliber and stroke risk. However, it may be that other retinal features are more appropriate. In this paper, extensive experiments with deep learning on six retinal datasets are described. Feature isolation involving segmented vascular tree images is applied to establish the effectiveness of vessel caliber and shape alone for stroke classification, and dataset ablation is applied to investigate model generalizabil-ity on unseen sources. The results suggest that vessel caliber and shape could be indicative of ischemic stroke, and source-specific features could influence model performance.
Introduction
Ischemic stroke is an emergency medical condition charac-terized by a reduction of blood supply to the brain due to a blocked artery. Stroke is the fifth-leading cause of death in the United States, accounting for over 5% of deaths, and is a leading cause of long-term disability (Benjamin et al. 2018). While there exist evidence-based guidelines for assessing stroke risk, many of the recommendations involve special-ized tests, with general population-level genetic screening currently not recommended.
Given the widespread prevalence of ischemic stroke and the relative inability to predict its occurrence as of the present, it is tempting to explore other modalities for pur-poses of stroke risk assessment. One such modality is reti-nal imaging, which has the attraction of being a non-invasive and cost-effective procedure that has the potential to be broadly deployed. Further, previous studies have ob-served correlations between vascular features and incidence of stroke (Baker et al. 2010). With the recent successes of deep learning in medical imaging classification tasks (Lit-jens et al. 2017), it is only natural to ask whether this model paradigm might also be applicable to stroke prediction.
An enduring criticism of deep neural network models has however been their lack of interpretability, which is of particular concern for clinical tasks (Caruana et al. 2015).
Copyright c2019, Association for the Advancement of Artificial Intelligence (www.aaai.org). All rights reserved.
Stroke risk prediction, as opposed to general risk factor pre-diction, poses an additional difficulty in that images for pos-itive cases are hard to come by. In particular, for the pur-poses of this study, patients and images positive for ischemic stroke could only be drawn from a single source, the Multi-Centre Retinal Stroke (MCRS) study (De Silva et al. 2009). This rarity of condition-specific data is not uncommon in the medical domain. Negative data was relatively abundant, and could be obtained from multiple sources.
However, this naturally raises a question of the trained models: did they actually learn what they were expected to (stroke vs. non-stroke), or did they learn something inciden-tal? Put another way, there may be some combination of fea-tures (e.g. ethnicity, camera characteristics, compression ar-tifacts, etc) that coincide with the stroke-positive/negative divide in the training data. If so, it is plausible that the model will instead learn these non-stroke-relevant features, especially if they happen to be more discriminative to the deep neural network architecture. Specifically, for this stroke prediction task, the source domain involves labeled nega-tive data from multiple datasets, but labeled posinega-tive data from just a single dataset. However, the desired target do-main would involve the classification of data from multi-ple datasets in general. Since the source and target domains are not truly the same, a classifier trained on the source do-main may not fully apply to data from the target dodo-main. This problem is known asdomain shiftin machine learning (Qui˜nonero-Candela et al. 2009).
A standard response to domain shift would be to per-form domain adaptation, for example through preprocessing or transferring statistics between the source and target do-mains (Sun, Feng, and Saenko 2016). However, in this case, a proper evaluation of domain adaptation is not possible, be-cause of the lack of even unlabeled positive data in the target domain. As such, we set out to estimate possible upper and lower performance bounds on the stroke risk prediction task, by performingdataset ablation, to examine the sensitivity of model performance to variance in the training datasets.
stan-dardizing optical coherence tomography images from dif-ferent sources, before performing classification on the ab-stracted segmentation map (De Fauw et al. 2018).
We believe that this experimental methodology addresses two issues that may not have been fully appreciated in the lit-erature. First, the performance of machine learning models on out-of-set data is often not fully explored. In particular, the contribution of different data subsets within the training data may not be comprehensively analyzed. Standard cross-validation for example attempts to assess model generaliz-ability, but does not realistically model true out-of-set data, since training data is collated from all sources (i.e. valida-tion data for each cross-validavalida-tion fold already contains data from all sources). A more conservative estimate of model generalizability is therefore obtained by explicitly training and validating models on non-overlapping data sources.
Second, the precise attribution of clinical decision is ex-tremely important, for clinical decision support systems to be accepted (Shortliffe and Sep´ulveda 2018). Existing end-to-end deep neural network architectures have been widely criticized as black boxes possibly exhibiting unexpected be-haviour, as in the case of adversarial images. One workable approach to counter this would then be to first identify and isolate relevant features – in this case the retinal vascular tree – considering domain knowledge, and utilize them as auditable intermediate goals (Lim, Hsu, and Lee 2018). This guarantees that model performance is obtained only from the isolated features, rather than merely retrospectively claimed to be such from saliency map analysis.
This case study on stroke risk prediction describes an at-tempt to mitigate interpretability and generalizability issues by constraining the input information available to the mod-els, and in this manner aims to offer insights to the challenge of establishing generalizable results in real-world medical prediction tasks (Trucco et al. 2013).
Related Work
There exists a rich literature on the association of retinal blood vessel features with stroke risk, motivated by simi-larities between retinal and cerebral microcirculations. Pre-vious studies have generally tended towards the extraction of intermediate summary features from retinal photographs, such as vessel caliber and nicking (Baker et al. 2010), with a meta-analysis suggesting that wider retinal venular caliber is related to increased risk of stroke (McGeechan et al. 2009). Such studies depend on vessel type (artery/vein) being iden-tified for the major vessels (Xu et al. 2018), and their mea-surements taken with specialized software (Lau et al. 2014) for further statistical analysis.
However, it remains uncertain whether these handpicked summary features are in fact the most suitable for the stroke risk prediction task. End-to-end deep learning attempts to automate the intermediate feature selection process, and has usually been demonstrated to yield superior performance as compared to handpicked features. Deep neural network models applied to retinal imaging have exhibited perfor-mance comparable to human graders in classifying for con-ditions such as referable diabetic retinopathy (Gulshan et al.
2016; Ting et al. 2017), as well as age-related macular de-generation and glaucoma (Ting et al. 2017).
An important distinction between the abovementioned classification tasks, and the stroke prediction task described here, is that the classification tasks could be performed by human graders. In each case, there existed well-established visual grading guidelines against which human graders could be trained and assessed. Therefore, it is known that a working model should be attainable in principle, if only by reproducing the human procedure. For example, since dia-betic retinopathy is graded based on the presence and quan-tity of lesions such as microaneurysms, haemorrhages and exudates, each with their own distinct appearance, much ear-lier work had been devoted to individually identifying and counting such lesions, before applying the specified guide-lines (Niemeijer et al. 2010; Lim et al. 2014).
There is in contrast no such assurance for stroke predic-tion, from the inability of human experts to reliably diag-nose stroke from retinal photographs, as far as is known. The closest work on this front is then on the prediction of car-diovascular risk factors from retinal photographs (Poplin et al. 2018), where it was unknown beforehand whether it was possible to deduce risk factors such as age, gender, smoking status and body mass index solely from retinal photographs. Using a development set – of over 1.7 million images – and a clinical validation set drawn from the same two sources (UK Biobank and EyePACS), the authors discovered near-perfect predictive ability for gender, and significantly better-than-baseline predictions for most other targeted risk factors.
Methodology
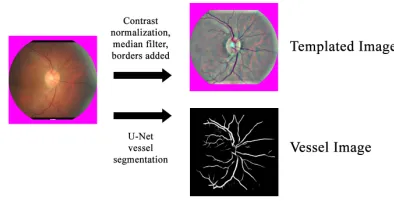
Figure 1 summarizes the preprocessing that we carried out to standardize the input to the models. All images had their central circular portion, corresponding to the actual retina, detected and mapped to a 512x512 pixel template.
Figure 1: Retinal image preprocessing procedure
the vascular tree (vessel mask) with a U-Net implementation (Orobix 2016; Ronneberger, Fischer, and Brox 2015). These are referred to asvesselimages.
Model Architecture.A 19-layer VGGNet architecture
(Si-monyan and Zisserman 2015) as described in (Ting et al. 2017) was used for all experiments, with the exception of the output layer now consisting of two nodes, representing the stroke-positive and stroke-negative class respectively. As such, the predicted value of the stroke-positive output node, given an input image, can be interpreted as some measure of stroke risk for the patient corresponding to that image. The models were trained with a batch size of 32, base learning rate of 0.001 and momentum of 0.9, with a step decay of 0.98 every 1000 iterations. Xavier initialization (Glorot and Bengio 2010) of node weights was used, with preliminary experiments suggesting that model performance is robust as to model architecture (e.g. ResNet), usage of pretrained model weights and training parameters.
Datasets.Table 1 shows the six retina image datasets used.
Images positive for ischemic stroke were obtained from the MCRS study, which consisted of patients from Singapore, Sydney and Melbourne. No negative images were available from this study. Images negative for ischemic stroke were drawn from five datasets: the Singapore Chinese Eye Study dataset (SCES), the Singapore Malay Eye Study dataset (SiMES), the Singapore Indian Eye Study dataset (SiNDI), the Diabetic Management Programme (Melbourne) dataset (DMPMelb) and the Singapore Prospective Study Program dataset (SP2). The number of negative images was set to roughly match that of the available positive images. All im-ages thus selected were then filtered for being optic disc (OD) centered, to ensure presence of the major vessels.
Dataset templated matched
#images
vessel pixels mean (std.
dev)
#images
vessel pixels mean (std.
dev)
Stroke-positive
MCRS 4528 10127 (6872) 972 9971 (1492)
Stroke-negative
SCES 1751 15160 (5959) 268 10403 (1375)
SiMES 1488 15954 (6542) 188 10231 (1414)
SiNDI 1662 15199 (6311) 238 10272 (1396)
DMPMelb 715 12156 (6337) 165 10207 (1380)
SP2 1006 13735 (5360) 206 10140 (1412)
Table 1: Datasets Summary
We observe that there is a wide variance in the appearance of the vessel images in terms of thresholded vessel mask density, possibly due to differences between the dataset im-ages and the imim-ages that the U-Net segmentation model was trained on. As such, a subset of each dataset was defined such that the distribution of vessel mask pixels was similar, by filtering for only vessel images with 10000±2500 ves-sel mask pixels each. These subsets are referred to as the
matchedsubsets of each dataset.
Experiments
For each dataset, we split the images into a development set, and a test set. The development set is itself split into a training set of images that are shown to the model, and a validation set that is used to derive early stopping and op-erating point thresholds. Images were randomly assigned to the training, validation and test sets, subject to the constraint that there is no overlap at patient level. The distribution of images is approximately 80% for the training set, 5% for the validation set, and 15% for the test set.
Three sets of experiments were carried out on four types of input images: all templated images (TA), templated im-ages matched for vessel mask pixels (TM), all vessel imim-ages (VA) and and vessel images matched for vessel mask pix-els (VM). Data augmentation was implemented through the random flipping and rotation of input images.
The first set of experiments (E-All) used all six datasets. During training, stroke-positive and stroke-negative images were sampled in equal proportion. Model performance in terms of AUC was evaluated on the validation set every 500 iterations, and early stopping applied to limit overfitting once marginal improvement (a change in validation AUC of magnitude less than 0.005) had been observed over the previous iterations. A model operating point threshold was then picked using model performance on the validation set to balance sensitivity and specificity. The models were then evaluated on the test sets.
The second set of experiments (E-Split1) drew negative-stroke training and validation images from only SCES, SiMES and SiNDI datasets, whereas the third set of exper-iments (E-Split2) drew negative-stroke training and valida-tion images from only DMPMelb and SP2 datasets. These negative-stroke subsets were chosen based on their similar vessel pixel distributions. Both E-Split1 and E-Split2 used stroke-positive images from the MCRS dataset.
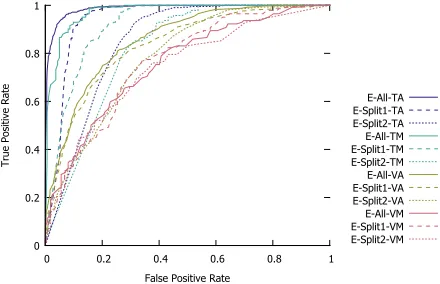
Performance of Model for Stroke Prediction
Figure 2 shows the ROC curves for the respective models obtained in the 3 sets of experiments. We observe that the model from the first set of experiments trained on the tem-plated images (E-All-TA) gives the best AUC.
0 0.2 0.4 0.6 0.8 1
0 0.2 0.4 0.6 0.8 1
True Positive Rate
False Positive Rate
E-All-TA E-Split1-TA E-Split2-TA E-All-TM E-Split1-TM E-Split2-TM E-All-VA E-Split1-VA E-Split2-VA E-All-VM E-Split1-VM E-Split2-VM
Test Set
Exp Type All Split1 Split2 SCES SiMES SiNDI DMPMelb SP2 Validation Iter α
E-All TA 0.972 0.890 (0.987) 0.972 0.893 (0.986) 0.972 0.880 (0.986) 0.972 0.903 (0.988) 0.972 1.000 (0.998) 0.972 0.783 (0.970) 0.972 0.703 (0.966) 0.972 1.000 (0.996) 0.921 0.923 (0.978) 14000 0.43 TM 0.993 0.827 (0.970) 0.993 0.779 (0.961) 0.993 0.914 (0.978) 0.993 0.789 (0.947) 0.993 0.931 (0.976) 0.993 0.649 (0.936) 0.993 0.808 (0.952) 0.993 1.000 (0.984) 0.840 0.821 (0.864) 11000 0.30 VA 0.818 0.729 (0.855) 0.818 0.760 (0.869) 0.818 0.641 (0.811) 0.818 0.681 (0.826) 0.818 0.955 (0.960) 0.818 0.662 (0.828) 0.818 0.406 (0.667) 0.818 0.800 (0.906) 0.667 0.663 (0.750) 15500 0.35 VM 0.753 0.611 (0.754) 0.753 0.615 (0.751) 0.753 0.603 (0.749) 0.753 0.421 (0.627) 0.753 0.828 (0.847) 0.753 0.649 (0.777) 0.753 0.423 (0.655) 0.753 0.750 (0.811) 0.700 0.643 (0.730) 6000 0.45 E-Split1 TA 0.973 0.842 (0.940) 0.973 0.921 (0.990) 0.973 0.614 (0.796) 0.973 0.926 (0.991) 0.973 1.000 (0.994) 0.973 0.842 (0.978) 0.973 0.079 (0.496) 0.973 0.973 (0.994) 0.912 0.926 (0.966) 18500 0.22 TM 0.965 0.741 (0.914) 0.965 0.798 (0.950) 0.965 0.638 (0.849) 0.965 0.816 (0.950) 0.965 0.897 (0.972) 0.965 0.703 (0.914) 0.965 0.192 (0.662) 0.965 1.000 (0.984) 0.860 0.829 (0.891) 9000 0.52 VA 0.819 0.696 (0.833) 0.819 0.760 (0.862) 0.819 0.510 (0.746) 0.819 0.739 (0.841) 0.819 0.799 (0.902) 0.819 0.746 (0.846) 0.819 0.307 (0.628) 0.819 0.647 (0.823) 0.681 0.678 (0.733) 7000 0.45 VM 0.810 0.574 (0.759) 0.810 0.625 (0.795) 0.810 0.483 (0.685) 0.810 0.316 (0.650) 0.810 1.000 (0.941) 0.810 0.649 (0.802) 0.810 0.269 (0.516) 0.810 0.656 (0.808) 0.720 0.657 (0.722) 14500 0.55 E-Split2 TA 0.995 0.485 (0.846) 0.995 0.345 (0.798) 0.995 0.884 (0.984) 0.995 0.117 (0.830) 0.995 0.960 (0.997) 0.995 0.017 (0.575) 0.995 0.792 (0.974) 0.995 0.947 (0.983) 0.968 0.988 (0.992) 7500 0.46 TM 0.979 0.463 (0.815) 0.979 0.250 (0.717) 0.979 0.845 (0.983) 0.979 0.053 (0.604) 0.979 0.793 (0.961) 0.979 0.027 (0.636) 0.979 0.885 (0.970) 0.979 0.813 (0.964) 0.960 1.000 (0.955) 7000 0.35 VA 0.840 0.579 (0.779) 0.840 0.508 (0.737) 0.840 0.785 (0.897) 0.840 0.362 (0.671) 0.840 0.924 (0.957) 0.840 0.275 (0.602) 0.840 0.584 (0.806) 0.840 0.920 (0.956) 0.782 0.798 (0.870) 16000 0.07 VM 0.697 0.673 (0.740) 0.697 0.615 (0.699) 0.697 0.776 (0.806) 0.697 0.421 (0.586) 0.697 0.931 (0.873) 0.697 0.568 (0.657) 0.697 0.654 (0.724) 0.697 0.875 (0.859) 0.720 0.714 (0.778) 17500 0.16
Table 2: Detailed Experimental Results. Sensitivity (first value), specificity (second value), and AUC (in bracket) are obtained using the corresponding thresholdαfor each model.
Dataset Ablation Analysis.Table 2 gives the complete
ex-perimental results. The E-All-TA model has the best perfor-mance with AUC≥0.966. The E-Split1-TA model has good performance on the held-out test images (AUC =0.990). However, performance on unseen images were mixed, with excellent performance on SP2 (AUC = 0.994) but poor performance on DMPMelb (AUC =0.496). One explana-tion could be SP2 is a Singapore-based source, the same as SCES, SiMES and SiNDI. As such, the E-Split1-TA model learnt to classify the negative class based on the general features of the Singapore-based sources. Similarly, the E-Split2-TA model gives good performance on the held-out test images with AUC=0.984, but performance on unseen sources were mixed: SCES (AUC=0.830), SiMES (AUC
0 0.02 0.04 0.06 0.08 0.1 0.12
E-All E-Split1 E-Split2
Change in AUC, All vs. Matched
Experiment
Template Vessel
Figure 3: Effect of feature isolation on AUC
=0.997) and SiNDI (AUC=0.575).
Feature Isolation Analysis.We minimize the possible
con-founding influence of source-specific features by performing feature isolation to segment the vessels. We observe that the performances in the E-All experiments are consistent across all datasets. For the models trained using different image types, the overall performance was reduced from an AUC
=0.987 for TA to AUC=0.970 for TM, to AUC=0.855 for VA, and finally to AUC=0.754 for VM.
Figure 3 shows the impact of feature isolation on AUC. Closer examination reveals that the performance loss for E-All-TM against E-All-TA was much smaller compared to
0.08 0.1 0.12 0.14 0.16 0.18 0.2 0.22
TA TM VA VM
Change in AUC, seen vs. unseen
Test Data Source Type
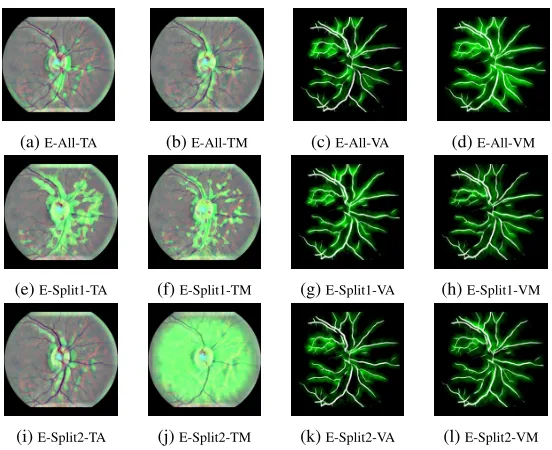
(a)E-All-TA (b)E-All-TM (c)E-All-VA (d)E-All-VM
(e)E-Split1-TA (f)E-Split1-TM (g)E-Split1-VA (h)E-Split1-VM
(i)E-Split2-TA (j)E-Split2-TM (k)E-Split2-VA (l)E-Split2-VM
Figure 5: Example model visualizations
that between E-All-VM and E-All-VA, suggesting that the quantity of vessel pixels in the vessel images is indeed a dis-tinguishing factor that should be normalized across datasets. We also investigate the effect of feature isolation on the generalizability of these models. Figure 4 shows the change in AUC for seen vs. unseen data, for each set of experiments. A smaller change in AUC indicates better generalizability in terms of more stable model performance. In aggregate, using vessel images produces improved generalizability, as evidenced by the smaller values for VA/VM as compared to TA/TM. Of particular note is the performance for the SiNDI test set (see Table 2), which improved from 0.636 for TM, to 0.657 for VM, despite performance being expected to be poorer for VM compared to TM in general.
Overall, even under the feature isolation regime, the mod-els managed to achieve an AUC of at least 0.685 for un-seen sources (E-Split1-VM on Split2: AUC = 0.685, E-Split2-VM on Split1: AUC = 0.699), which supports the hypothesis that ischemic stroke might be indicated by vas-cular data alone. We confirm this by utilizing the gradient-weighted class activation mapping (Grad-CAM) (Selvaraju et al. 2017) to visualize the saliency maps. Figure 5 shows that retinal vessel appearance is involved in distinguishing between classes.
Discussion
From the dataset ablation analysis, it was found that model classification performance on within-set negative data was consistently better than on out-of-set negative data, suggest-ing that the trained models may indeed be overfittsuggest-ing on characteristics unrelated to any actual features manifested by the mechanism of stroke risk. In other words, the tem-plated image data may exhibit environment-specific differ-entiating features that significantly help to distinguish be-tween the stroke-positive and stroke-negative classes.
From the feature isolation analysis, it was found that the segmented vascular tree alone remained predictive of stroke risk, as indicated by the medical literature. Raw classifica-tion performance dropped for vessel images as compared to template images, with the difference in performance plau-sibly attributable to the additional information contained by the template images. However, some of the features learnt from this additional information might be environment-specific, and not condition-environment-specific, and therefore spurious for stroke risk prediction. This is supported by the perfor-mance of vessel image models generally being more stable on out-of-set test data, in the sense of sensitivity/specificity being closer to being balanced at the validation threshold.
The major limitation of this study pertains to the na-ture of the datasets, in particular the availability of stroke-positive images from only a single source. Much of the experimental effort has therefore been expended in either attempting to quantify its impact on model generalizabil-ity by dataset ablation, or attempting to compensate by minimizing the effect of non-critical appearance features with vessel images. This issue is exacerbated by the rel-atively small quantity of stroke-positive image data avail-able. Previous major disease classification and risk fac-tor prediction studies using deep neural network models on retinal images (Gulshan et al. 2016; Ting et al. 2017; Poplin et al. 2018) involved hundreds of thousands to mil-lions of images, with large initial performance gains as the quantity of training images increased (Gulshan et al. 2016). In future work, we hope to more conclusively validate the possibility of stroke risk prediction using a wider variety of image data for each class, and against other methods.
Conclusion
con-siderable medical interest. Initial experiments were encour-aging, and achieved excellent performance on the test set. However, due to the nature of the stroke-positive images be-ing derived from a sbe-ingle source, feature isolation by vas-cular tree extraction and dataset ablation were attempted to quantify the influence of these factors on performance. It was found that model performance was not wholly gener-alizable to images from unseen sources, although vessel im-ages alone remained discriminative of ischemic stroke.
Acknowledgements
This work was supported by grant R-252-000-A19-490.
References
Baker, M. L.; Hand, P. J.; Liew, G.; Wong, T. Y.; Rochtchina, E.; Mitchell, P.; Lindley, R. I.; Hankey, G. J.; Wang, J. J.; and the Multi-Centre Retinal Stroke Study Group. 2010. Retinal microvas-cular signs may provide clues to the underlying vasculopathy in pa-tients with deep intracerebral hemorrhage.Stroke41(4):618–623. Benjamin, E. J.; Virani, S. S.; Callaway, C. W.; Chamberlain, A. M.; Change, A. R.; Cheng, S.; Chiuve, S. E.; Cushman, M.; Delling, F. N.; Deo, R.; de Ferranti, S. D.; Ferguson, J. F.; et al. 2018. Heart disease and stroke statistics – 2018 update: a report from the american heart association. Circulation137(12):e67– e492.
Caruana, R.; Lou, Y.; Gehrke, J.; Koch, P.; Sturm, M.; and Elhadad, N. 2015. Intelligible models for healthcare: Predicting pneumonia risk and hospital 30-day readmission. InACM SIGKDD, 1721– 1730.
De Fauw, J.; Ledsam, J. R.; Romera-Paredes, B.; Nikolov, S.; Tomasev, N.; Blackwell, S.; Askham, H.; Glorot, X.; O’Donoghue, B.; Visentin, D; van den Driessche, G.; Lakshminarayan, B.; Meyer, C.; Mackinder, F.; Bouton, S.; et al. 2018. Clinically ap-plicable deep learning for diagnosis and referral in retinal disease. Nature Medicine24:1342–1350.
De Silva, D. A.; Liew, G.; Wong, M.-C.; Chang, H. M.; Chen, C.; Wang, J. J.; Baker, M. L.; Hand, P. J.; Rochtchina, E.; Liu, E. Y.; Mitchell, P.; Lindley, R. I.; and Wong, T. Y. 2009. Retinal vas-cular caliber and extracranial carotid disease in patients with acute ischemic stroke: the multi-centre retinal stroke (mcrs) study.Stroke 40(12):3695–3699.
Glorot, X., and Bengio, Y. 2010. Understanding the difficulty of training deep feedforward neural networks. InAISTATS, 249–256. Gulshan, V.; Peng, L.; Coram, M.; Stumpe, M. C.; Wu, D.; Narayanaswamy, A.; Venugopalan, S.; Widner, K.; Madams, T.; Cuadros, J.; Kim, R.; Raman, R.; Nelson, P. C.; Mega, J. L.; and Webster, D. R. 2016. Development and validation of a deep learn-ing algorithm for detection of diabetic retinopathy in retinal fundus photographs.JAMA316(22):2402–2410.
Lau, Q. P.; Lee, M. L.; Hsu, W.; and Wong, T. Y. 2014. The Singa-pore eye vessel assessment system. Image Analysis and Modeling in Ophthalmology143–160.
Lim, G.; Lee, M. L.; Hsu, W.; and Wong, T. Y. 2014. Trans-formed representations for convolutional neural networks in dia-betic retinopathy screening. InAAAI Workshop on Modern Artifi-cial Intelligence for Health Analytics (MAIHA), 34–38.
Lim, G.; Hsu, W.; and Lee, M. L. 2018. Intermediate goals in deep learning for retinal image analysis. InACCV Workshop on AI for Retinal Image Analysis (AIRIA).
Litjens, G.; Kooi, T.; Bejnordi, B. E.; Setio, A. A. A.; Ciompi, F.; Ghafoorian, M.; van der Laak, J. A. W. M.; van Ginneken, B.; and Sanchez, C. I. 2017. A survey on deep learning in medical image analysis.Medical Image Analysis42:60–88.
McGeechan, K.; Liew, G.; Macaskill, P.; Irwid, L.; Klein, R.; Klein, B. E. K.; Wang, J. J.; Mitchell, P.; Vingerling, J. R.; do Jong, P. T. V. M.; Witteman, J. C. M.; Breteler, M. M. B.; Shaw, J.; Zim-met, P.; and Wong, T. Y. 2009. Prediction of incident stroke events based on retinal vessel caliber: a systematic review and individual-participant meta-analysis. American Journal of Epi-demiology170(11):1323–1332.
Niemeijer, M.; van Ginneken, B.; Cree, M. J.; Mizutani, A.; Quel-lec, G.; Sanchez, C. I.; Zhang, B.; Hornero, R.; Lamard, M.; Mu-ramatsu, C.; Wu, X.; Cazuguel, G.; You, J.; Mayo, A.; Li, Q.; Hatanaka, Y.; Cochener, B.; Roux, C.; Karray, F.; Garcia, M.; Fu-jita, H.; and Abramoff, M. D. 2010. Retinopathy online challenge: automatic detection of microaneurysms in digital color fundus pho-tographs.IEEE Transactions on Medical Imaging29(1):185–195. Orobix. 2016. Retina blood vessel segmentation with a convolution neural network. https://github.com/orobix/retina-unet.
Poplin, R.; Varadarajan, A. V.; Blumer, K.; Liu, Y.; McConnell, M. V.; Corrado, G. S.; Peng, L.; and Webster, D. R. 2018. Prediction of cardiovascular risk factors from retinal fundus photographs via deep learning.Nature Biomedical Engineering2(3):158.
Qui˜nonero-Candela, J.; Sugiyama, M.; Schwaighofer, A.; and Lawrence, N. D. 2009. Dataset Shift in Machine Learning. MIT Press.
Ronneberger, O.; Fischer, P.; and Brox, T. 2015. U-net: Convolu-tional networks for biomedical image segmentation. InMICCAI, 234–241.
Selvaraju, R. R.; Cogswell, M.; Das, A.; Vedantam, R.; Parikh, D.; and Batra, D. 2017. Grad-cam: Visual explanations from deep networks via gradient-based localization. InICCV, 618–626. Shortliffe, E. H., and Sep´ulveda, M. J. 2018. Clinical decision support in the era of artificial intelligence. JAMA320(21):2199– 2200.
Simonyan, K., and Zisserman, A. 2015. Very deep convolutional networks for large-scale image recognition. InICLR.
Sun, B.; Feng, J.; and Saenko, K. 2016. Return of frustratingly easy domain adaptation. InAAAI, 2058–2065.
Ting, D. S. W.; Cheung, C. Y.; Lim, G.; Tan, G. S. W.; Quang, N. D.; Gan, A.; Hamzah, H.; Garcia-Franco, R.; San Yeo, I. Y.; Lee, S. Y.; Wong, E. Y. M.; Sabanayagam, C.; Baskaran, M.; Ibrahim, F.; Tan, N. C.; Finkelstein, E. A.; Lamoureux, E. L.; Wong, I. Y.; Bressler, N. M.; Sivaprasad, S.; Vama, R.; Jonas, J. B.; He, M. G.; Cheng, C. Y.; Cheung, G. C. M.; Aung, T.; Hsu, W.; Lee, M. L.; and Wong, T. Y. 2017. Development and validation of a deep learning system for diabetic retinopathy and related eye diseases using retinal images from multiethnic populations with diabetes. JAMA318(22):2211–2223.
Trucco, E.; Ruggeri, A.; Karnowski, T.; Giancardo, L.; Chaum, E.; Hubschman, J. P.; Al-Diri, B.; Cheung, C. Y.; Wong, D.; Abramoff, M.; Lim, G.; Kumar, D.; Burlina, P.; Bressler, N. M.; Jelinek, H. F.; Meriaudeau, F.; Quellec, G.; Macgillivray, T.; and Dhillon, B. 2013. Validating retinal fundus image analysis algorithms: issues and a proposal. Investigative Ophthalmology & Visual Science 54(5):3546–3559.