Abstract — Nowadays, video games such as Massively Multiplayer Online Game (MMOG) have become cultural mediators. Mobile games contribute to a large number of downloads and potential benefits in the applications market. Although processing power of mobile devices increases the bandwidth transmission, a poor network connectivity may bottleneck Gaming as a Service (GaaS). In order to enhance performance in digital ecosystem, processing tasks are distributed among thin client devices and robust servers. This research is based on the method ‘divide and rule’, that is, volumetric surfaces are subdivided using a tree-KD of sequence of scenes in a game, so reducing the surface into small sets of points. Reconstruction efficiency is improved, because the search of data is performed in local and small regions. Processes are modeled through a finite set of states that are built using Hidden Markov Models with domains configured by heuristics. Six test that control the states of each heuristic, including the number of intervals are carried out to validate the proposed model. This validation concludes that the proposed model optimizes response frames per second, in a sequence of interactions.
Keywords — Distribution render; Mobile devices; Hidden Markov models; Gaming as a service.
I. INTRODUCTION
OWADAYS, a vast network of recognized media, such as television, internet, game consoles, smartphones, tablets and desktop devices create new ways to play, to express oneself, learn, explore ideas and generate culture.
Computers are used as mediators in the learning process through play and social interaction. An example is the Massively Multiplayer Online Game (MMOG). In some scenarios, these games are considered an educational platform, because they allow players to learn together through personal interaction in a cooperative process. Recent studies reveal that, with the continued use of this type of games [1, 2, 3, 4], several learning processes are achieved (when creating a virtual identity, for instance).
Recent trends in mobile computing have truly commoditized a large number of components required for immersive virtual reality [3, 5]. Current thin client devices, such as smartphones and tablets, represent a renaissance in
mobile computing. With gaming as a driver for the adoption of mobile graphics chipsets, these devices package unprecedented graphics dealing with position/orientation sensing, wireless networking, and high resolution displays. Such systems provide unique opportunities for constructing low-cost and mobile virtual reality systems [6].
Mobile games contribute to a huge number of downloads and, consequentially, to potential profits in the application market. However, although the processing power of mobile devices, as well as the transmission bandwidth is increasing, the unstable network connectivity may bottleneck the providing of Gaming as a Service (GaaS) for mobile devices. The hardware constraints of mobile devices, such as computational power, storage and battery, limit the representation of games [7].
Therefore, there is a need to reduce content and processing requirements, as well as to maintain control of storage and communication between users. For the mobile clients, one of the most problematic tasks is the presentation of the 3D Virtual Reality data. According to the 3D Virtual Reality data, the client has to calculate the position of objects, the lightning and shadows. This is a difficult task to perform with weak processors and a low main memory. In complex scenes, a high processing power is needed to process all data in nearly real time. A solution for this problem is the consumption of the processing task not on the client [8].
Render has significant features since there are a variety of methods to perform these virtual 3D graphics. In terms of software highlights there are four main algorithms: scanline rendering and rasterization, ray casting, ray tracing, and radiosity. Each of these algorithms is focused as a fundamental part in representing complex images, either by means of the light beam, or grouping pixels to reduce computer processing, or calculating the passage of light, etc. [9]. It must be taken into account that these processes also depend on the geometry applied in each algorithm.
Aside from the request processing with 3D content, it is also important to control the storage of data generated by applications and their communication in order to achieve decent interactivity between geographically dispersed users. Data are not centralized on a single server; therefore control is needed over scalability and fault tolerance to provide a
An Architecture Approach for 3D Render
Distribution using Mobile Devices in Real
Time
Holman Diego Bolívar
1, John Alexander Velandia
1, Jenny Natalia Torres
1, Elena Giménez de Ory
21
Faculty of Engineering, Universidad Católica de Colombia, Bogotá D.C, Colombia
2School of Engineering, La Rioja, Spain
response to user requests [10]. Moreover, having a distributed system is an advantage for processing and user control.
A Platform as a Service (PaaS) allows virtualized computing resources via internet or advanced networks, allowing transparent use of resources. Along with offering storage services and computer processing, PaaS is built with Internet standards and protocols such as HTTP. A PaaS combines quality of service and broadcast functions distributed with capabilities in parallel processing. Together, these features create a platform for development software, designed specifically for network applications that produce and consume massive amounts of digital media. Thus, it is necessary to identify the technological architecture for gaming.
The reminder of this paper is organized as follows: section II summarizes the related work in industry and academy, and section III studies the process of subdivision surfaces to be held inside a mobile device. Section IV presents a model, including its architecture for distributed rendering based on hidden Markov model. The proposed model is assessed using performance tests according to frames per second. Section V presents the results of assessing the model, and section VI concludes our work, including future work to be developed from this research.
II.RELATED WORKS
Render 3D is used today to display molecular orbitals in the analysis of results of simulations of quantum chemistry [11], for dynamic medical evaluations, analysis of complex information models associated with medical training, management of geographically referenced information, and in the searching of extraterrestrial intelligence, among many other uses. [12]. In recent years, the performance and capacity of graphics processing units have improved dramatically, thanks to the parallelization of computational tasks [13], but an efficient operation of large capacities of parallelism, allowing a linear acceleration along with multiple compute nodes are still required [14], for they would optimize the graphics processing level data volume with polynomial complexity.
The display group NERSC and Lawrence Berkeley National Laboratory (LBNL) have developed the Visapult tool to attack these problems. Visapult is an application of parallel distributed processing that leverages the resources of computer networks and the processing power of supercomputers. Renders for volume ray tracing and traditional series can take many minutes or hours. Visapult supports interactive volume rendering to rates by employing distributed network components and a high degree of parallelism. Image Based Volume Rendering Algorithm when used with this program, Visapult can exchange additional information with reduced bandwidth [15].
For improving traditional visualization of render, Corcoran et al. [16] propose a model that employs two phases, which depend firstly on rendering volume direct (RVD), and on a number of other rendering non photorealistic processing
techniques (RNF). By separating the visualization on two levels, allowing a higher level of detail than that normally observed with the traditional process, it is noteworthy its level software architecture. The interactivity drawback is due to the lack of specific limits and sometimes it is possible to get occlusion by overlapping images. Because being interactive, they require minimum time response.
The model poses strategies to solve these problems, emphasizing the perception of images.
Bounding volume hierarchies (BVHS) hold great promise for dynamic scenes. However, each proposed technique changes for handling animations has limitations, such as a reduced performance in a prolonged time and some difficulty in the processing of deformed objects. It avoids synchronization problems but in the other hand limits the speed at which BVH can build frames [17].
Madhavan et al., [18] show a model that seeks an implementation of a distributed rendering environment which is easily accessible according to the system requirements. The model generates the deployment work, with monitoring render, data sending, error corrections and reducing waiting times. Furthermore, Taura [19] proposes an architecture based on real time monitoring system called VGXP, based on a technology called GXP. For the system, it is important to monitor and control the performance of a distributed process, as well as the performance, scalability, fault tolerance, and also data sent to the client without overloading and security. The system generates a 3D graphics response in java.
In the system proposed with Kamoshida [20], the server collects the monitoring data required and sends it to the client through a hierarchical architecture. An agent process runs on each node, which monitors the control data produced by each process and event. To accomplish this communication, the agents form a tree structure for TCP connections. The root of the tree is the server process.
Madhavan et al. [21] propose a software architecture based on Java for real-time visualization and generating interactive graphics. This architecture minimizes the amount of required synchronization between PCs, resulting in excellent scalability.
The modular architecture provides a framework that can accommodate a variety of algorithms and data formats representation, provided that rendering algorithms are used to generate individual pixels and data duplication in each computer. As an object-oriented design, it implements the basic functionality required for distributed rendering.
Due to the complexity of volumetric rendering, the problem can be divided [22, 23, 24]. They propose using the Octree algorithm, which is responsible for dividing the volumetric scene in scenes less complex, according to the user's request. Another advantage is the weight of the scene at the time of transport on the network, since it does not require the entire bandwidth needed initially. The problem that arises with volumetric rendering is the volume size. Therefore, the image must submit to procedures outside the nucleus to avoid charges in memory.
Ray-tracing [15,16, 17, 25, 26, 27, 28]. This is based on the illumination of the image, capturing the beam size and its reflection on the object. This involves various drawbacks (shading, texture object, etc) when there are complex object.
In order to optimize performance, an intersection is found, the beam is transferred to the point of intersection and its address is modified according to the type of beam, shadow or reflection, using various characteristics of objects to be displayed and geometric data. The iterations stop when the reflected ray does not hit any objects or the maximum predetermined level of reflection is reached. Ray-traicing is a dynamic algorithm with a high cost in displaying images.
Castanie et al [29] propose a model based on an original application of DSM (Distributed Shared Memory), as it is a type of implementation to level hardware and software system. Each node in a cluster has access to a large shared memory that is added to the limited unshared memory of each node. However, this implementation is reconstructed, generating four additional access levels that are included in this system, such as the graphics memory, the local memory in the node, the memory of the other nodes through the network and the disk. This new implementation is called Distributed Hierarchical Cache System (DHCS).
III. SUBDIVISION SURFACE METHOD ON MOBILE DEVICE
The visualization process is composed of four parts: data collection, image processing, building surface and display of image. As regards techniques, there are two types of volume rendering methods: direct and indirect. Direct methods use a type of 3D volumetric images generated without explicitly extracting geometric surfaces from the data. Indirect method consists of marching cubes algorithm, from which the cells belonging to a surface threshold, and a threshold value provide as a result a cubic grid containing a classification of the object data, which is modeled through an octal tree.
Nowadays, the graphic processing is performed by the z-buffer algorithm which handles the display of images. It is useful because it processes millions of images interactively using triangles. It takes image texture and illuminates to a low computational cost. According to Shirley et al. [25], it has the following disadvantages:
Applications with data sets significantly large, generates processing times of order NP.
Applications with non-polygonal data are not easily converted into triangles for processing as image.
Applications that demand high quality shadows, with reflection, refraction and particle effects are difficult to process.
An option is to perform the rendering process using ray-tracing techniques. However, a high computational cost is generated by the large number of ray tracing for each scene. This problem can be minimized by using special data structures able to organize or group scene objects spatially. The number of intersection tests involved in searching is
greatly reduced.
So instead of following a comprehensive search to identify the correct scene for the nearest intersection, only nearby objects are approved and the remaining are discarded, as recommended by Siu-Lung et al. [26].
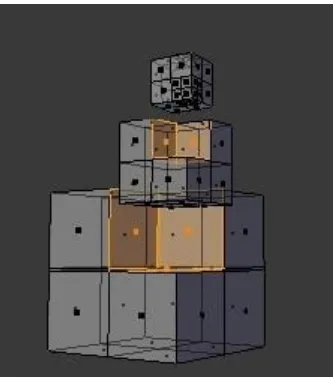
To develop volumetric render, tree octants Local Grade Smooth algorithm is used (OOLSD). It is submitted by Xing et al. [30]. First the image is divided into some small sets of points according to the octree construction, then a local triangular mesh through the region is built by fusing the triangulations recursively and aplying the principle of “divide and rule”.
By reducing the surface into small sets of points, reconstruction efficiency is improved because the search region is small and local. In the recursive fusion process, the optimization operation is performed between boundary triangles. Therefore, the number of the mesh boundary triangulation does not increase, so the complexity of the algorithm is stable.
Fig. 1 Octree subdivision surface
Fig. 1 shows the subdivision surface from octants optimized algorithm, also known as Local Grade Smooth. The involved process of this algorithm reduces the level of memory which is stored in the mobile device by eliminating non-relevant images [22, 23].
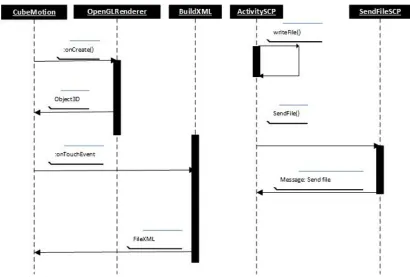
For subdivision surfaces, it is necessary in the first place to identify those that are visible to users, through the hidden surface removal algorithm through JPCT 3D engine. Through CubMotion class structure renders is performed, based on the World Reference, FrameBuffer, Light, Object name,
RGBColor Matrix, xPosition, YPosition, Object
sequence diagram associated with the interaction surface subdivision process.
After the construction of the tree-KD, a session through the JSCH library is created, which is an implementation of the SSH2 protocol that provides support for secure remote access and data compression. In the SSH communication the following key issues are discussed:
To access the server, it is necessary to provide credentials,
user and password.
Sockets are used to establish a communication between client and server. Thus, data transmission through objects is serialized.
JSCH library provides an encrypted communication channel, protecting data that are travelling between client and server.
Fig. 2 Sequence diagram of surface subdivision
Once communication channel is created and a session is defined, the manner of handling events is throughout an implemented interface. ActivitySPC component is used to close sessions. Fig. 3 shows the deployment diagram associated with the process of subdivision surface on the mobile device and the creation of the communication channel.
Regarding the hardware environment used for testing, it encompassed a server and several mobile devices. The Server responsible for storing WMA has the following description: a blade server PowerEdge M620, Intel Xeon E5-2600 processor, Intel QuickPath Interconnect (QPI) 7.2 GT / s, 2.5 MB cache per core with 4 cores, 16GB RAM, 3TB HDD master was utilized and 3 TB hard drive slave, this server has a Matrox G200 video card integrated. This server has installed an operating system: Red Hat Enterprise Linux. Moreover, all test devices had the Android operating system, due to the need for the installation and configuration of JPCT 3D engine.
IV. ARCHITECTURE PROPOSAL FOR DISTRIBUTION OF RENDER
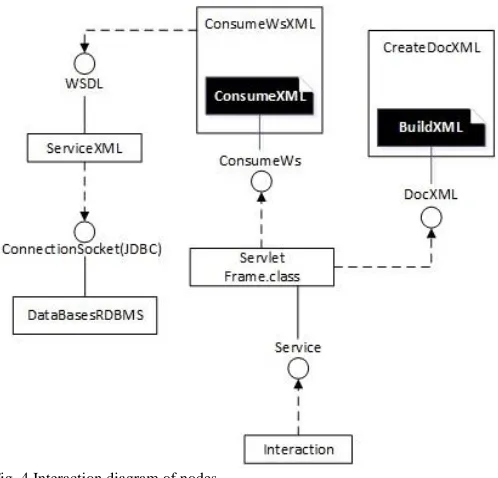
According to the tree-KD, metadata is generated for each
node which is recorded in real time from a web service and relational database management system (RDBMS). This process consists of defining a structure with associated data that should map to an XML template in order to generate the BuildXML class. Fig. 4 shows the interaction diagram for each node.
Fig. 3 Deployment diagram of surface subdivision
Fig. 4 Interaction diagram of nodes
Clearly, there is a dependence on bandwidth which is given by network congestion, the intensity of the received signal and the mobile device. Additionally, it should be considered that the following restrictions exist: network 2.5G technology and General Packet Radio Service (GPRS) transmitting 56 kbps. The aforementioned restriction inhibit data transmission to WMA since the standard for real-time animation is 24 frames per second (fps) with a limit of 292 Bytes for each XML document. Additionally, range between 1KB and 15KB acts as another restriction for data test.
Therefore, a minimum of 2880 kbps connection is required, which is only available in 4G networks.
One solution is to compress data using redundant coding bytes, through a grammar based on X3D standard. Then,
decompression is performed in the WMA.
In the compression process, files are reduced to 500 B and 2.5 KB respectively, due to the redundancy of coordinates and XML tags.
Considering that the minimum value to establish a connection using compressed data is 480 kbps, it is still possible to perform tasks throughout 3G network. Regarding 2G networks with a top speed of 232 kbps, the rendering process requires applying a stroboscopic effect, reducing a third of the number of frames processed remotely.
To maintain the visual quality of animation in a game, mobile device should process two frames while the last frame is sent remotely. However, this simple model is not feasible due to ignorance of network traffic and the instability of the connection.
To identify the number of nodes created by each scene, we propose using Hidden Markov Models (HMM) that create a finite number of states, from an initial test of connection between the mobile device and WMA.
To model the full process, a known and finite set of states S Hidden Markov, one for each domain, is built. A domain is set from the combination of different heuristics such as:
Connection speed. Latency time. Size of the scene.
Number of nodes to construct feasible by scene. Probability of failure on the connection
development of research, it was used:
𝑊[ℎ(𝑛)] =
𝑊[ℎ(1)]+𝑊[ℎ(2)]…+𝑊[ℎ(𝑛)]𝑛 (1)
𝑊[ℎ(𝑛 − 1)] = 𝑊[ℎ(𝑛)] +𝑊[ℎ(1)]+𝑊[ℎ(2)]…+𝑊[ℎ(𝑛)]
𝑛−1 (2)
In equation (1) weight or heuristic value is determined by assigning a weight to the last interval equal to the sum of the weights of the intervals over the number of intervals. Initial weight is 1 for each element. For the next element, previous element weight is taken and added to the result of the equation (2).
To calculate the relevance of each heuristic 𝑅[ℎ(𝑖)], the value is set to 1 or 0 if the connection is in any of the established ranges and the importance, 𝐼[ℎ(𝑖)], is indicated. The value obtained in (2) is multiplied by the value of the relevance of each heuristic, then added and this allows us to identify the importance of each heuristic. Equation (3), presents a formal method to identify the relevance of each heuristic.
𝑅[ℎ(𝑛)] = ∑ 𝑊[ℎ(𝑖)] ∗ 𝐼[ℎ(𝑖)] 𝑛
1
(3)
𝑅[ℎ(𝑛)] Sets the probability of heuristics associated, according to the connection status for each domain. A transition matrix between states is then generated.
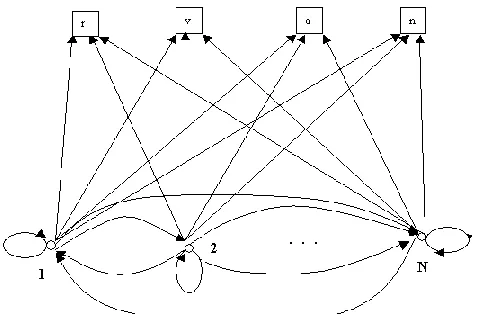
In order to model the probability of the states, several vector observation, 𝑉(𝑖), have been established before the training phase models.
Formally, the probability to move from one state to another is represented by directed edges. Usually the nodes are numbered from 1 to N, according to the number of nodes and edges are labeled with probability values between 0 and 1. Each possible state 𝑉(𝑖), is represented by a labeled box and the probability that a job stay with some priority according to the policy node is expressed as a directed edge from that state to the observed symbol, as shown in Fig. 5.
Having defined the structure of the overall model and each of the HMM training proceeds of the S models to calculate the optimal values of all parameters that have been mentioned. For that, the k observation sequences in each state have been used.
For the proposed model the vector of initial probabilities 𝐴𝑖𝑠 each HMM is initialized with probability value equal to 1 / N, as follows:
𝐴𝑖𝑠= 1
𝑁, 1 ≤ 𝑗 ≤ 𝑆 𝑎𝑛𝑑 1 ≤ 𝑖 ≤ 𝑁 (4)
B = (bj(k))N is a vector of observation symbol probability,
one for each estate, in which bj = (bj1, bj2, ..., bjM) defines
observation symbol probability ot = vk of the alphabet in the state j.
Fig. 5 Architecture fully connected (ergodic) model of Nodes
The learning model is toadjust the parameters to maximize P(𝑉(𝑖)/) including several algorithms for training the HM Baum-Welch, Expectation Maximization (EM), Generalized Expectation Maximization (GEM), and different forms of gradient descent [30].
The procedure of training with EM for restimation of HMM parameters uses the variable 𝑊[ℎ(𝑡(𝑖, 𝑗))], that is the probability of being in state i at time t, and state j at time t + 1, for a given model and a observation sequence 𝑉(𝑖), i.e.
𝑊[ℎ(𝑡(𝑖, 𝑗))] = 𝑃[𝑞𝑡= 𝑖, 𝑞𝑡+1 𝑗
𝑉(𝑖), 𝜆] (5)
𝑊[ℎ(𝑡(𝑖, 𝑗))] =𝑃[𝑞𝑡= 𝑖, 𝑞𝑡+1= 𝑗. 𝑉(𝑖)/𝜆] 𝑃(𝑉(𝑖)𝜆 )
(6)
The sum of (5) on t can be interpreted as the expected number of transitions from state i to state j, formally expressed in (6):
∑ ∑ 𝑊[ℎ(𝑡(𝑖, 𝑗))] 𝑁
𝑗=1 𝑇−1
𝑖=1
(6)
Representing the expected number of transitions from state i to state j in 𝑉(𝑖). For optimal state sequence, the probability of the observation sequence 𝑉(𝑖), P(𝑉(𝑖)|), is calculated efficiently.
The evaluation of the probability of the sequence consists of calculating the probability of the observation sequence P(𝑉(𝑖)|). The way to solve the problem is to apply a forward algorithm. In this algorithm, it is assumed that t (i) = P(o1 o2 ... ot, qt = i | ). Then the probability of observing the partial sequence P(𝑉(𝑖)|) in state i to time t can be calculated as follows,
𝛼𝑡+1(𝑖) = ∑ 𝛼𝑡(𝑖)𝑎𝑖𝑗. 111𝑡
𝑖=1
𝑏𝑖(𝑉(𝑡 + 1)), 1 ≤ 𝑡 ≤ 𝑇 − 1 (8)
P(𝑉(𝑖)|) = ∑ 𝛼𝑇(𝑖) 𝑁
𝑖=1
(9)
The observation probabilities are given by the state of the connection according to the values given by heuristic calculations taken into account (3).
WMA is responsible for maintaining a probability table for device and continuously monitors the connection status, acting as a brokered services under an implementation Gamming as a Service (GaaS) [4,5,7].
V.RESULTS AND DISCUSSION
The render becomes a multi objective problem, since there is a problem of processing capacity on the mobile device.
The number of heuristics is increased, considering other factors such as device processing power, load balancing, cumulative yield, missed deadlines, equity, preference of users, total weighted completion time, delays weighted number of tardy jobs, and many others [33].
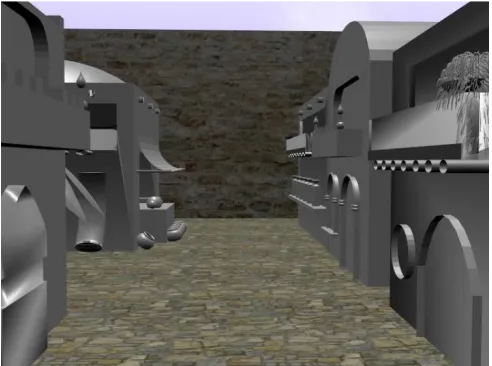
An animation render sequence was performed, starting at the scene shown in Fig. 6 and ending at the scene shown in Fig. 7. The animation corresponds to a 30 second walk of the main character (Fig. 7).
Fig. 6 Opening scene
The number of polygons of each scene varies between 7000 and 19000, with an average variation of 10% between frames.
In this research only the volume rendering process is taken into account, regardless of color, texture and lighting of the scene. For this reason buildings are in gray.
In order to validate the proposed model, six domains where considered and a controlled manner to stablish the states of each heuristic and the importance, 𝐼[ℎ(𝑖)], associated with the number of intervals.
Table 1 shows the values of ranges for the best case, worst
case and number of intervals associated to test domains according to heuristic set.
Fig. 7 End scene
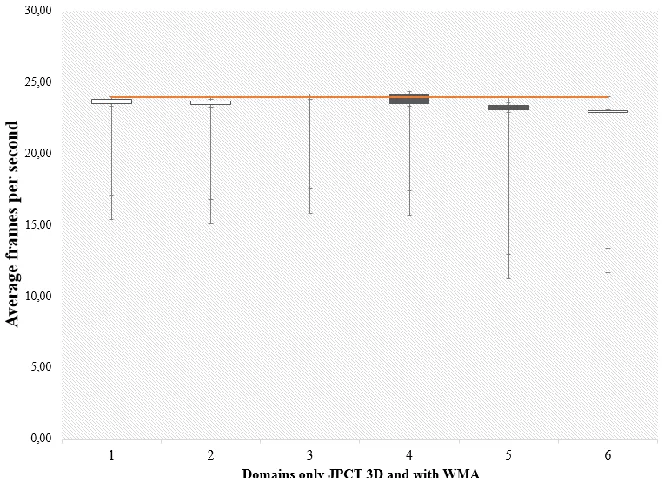
Table 2 shows the domains where controlled tests were performed, which yielded the number of frames per second.
TABLE I
VALUES OF TEST DOMAINS USING HEURISTIC
Table 3. Presents a variation of frames in mobile devices according to processor and memory. The conclusion is that the proposed model is valid for a set of significant number of polygons or a low-speed connection.
According to Table 3 and Fig. 8, there is not a significant variation between tests with domains 2 to 5, while in domain 1 there is a significant variation since it was considered the worst case in heuristics in Table 2.
Regarding the aforementioned, there is an inverse correlation between processor and memory capacity of the device, network speed and the number of frames per second if rendering process with JPCT 3D engine is performed. However, the correlation is reduced by 40% implementing the proposed model.
The rendering process is performed constructing a reference environment, commonly referred as world.
speed (Kbps)
latency (ms)
Polygons (int)
Node-KD (int)
frames per second (int)
Best case I[h(i)]
Worst case 128 250 19000 8 16
number of
intervals 100 15 15 7 8
TABLE II TEST DOMAINS
TABLE III
TEST RESULTS BY MOBILE DEVICE FEATURES
Although reliability is tied to redundancy, this approach encompasses metrics of fault tolerance and system consistency. In that way, the expected reliability is covered, and the information system would cover the property of fault tolerance in its implementation. The proposed model was
implemented and, during the phase of handling tasks, the rendering process was executed without interrupting the service.
speed
(Kbps)
latency
(ms)
Polygons
(int)
Node-KD
(int)
Domain 1
128
250
19000
8
Domain 2
10240
100
7000
64
Domain 3
1024
180
12000
32
Domain 4
2048
150
9000
64
Domain 5
512
100
15000
64
Domain 1 Domain 2 Domain 3 Domain 4 Domain 5
2GB HSPA+
Quad-core de 1,6 GHz Cortex-A15
Android V4.2
Jelly Bean 16,24 24,03 23,82 23,49 24,08 24,00
2GB 4G LTE
Quad-core 1.2 GHz Cortex-A53
Android 4.4
Kitkat 15,93 24,07 23,67 23,44 24,01 24,00
3GB 4G LTE
Quad-core 2.7 GHz Krait 450
Android 5.0
Lollipop 16,70 24,02 24,01 23,99 24,02 24,00
1GB 4G LTE
Quad-core 1.2 GHz Cortex-A7
Android 4.3
Jelly Bean 16,54 24,05 23,49 24,18 24,04 24,00
512MB HSPA+ Dual Core
1.3 GHZ
Android V4.2
Jelly Bean 12,09 24,03 23,08 23,38 24,01 24,00
512MB HSPA+
Dual-core de 1 GHz Cortex-A5
Android V4.2
Jelly Bean 12,50 24,03 23,04 22,88 23,98 24,00
With WMA Only JPCT 3D
Mobile device Average frames per second
memory phone
network CPU
Fig. 8 Variation render between only JPCT and with WMA
Fig. 8 Variation Error Average on Perfect Frame
VI. CONCLUSIONS AND FUTURE WORK
To implement a Gaming as a Service (GaaS), an infrastructure that allows seamless experience for the user interaction is required. The number of frames per second that a mobile device processes according to a scene, facilitates interaction experience. However, the more complex a scene, a greater processing power is needed to process all data in real time. One solution to this problem is to take this responsibility to the mobile device, but the unstable network connectivity is the bottleneck.
To optimize the rendering process to a good rate according to the processing capability and network speed, it is necessary to perform a multi objective analysis. By validating different characteristics simultaneously, an efficient distribution of work is done. In the first instance, subdivision of surface is required using the octree algorithm, in order to divide the
problem into less complex problems.
To model the entire process, a known and finite set of Hidden Markov Models, one for each node o domine, must be built. Each domine consists of a set of heuristics with unknown cardinality, each one of which could have different states, associated to the local responsability.
This research had only covered the volume rendering process, regardless of color, texture and lighting of the scene. However, these factors can be as crucial as the volume of the object in the interaction with the user.
In future researches, it becomes necessary to involve the algorithms associated with the shadows, textures and lighting to optimize a platform of Gaming as a Service.
REFERENCES
[2] Barab S, Thomas M, Dodge T, Carteaux R, Tuzun H (2005) Making learning fun: quest Atlantis, a game without guns, Educational Technology Research and Development, vol 53, no. 1, pp 86 C107 [3] Siu-Lung J, Chi-Wai R, Fang Y (2012) The effects of peer intrinsic and
extrinsic motivation on MMOG game-based collaborative learning, Information & Management, vol 49, no. 1, pp 1 C9
[4] Gonzalez-Crespo R, Rios-Aguilar R, Ferro-Escobar, Torres N (2012) Dynamic, ecological, accessible and 3D Virtual Worlds-based Libraries using OpenSim and Sloodle along with mobile location and NFC for checking in, International Journal of Interactive Multimedia and Artificial Intelligence, vol 1, pp 62 C69
[5] Neri R, Lopez M, Bolivar-Baron H, Gonzalez-Crespo R (2023) Annotation and Visualization in Android: An Application for Education and Real Time Information, International Journal of Interactive Multimedia and Artificial Intelligence, vol 2, pp 7 C12
[6] Hoberman P, Krum D. M, Suma E. A, Bolas M (2012) Immersive training games for Smartphone-based head mounted displays, Proceedings of Virtual Reality Workshop, pp 151 C152
[7] Cai W, Leung V, Hu L (2013) A Cloudlet-Assisted Multiplayer Cloud Gaming System, Mobile Networks and Applications, vol 19, pp 144 C152
[8] Feisst M, Christ A (2004) Dynamically Optimized 3D (Virtual Reality) Data Transmission for Mobile Devices, In: Proceedings of the 2nd International Symposium on, pp 270 C274
[9] Nguyen Thu D, Peery C, Zahorian J (2001) DDDDRRaW: A Prototype Toolkit for Distributed Real-Time Rendering on Commodity Clusters, Proceedings of 15th International Parallel and Distributed Processing Symposium
[10] Bolívar H, Martínez M, Gonzalez R, Sanjuan. O (2012) A multi-agent matchmaker based on hidden markov model for decentralized grid scheduler, Proceedings of 4th International Conference on Intelligent Networking and Collaborative Systems (INCoS), pp 628 C636 [11] Stone J, Saam J, Hardy D, Vandivort K, Hwu W, Schulten K, (2009)
High performance computation and interactive display of molecular ortitals on GPUs and multi-core CPUs, Proceedings of 2nd Workshop on General Purpose Processing on Graphics Processing Units, pp 9 C18 [12] Anderson D, Estrada T, Taufer M, Reed K (2009) EmBIOINC: An
emulator for performance analysis of BOINC projects, Proceedings of the 2009 IEEE International Symposium on Parallel & Distributed Processing, pp 1 C8
[13] Yamagiwa S, Wada K (2009) Performance study of interference on GPU and CPU resources with multiple apllications, Proceedings of the 2009 IEEE International Symposium on Parallel & Distributed Processing, pp 1 C8
[14] Thomas D, Howes L, Luk W. (2009) A comparison of CPUs, GPUs, FPGAs, and massively parallel processor arrays for random numer generation, Proceedings of the ACM/SIGDA International symposium on Field programmeable gate arrays, pp 63 C72
[15] Bethel W, Shalf J (2003) Grid-Distributed Visualizations Using Connectionless Protocols, Computer Graphics and Applications, pp 51 C59
[16] Corcoran A, Redmond N, Dingliana J (2010) Perceptual enhancement of two-level volume rendering, Computers & Graphics, vol 34, no. 4, pp 388 C397
[17] Wald I, Ize T, Parker S (2008) Fast, Parallel, and Asynchronous Construction of BVHs for Ray Tracing Animated Scenes, Computers & Graphics, vol 32, pp 3 C13
[18] Madhavan, K.P.C. Arns L.L, Bertoline G.R (2005) A distributed rendering environment for teaching animation and scientific visualization, Computer Graphics and Applications, vol 25, no. 5, pp 32 C38
[19] Taura K (2004) GXP: An Interactive Shell for the Grid Environment, In International Workshop on Innovative Architecture for Future Generation High-Performance Processors and Systems, pp 59 C67 [20] Kamoshida Y, Taura K (2008) Scalable Data Gathering for Real-time
Monitoring Systems on Distributed Computing, CCGRID '08. 8th IEEE International Symposium on Cluster Computing and the Grid, pp 425 C432
[21] Mahovsky J, Benedicenti L (2003) An Architecture for Java-Based Real-Time Distributed Visualization, Visualization and Computer Graphics, vol 9, no. 4, pp 570 C 579
[22] Carmona R, Froehlich B (2011) Error-controlled real-time cut updates for multi-resolution volume rendering, Computers & Graphics, vol 35, no. 4, pp 931 C944
[23] Scheiblauer C, Wimmer M (2011) Out-of-Core Selection and Editing of Huge Point Clouds, Computers & Graphics, vol 35, no. 2, pp 342 C351 [24] Klein J, Friman O, Hadwiger M, Preim B, Ritter F, Vilanova A,
Zachmann G, Bartz D (2009) Visual computing for medical diagnosis and treatment, Computers & Graphics, vol 33, no.4, pp 554 C565 [25] Shirley P, Sung K, Brunvand E, Davis A, Parker S, Boulos S (2008)
Fast ray tracing and the potential effects on graphics and gaming courses, Computers & Graphics vol 32, no. 2, pp 260 C267
[26] Santos A, Teixeira J. M., Farias T, Teichrieb V, Kelner J (2012) Understanding the Efficiency of kD-tree Ray-Traversal Techniques over a GPGPU, Architecture International Journal of Parallel Programming, vol 40, no.3, pp 331 C352
[27] Steinberger M, Kainz B, Hauswiesner S, Khlebnikov R, Kalkofen D, Schmalstieg D (2012) Ray prioritization using stylization and visual saliency, Computers & Graphics, vol 36, no. 6, pp 673 C684
[28] Parker S, G., Bigler J, Dietrich A, Friedrich H, Hoberock J, et al. (2010) Optix: a general purpose ray tracing engine. ACM Transactions on Graphics (TOG) - Proceedings of ACM SIGGRAPH 2010, vol 29, no. 66
[29] Castanie L, Mion C, Cavin X, Levy B (2006) Distributed Shared Memory for Roaming Large Volumes, IEEE Transactions on Visualization and Computer Graphics, vol 12, no. 5 pp 1299 C1306 [30] Xing X, Jia R, Lv X (2011) A Surface Reconstruction Algorithm based
on Octree and Optimized Local Smooth Degree, Procedia Engineering, vol 15, pp 3728 C3732
[31] Wald I, Havran V (2006) On building fast kd-trees for ray tracing, and on doing that in O (N log N), In: Proceedings of the 2006 IEEE Symposium on Interactive Ray Tracing, pp 61 C69
[32] Baum L, Petrie T, Soules G, Weiss N (1970) A maximization technique occurring in the statistical analysis of probabilistic functions of Markov chains, The Annals of Mathematical Statistics, vol 26, pp 164 C171 [33] Xhafa F, Abraham A Computational models and heuristic methods for
Grid scheduling problem, Future Generation Computer System, vol 26, pp 608 C621
Holman Bolívar, PhD, is the director of Software Engineering Program at the Universidad Católica de Colombia. Professor of computer programming and Artificial Intelligence. He has participated in numerous projects I + D + I such as Senacyt and Colciencias among others. His research and scientific production focuses on serious gaming, web engineering, mobile technologies and cognitive training. He has published more than 20 works in indexed research journals and conferences.
John Velandia, holds a MSc. from Stuttgart University (Germany). He has been leader of IT projects in the industry, in sectors such as Education, Food an Automotive. He manages his projects based on PMI, TOGAF and ITIL. Moreover, He teaches software architecture and guide bachelor thesis at the Catholic University. He is responsible of a research junior group named GINOSKO. The fields of research area are Web technologies, Business Intelligence and IT frameworks.
Jenny Torres Engineer telematics and magister in software engineering. professor of Software Engineering Program at the Universidad Católica de Colombia. She has directed numerous projects Social Responsibility. She is a enthusiastic and leader person who has gained knowledge and experience in areas such as software engineering and project management