Volume 55, 2018, Pages 215–228
GCAI-2018. 4th Global Conference on Artificial Intelligence
Analysis of Attack Graph Representations for Ranking
Vulnerability Fixes
Tom Gonda, Tal Pascal, Rami Puzis, Guy Shani, and Bracha Shapira
Information and Software Systems Engineering, Ben Gurion University
Abstract
Software vulnerabilities in organizational computer networks can be leveraged by an attacker to gain access to sensitive information. As fixing all vulnerabilities requires much effort, it is critical to rank the possible fixes by their importance. Centrality measures over logical attack graphs, or over the network connectivity graph, often provide a scalable method for finding the most critical vulnerabilities.
In this paper we suggest an analysis of the planning graph, originating in classical planning, as an alternative for the logical attack graph, to improve the ranking produced by centrality measures. The planning graph also allows us to enumerate the set of possible attack plans, and hence, directly count the number of attacks that use a given vulnerability. We evaluate a set of centrality-based ranking measures over the logical attack graph and the planning graph, showing that metrics computed over the planning graph reduce more rapidly the set of shortest attack plans.
1
Introduction
Large organizations use a vast and diverse set of software [17]. As such, ensuring that all installed software are completely safe is an impossible task. The computer networks of large organizations can hence be penetrated by exploiting vulnerabilities in the installed software, operating system, or their combinations. Indeed, research has shown that even organizations whose core business is developing security software have many vulnerabilities in their networks [28].
When a vulnerability in some application is identified, its vendor may issue a patch fixing the vulner-ability. Alternatively, if a software is found to be too vulnerable, the security administrator can recom-mend an alternative, more secure, software. Of course, replacing the software often involves a significant cost [24]. Thus, the system administrators must prioritize the fixes such that the more important vulner-abilities will be fixed first [7].
One can compute an attack plan, a sequence of actions (e.g. exploits) that allow attackers to achieve their goals, such as access to specific sensitive information [13]. The system administrator can use these attack plans to decide which vulnerabilities to patch. Some suggest patching the vulnerabilities exploited in the shortest attack plans [3], others propose combinatorial optimization for eliminating all possible attack plans with minimal number of vulnerability fixes [1]. In this paper we investigate techniques that fall between these two extremes. Assuming that it is not feasible to cut all paths toward the critical assets we strive to eliminate as many shortest paths as possible and eventually increase the cost of the cheapest attack plan with least vulnerability fixes.
Previous research has suggested to analyze the LAG or the connectivity graph, using various node centrality measures, such as betweenness [14], and PageRank [22], for prioritizing the vulnerabilities to be fixed. In this paper we suggest inferring the vulnerabilities’ importance from the (relaxed) planning graph — a data structure often used in the classical planning community, mainly to compute forward search heuristics [12]. Centrality measures computed over the planning graph are shown to be superior to centrality measures computed over the LAG and the connectivity graph for prioritizing vulnerabilities which are important for many attack plans.
We demonstrate here that over a range of benchmarks including a scan of an organization network, metrics computed over the planning graph provide in many cases a better ranking compared to metrics computed over the LAG or the connectivity graph. We evaluate the vulnerability ranking techniques by enumerating all possible shortest attack plans based on the planning graph. Vulnerability fixing strategies which are based on centrality measures computed on the planning graph cut more shortest attack plans and eventually increase the minimal attack cost faster compared to those computed directly on the other representations of the attack graph.
The main contribution of this paper is in suggesting the planning graph as a useful alternative to logical attack graphs which are common in pentesting literature. A second important contribution is in providing experiments over real world networks. All previous literature on attack graphs, to the best of our knowledge, have been evaluated over artificial simulated networks only. We experiment with both real and artificial networks, demonstrating that results over the artificial networks do not apply to the real world networks.
2
Background
We now briefly review relevant background, starting with attack graphs and their use in ranking vulner-ability fixes. We then discuss graph centrality measures, and finally the planning graph data structure.
2.1
Logical Attack Graphs
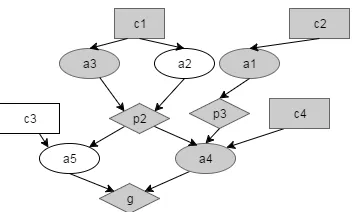
Logical attack graphs (LAGs) represent the possible actions and outcomes of actions applied by an attacker trying to gain a goal asset in a system [19]. An example of an attack graph can be seen in Figure1.
The graph contains 3 types of nodes: Primitive fact nodesrepresent facts about the system. For example, they can represent network connectivity, firewall rules, user accounts on various computer and more. In the example graph (Figure1) primitive fact nodes are represented by rectangular nodes.
Derivation nodes(or action nodes) represent an action the attacker can take in order to gain a new capability in the system. Action nodes are represented in figure1by ovals.
Figure 1: Example of an attack graph with an attack plan (grayed nodes)
Edges in the LAG from a fact node to an action node represent the dependency of the action on the facts, and edges from an action to fact represent the derivation of that fact following the action.
Definition 2.1. Logical attack graph. Formally, a logical attack graph is a tuple: G= (Np, Ne, Nc, E, L, g)
WhereNp,NeandNcare three sets of disjoint nodes in the graph,Eis a set of directed edges in the graph where
E⊆(Ne×Np)∪((Np∪Nc)×(Ne))
L is a mapping from a node to its label, andg ∈ Np is the attacker’s goal (multiple goals can be transformed into a single goal using an action with preconditions as the multiple goals).Np,NeandNc are the sets of privilege nodes, action nodes and primitive fact nodes, respectively.
The edges in an LAG are directed. There are two types of edges in attack graph:(a, p)an edge from an action node to a derived fact node, stating that by applyingaan attacker can gain privilegep.(p, a)is an edge from a fact (either primitive or derived) node to an action node, stating thatpis a precondition to actiona. For example, in order to apply exploiteon machinem2from machinem1, there must be a connection fromm1tom2(represented by a primitive fact nodep), and the user must have already gained access to code execution onm1 (represented by a derived fact node d). Hence, there will be edges fromptoeand fromdtoe. In addition, if using exploitseresults in obtaining code execution privileges onm2, represented by a derived fact nodec, then there will be an edge frometoc.
The labeling function maps a fact node to the fact it represents, and an action node to a rule that defines the derivation of new facts. Formally, for every action nodea, letCbea‘s child node andPbe the set ofa‘s parent nodes, then
(∧L(P)⇒L(C))
is an instantiation of interaction rule L(a). LAGs are a special case of And/Or Graphs [8] where each action can instantiate only one fact (or derived fact). We will use this notation from [11]
• pre(a) ={v∈Np∪Nc: (v, a)∈E}
• add(a) ={v∈Np: (a, v)∈E}
• ach(v) ={a∈Ne:v∈add(a)}
Wherepre(a)is the set of facts which are preconditions to the actiona.add(a)is the set of facts gained by applying the actiona(in LAGs this set contains only one node).ach(v)is set of actions which can achieve derived fact nodev.
• g∈G0
• ∀a∈Ne:preG(a)⊆G0
• ∀v∈Np :∃a∈achG(v)s.t.a∈G0∧ |achG0(v)|= 1
That is, an attack plan is a sub-graph of G’ that contains the goal node of graph G. Each actionain G’ is fulfilled by all of the preconditions ofain G. Each fact is achieved by exactly one action. Attack plan represents a scenario in which an attacker infiltrates the organization and achieves his goals.
2.2
Graph Centrality Measures
Centrality measures attempt to estimate the importance of a node within a graph [10]. This is useful in many domains, such as in finding prominent members in social networks, identifying bottlenecks routes in traffic networks, and many more. Previous research on ranking vulnerability fixes has used several centrality measures in order to identify which vulnerabilities should be fixed [14].
The most obvious centrality measure is degree centrality,CD(v) = degree(v), mainly because it is easy to compute. Although it is easy to compute, degree centrality often poorly represents the true importance of a node in a graph.
Betweenness centrality captures a more delicate aspect of the importance of the node in a given graph. This measure represents for each node, the number of shortest paths between any two nodes that passes through that node:
CB(v) = X
s6=v6=t
σst(v)
σst
whereσstis the number of shortest paths between nodessandt, andσst(v)is the number of short-est paths between nodess andt that pass through nodev. Betweenness was previously used to find important nodes in attack graphs [14].
Below, we also use a modification of betweenness, in which we consider only shortest paths between a set of source nodes (the initial facts nodes in the LAG, or the first layer of the planning graph) to the goal node [5]. We denote this betweenness s-tbetweenness, and the original betweenness is denoted all-pairsbetweenness.
Another commonly used graph centrality measure is Closeness Centrality. This measure captures how close a certain node to the rest of the nodes in the graph.
CC(v) =
1
P
ud(u, v)
whered(u, v)is the shortest distance betweenuandv. In this centrality method, nodes on the fringe of the graph have lower scores than nodes in the center of the graph.
Google’s PageRank has also been used to rank important nodes in a graph. PageRank is measuring the likelihood for a web-surfer to be at pagei[21], for estimating the importance of web pages. The metric is given by:
CP R=
1−d N +d
X
j∈In(j) πj |Out(j)|
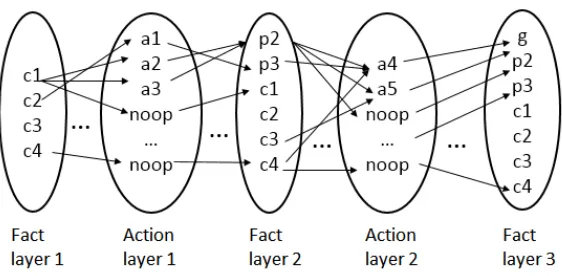
Figure 2: Planning graph of Graph G from Figure.1
2.3
Planning Graphs
Planning graph [4] is a data structure originating in the automated planning community. A planning graph is a directed, layered graph with two types of nodes and two types of edges. The layers alternate between fact layers, containing only fact nodes,and action layers containing action nodes. Edges from fact to action nodes denote action preconditions, while edges from action to fact nodes denote action outcomes.
In classical planning problems, already obtained facts can be removed by other actions. Planning graphs hence include additional information, such as which facts cannot be achieved at the same time (mutexes) [6]. However, in pentesting, once a fact, such as access to a given machine, is obtained, it is never lost, resulting in simpler graphs that are easier to represent and reason about. We also note that the number of nodes in suchdelete-freeplanning graphs isO(n2)in the worst case, wherenis the number of nodes in the respective LAG.
The planning graph is constructed incrementally. The first layer of the relaxed planning graph is a fact layer, and contains one node fact that it true initially. The next layer is an action layer, containing all actions that can be executed using the facts at the previous layer. That is, all actions whose preconditions appear in the previous layer. The third layer contains all the effects of the actions at the second layer.
When no new facts appear in a fact layer, the graph expansion can be stopped. In our case, as we care only about shortest attack plans, we can stop once the goal fact appears in the graph.
In addition, we add for each factpa specialno-opaction, that takespas precondition, and generates pas output. Hence, each fact layer is a superset of the preceding fact layer. Once no new facts have been obtained in a fact layer, we can stop the expansion of the planning graph.
Facts often appear in multiple layers in the planning graph — once a fact has appeared at layeri, it will appear in all fact layersj > i, through the no-op actions. We denote each fact by its layer, that is, for factpat layeri, we writepi.
As in each fact layer at least one new fact must be added, the number of fact layers cannot exceed the number of facts. Typically, several new facts are added at each layer, and the depth of the planning graph is in many practical problems much lower than the number of facts. Symmetrically, the depth cannot exceed the number of actions
Figure2shows a planning graph for the graphGpresented in Figure1. We omit some of the edges between the facts andno-opactions for ease of presentation.
3
Related Work
Attack graphs have been used to depict possible ways for an attacker to compromise a computer net-work. Initially, attack graphs were used to better visualize the paths an attacker can take in the netnet-work. DARPA created attack graph manually as part of a red-team analysis [26], but once attack graphs could be generated automatically, they were also used to improve the security of the networks.
A common use of attack graphs is to find a set of vulnerabilities to patch which will prevent the attacker from reaching the goal. Work in this area uses various methods such as minimum-cost SAT solving [16] and specialized methods [1]. In practice, even after finding such a minimal set of vulnera-bilities, the cost of patching them may still be prohibitively high given limited IT resources. Our goal in this project is to identify methods to rapidly reduce the number of possible attack plans, when it is not possible to completely prevent the attacker from reaching the goal.
Many researches also assume some cost metric on actions in the attack graph [18], corresponding to the time it takes to launch an exploit, or to the risk of detection. It is also common to measure the probability of success when performing an exploit action [27]. Researchers then try to find attack plans which minimize/maximize the suggested metric, assuming that a rational attacker will first try to launch attacks that minimize cost [25].
For example, researchers have suggested to use classical planning, MDPs, and POMDPs to create good or optimal attack plans [13,23]. Assuming that the attacker optimizes the attack plans, in this paper, we focus on shortest attacks only, in an attempt to cut as many of them as possible and eventually increase the cost of an attack.
Similar to current study, some researchers propose to use network centrality measures to find the vulnerabilities to patch first. Some of these measures are applied on a two-layered attack graph model [14,22,15]. The nodes in the first layer, theconnectivity graph, represent the hosts in the system. A di-rected edge between two nodes(a, b)means that when controlling nodea, an attacker is able to subvert the nodebusing some exploit. The second layer is an AND-OR tree containing all the ways to com-promise a machine from an arbitrary other machine. The authors compute different network centrality measures on the connectivity graph to find the computer to patch. The authors also proposed using a measure called Attacker victim centrality (AVC) [14], based on betweenness centrality, considering only host pairs near the attacker and the target.
As we show in this paper, disregarding the vulnerabilities and the within-computer attack graph (which is described in the second layer) when computing centrality measures does not accurately esti-mate the importance of patches in reducing the number of possible attack plans and thus may result in a sub-optimal fixing strategy.
4
Enumerating All Attack Plans
In this paper we focus on the task of ranking vulnerability fixes in order to rapidly reduce the number of shortest attack plans in an any-time approach where patches are applied one at a time. In order to evaluate the patching strategies we first identify all the available shortest attack plans.
We now explain how one can use the planning graph in order to enumerate all possible shortest attack plans. This process is exponential, and cannot be applied to larger planning graphs. It is useful, however, in order to evaluate the performance of the various centrality measures.
We analyze the planning graph, rather than the LAG, because LAGs contain cycles, which are avoided in the planning graph due tono-opactions and fact duplication. We use a BFS-style algorithm, moving backward from the goal nodegnat the last fact layern, described in Algorithm14.
Algorithm 1:Enumerating All Attack Plans
1 EnumeratePlans(P G, t) :
Input:Planning graphP G, target nodet
Output:Set of all the attack plans in the graph
2 i←lastLayer(P G) 3 Pi← {hi}// Solution plans
4 pre(hi)←t//precondition of the empty plan
5 whilei >0do 6 Pi−2← ∅
7 foreachplanp=ha1, ..., aki ∈Pido
8 unsat(p)←unsatisfiedf∈pre(p)
9 foreachminimal action setAat layeri−1s.t.unsat(p)⊆ef f(A)do
10 p0←A·p
11 pre(p0)←pre(p)∪pre(A) 12 addp0toP
i−2
13 i←i−2 14 returnP0
we identify an action a (possibly a no-op) that has pin its effects. We remove pi from the list of unsatisfied facts, and for each factqin the preconditions ofawe addqito the set of unsatisfied facts. If
aprovides an additional unsatisfied factri, it is also removed from the list of unsatisfied facts. That is, we will not search for another actiona0to satisfyri.
There can be many potential actions that satisfy a needed factp, each corresponding to a different plan. Thus, for each actionathat satisfypwe create a copy of the plan and addato the copy. Thus, the expanded plan is split into multiple similar plans, with a single different action.
More precisely, letPibe the set of unsatisfied facts of the expanded plan at layeri, andAPi−1={a:
∃p ∈ Pi, p ∈ ef f ects(a)} be the set of actions at layeri−1that satisfy at least one fact inPi. We create a copy of the plan for each minimal subsetAPi−1 ⊆ AP
i−1such thatPi =Sa∈AP
i−1ef f ects(a),
and addAP
i−1to the copy.
Once we have reached the initial layer we have enumerated all possible shortest plans, but pos-sibly also some longer plans. LetΠbe the set of all such plans. Πmay contain some redundancies, due to the use of no-ops. More specifically, givenPi ={pi, qi}, and two actions,apandaq, that pro-ducep, q, respectively, we may have 4 different alternatives —hap, aqi,hap, noopqi,hnoopp, aqi, and hnoopp, noopqifor expanding the plan backwards. Then, at layeri−2, we can chooseapwherenoopp was selected andaq wherenoopq was selected. Ignoring the no-ops, which are not real actions to be executed, we obtain 4 identical plans. To remove such duplicates, once we have obtained the set of all plans, we remove no-ops from all plans, and then remove duplicate plans, ignoring the action order within a plan. We now remove all plans which are longer than the shortest plan.
Using the above planning graph construction and plan enumeration method only yields plans with a finite number of actions (which is the number of action layers in the planning graph). In order to allow plans with various lengths, additional edges should be added to the planning graph between the final fact layer and the final actions layer. In this paper we focus only on shortest plans, and ignore longer plans.
more important it is. To do so we can count for each actionathe number of plans in whichaparticipates:
CΠ(a) =|{π:π∈Π, a∈π}|
In the future, we will explore sampling techniques, originating from research in AND-OR graphs, to rapidly provide a sample of shortest plans.
5
Network Data Acquisition
All evaluation in previous research in pentesting via attack graphs is limited, as far as we know, to artificial simulated networks. It is obviously desirable to evaluate new approaches over real networks. We hence created realistic models using data obtained from scanning the computer networks of two organizations, each containing a few subnets. Using the machine configurations and existing exploits discovered during the scan, we can create real world models that allow an empirical evaluation of our approach and comparison to state-of-the-art. We now provide some explanations of the model and the networks, unfortunately omitting many details due to confidentiality restrictions.
To collect the information required to build the attack graphs, we began with scanning the various subnets using the Nessus scanner [2] in each organization. Nessus starts its scan from some source host. It identifies all machines reachable from the source host (where the scan is running) including desktops, gateways, switches, and more, possibly through several switches and routers. We hence executed several such scans, each from a different subnet within the organization, as well as one scan from outside the organization network.
The resulting scans contain the set of machines that are visible from a representative host in each subnet. Naturally, machines inside a subnet are all visible to each other. We assume that all machines within a subnet can directly access the machines that are visible from the representative host (the one with the Nessus scanner) in that subnet. This assumption may not be true when firewall rules allow or deny communication between specific IP addresses. In general, only a part of the machines outside the subnet are visible from within the subnet, due to, e.g., firewall restrictions. We model the accessibility of machines identified through the scans as direct edges in the connectivity graph. That is, machinem1 is connected to machinem2, ifm2was revealed by a scan performed from the subnet containingm1.
In addition, Nessus reveals for each identified host its operating system. Both scanned organizations contained hosts running Windows and Linux (with a few versions of each operating system). Nessus also identifies software with potential vulnerabilities that run on the scanned machines. The attack graph we created contains approximately 50 types of such software, including well known applications such as openssh,tomcat,pcanywhere, ftp services, and many more.
Nessus identifies vulnerabilities of varying importance. For the purpose of this study we ignored all the lesser vulnerabilities, which do not allow an attacker control of the system. For example, the vulner-ability identified as CVE-2014-6271 (dubbed ShellShock) allows unauthenticated remote attackers to execute arbitrary code on a vulnerable server by sending a specially crafted packet. On the other hand, the vulnerability identified as CVE-2014-4238 allows remote authenticated users to affect availability of the system (Denial of service). We identified about 60 types of important vulnerabilities that exist in the scanned networks. We ignored all hosts that do not run any software for which an important vulnerability exists.
Next we marked a few random hosts in the innermost subnet, as the target hosts. The assumed attack goal is to gain control over at least one of these target hosts.
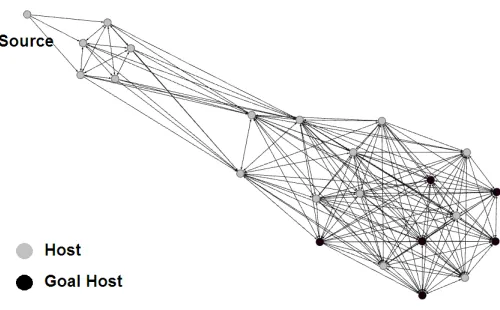
Figure 3: Connectivity graph of a network. Each node is a host computer, a directed edge between two hosts(u, v)means hostucan initiate a connection to nodev
data containing all the required information, including network connectivity, machine configurations and relevant software. We are negotiating with the network administrator the publication of some of the data that we have collected, and hope that it would be useful for other researchers in the future .
6
Empirical Evaluation
We now compare the utility of various graph centrality measures in prioritizing the vulnerabilities to be fixed. We focus on fixing vulnerabilities to eliminate minimal attack plans.
That is, we use the various metrics computed over the different graphs to rank the vulnerabilities to be fixed, and check which ranking identifies vulnerabilities that are exploited by more attack plans and induces an increase in the minimal attack plan cost using less fixes.
6.1
Domains
Attack graphs available for research, such as data published in [13,9], contain artificially created ex-amples or simulated computer networks. We also explored a number of simulated attack graphs, but all of them are either too symmetric or too shallow (e.g. a single vulnerability per machine) to represent a real organization. As an example, we use the LocalPlus-20 dataset [9] to demonstrate that conclu-sions derived from it are very different from the concluconclu-sions derived from an attack graph of a real organization.
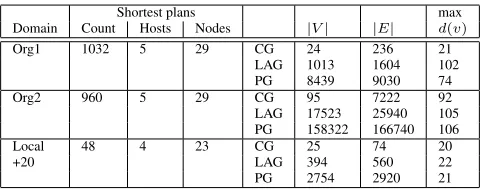
To collect data we scanned the networks of two real organization as described in Section 5. The details of the networks are presented in Table1. The hosts had a total of 144 important vulnerabilities which an attacker could leverage.
6.2
Methods
Table 1: Network statistics
Shortest plans max
Domain Count Hosts Nodes |V| |E| d(v)
Org1 1032 5 29 CG 24 236 21
LAG 1013 1604 102
PG 8439 9030 74
Org2 960 5 29 CG 95 7222 92
LAG 17523 25940 105 PG 158322 166740 106
Local 48 4 23 CG 25 74 20
+20 LAG 394 560 22
PG 2754 2920 21
Table 2: Spearman correlation between a centrality measure and the number of plans containing a vul-nerability. * denotesp-value>0.05.
Graph Centrality Org1 Org2 Local+20
PG All s-t 0.94/3.61 0.93/4310.0 1/0.44 Betweenness
PG PageRank 0.51/0.87 -0.027*/13.1 0.17/0.21 PG Closeness 0.44/0.66 0.63/34.1 0.26*/0.11 CG AVC 0.29/0.05 0.96/2.01 0.67/0.03 CG All pairs 0.28/0.03 0.96/2.12 0.39/0.01
Betweenness
LAG Closeness 0.27/0.47 0.024*/200.4 0.14*/0.03 Random -0.10*/0.06 0.006*/1.61 -0.17*/0.02
In the network connectivity graph (denoted CG below) nodes are computers, and vulnerabilities are not explicitly represented. Hence, for the connectivity graph we choose a computer based on the centrality measure, and fix all its vulnerabilities before moving to the next computer. In the logical attack graph (denoted LAG) and the planning graph (denoted PG), where vulnerabilities are explicitly represented as nodes, we directly rank the vulnerabilities to be fixed using the centrality measures. Hence, the fixing strategies often interleave vulnerability fixes over different computers.
A vulnerability appears only once in the LAG, but numerous times on different layers of the plan-ning graph. We thus rank the vulnerabilities in the planplan-ning graph by aggregating the centralities of all replicas of the vulnerabilities.
We compute the ground truth plan count by enumerating all attack plans as described in Section4. As we have explained above, this process is computationally intensive for large networks, but for the real networks explored in this study we managed to enumerate the set of all shortest plans, and we use this set to evaluate how many plans are removed with each vulnerability that is fixed.
6.3
Results
The use of graph centrality measures is based on the assumption that there is a strong correlation be-tween the centrality score and the number of attack plans in which a vulnerability is used. We begin with evaluating this assumption. We hence computed the Spearman correlation between each centrality measure and number of shortest plans containing the vulnerability.
(a) Org1
(b) Org2
(c) Local+20
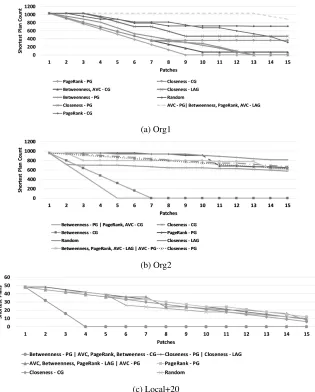
Figure 4: Number of shortest attack plans (y axis) available after applyingkpatches (x axis) to the most central nodes, according to the different centrality methods.
followed by Closeness and PageRank. State-of-the-art technique that achieves the closest performance is the AVC computed on the Connectivity Graph withp = 0.025. We can clearly see from Table2
that the planning graph provides more useful information for estimating the number of plans in which vulnerabilities appear.
Next, we simulated the process of applying patches to vulnerabilities using the ranking of each centrality measure, estimating the reduction in the number of shortest attack plans following the policy dictated by the centrality measure.
results over the two real networks. On Org1 the best metric is PageRank over the planning graph, while on Org2 the best metric is Betweenness over the planning graph.
Over the 3 domains, no centrality measure applied on LAG produced competitive results. This is surprising given the popularity of LAGs in attack analysis research.
Org2 seems to be the most difficult network. On this domain most metrics failed to decrease the number of plans faster than a random selection. Looking at Table 1 we can see that this is also the network with the most complicated graphs in all representations, even though it has a similar number of shortest plans to Org1.
The artificial Local+20 network produces the lowest number of plans, as well as the simplest graphs. This further shows that artificial networks provide poor simulation of real world networks. The differ-ence between the performance of the metrics over the real network and the simulated benchmark clearly present the urgent need for experiments with real world data. Simulated networks in this case may not model properly the real world, and benchmarks based on them may be misleading.
7
Conclusion and Future Work
We discuss centrality metrics for ranking vulnerabilities to be fixed in a computer network. We focus on the problem of eliminating shortest attack plans. We show that the planning graph, a data structure from automated planning, provides better information than the traditional LAG.
We experiment with two real world attack graph, obtained by scanning the computer networks of two organizations. As such, this is one of the first papers to report results over an attack graph of a real network. We also experimented with a standard simulated benchmark. It is interesting to see that the results over the simulated network are very different from the results over the real network, emphasizing the need for additional real world networks for experiments.
In the future we intend to experiment with additional real world networks. In absence of publicly available real world attack graphs, future research may focus on methods for generation of random attack graphs which resemble real world samples. We would also explore additional optimization problems, such as removing all identified attack plans. Enumeration of shortest plans using the planning graph defines a new vulnerability ranking metric based on the count of plans which require the vulnerability. The exact plan enumeration procedure has an exponential complexity. Thus, we will explore sampling methods for rapid estimation of the set of shortest plans.
Acknowledgements
This work was partially supported by the CBG Cyber Security Center at Ben Gurion University of the Negev, and by ISF grant 933/11.
References
[1] Massimiliano Albanese, Sushil Jajodia, and Steven Noel. Time-efficient and cost-effective network hardening using attack graphs. InDependable Systems and Networks (DSN), 2012 42nd Annual IEEE/IFIP International Conference on, pages 1–12. IEEE, 2012.
[2] Jay Beale, Renaud Deraison, Haroon Meer, Roelof Temmingh, and Charl Van Der Walt. Nessus network auditing. Syngress Publishing, 2004.
[3] Somak Bhattacharya and SK Ghosh. An attack graph based risk management approach of an enterprise lan.
[4] Avrim L Blum and Merrick L Furst. Fast planning through planning graph analysis. Artificial intelligence, 90(1):281–300, 1997.
[5] Ulrik Brandes. On variants of shortest-path betweenness centrality and their generic computation. Social Networks, 30(2):136–145, 2008.
[6] Daniel Bryce and Subbarao Kambhampati. A tutorial on planning graph based reachability heuristics. AI Magazine, 28(1):47–83, 2007.
[7] Michel Cukier and Susmit Panjwani. Prioritizing vulnerability remediation by determining attacker-targeted vulnerabilities.IEEE Security & Privacy, 7(1):42–48, 2009.
[8] LS Homem De Mello and Arthur C Sanderson. And/or graph representation of assembly plans. IEEE Trans-actions on Robotics and Automation, 6(2):188–199, 1990.
[9] Karel Durkota, Viliam Lis`y, Branislav Boˇsansk`y, and Christopher Kiekintveld. Optimal network security hardening using attack graph games. InProceedings of IJCAI, pages 7–14, 2015.
[10] Linton C Freeman. A set of measures of centrality based on betweenness.Sociometry, pages 35–41, 1977. [11] Avitan Gefen and Ronen I Brafman. Pruning methods for optimal delete-free planning. InICAPS, 2012. [12] J¨org Hoffmann. The metric-ff planning system: Translating“ignoring delete lists”to numeric state variables.
Journal of Artificial Intelligence Research, 20:291–341, 2003.
[13] J¨org Hoffmann. Simulated penetration testing: From” dijkstra” to” turing test++”. InICAPS, pages 364–372, 2015.
[14] Jin B Hong and Dong Seong Kim. Scalable security analysis in hierarchical attack representation model using centrality measures. InDependable Systems and Networks Workshop (DSN-W), 2013 43rd Annual IEEE/IFIP Conference on, pages 1–8. IEEE, 2013.
[15] Jin B Hong, Dong Seong Kim, and Abdelkrim Haqiq. What vulnerability do we need to patch first? In
Dependable Systems and Networks (DSN), 2014 44th Annual IEEE/IFIP International Conference on, pages 684–689. IEEE, 2014.
[16] Heqing Huang, Su Zhang, Xinming Ou, Atul Prakash, and Karem Sakallah. Distilling critical attack graph surface iteratively through minimum-cost sat solving. InProceedings of the 27th Annual Computer Security Applications Conference, pages 31–40. ACM, 2011.
[17] Bill Morrow. Byod security challenges: control and protect your most sensitive data. Network Security, 2012(12):5–8, 2012.
[18] Jorge Lucangeli Obes, Carlos Sarraute, and Gerardo Richarte. Attack planning in the real world. arXiv preprint arXiv:1306.4044, 2013.
[19] Xinming Ou, Wayne F Boyer, and Miles A McQueen. A scalable approach to attack graph generation. In
Proceedings of the 13th ACM conference on Computer and communications security, pages 336–345. ACM, 2006.
[20] Xinming Ou, Sudhakar Govindavajhala, and Andrew W Appel. Mulval: A logic-based network security analyzer. InUSENIX security, 2005.
[21] Lawrence Page, Sergey Brin, Rajeev Motwani, and Terry Winograd. The pagerank citation ranking: Bringing order to the web. Technical report, Stanford InfoLab, 1999.
[22] Reginald E Sawilla and Xinming Ou. Identifying critical attack assets in dependency attack graphs. In
European Symposium on Research in Computer Security, pages 18–34. Springer, 2008.
[23] Dorin Shmaryahu. Constructing plan trees for simulated penetration testing. InThe 26th International Con-ference on Automated Planning and Scheduling, page 121, 2016.
[24] Adam Shostack. Quantifying patch management.Secure Business Quarterly, 3(2):1–4, 2003.
[25] Teodor Sommestad and Fredrik Sandstr¨om. An empirical test of the accuracy of an attack graph analysis tool.
Information & Computer Security, 23(5):516–531, 2015.
[27] Lingyu Wang, Tania Islam, Tao Long, Anoop Singhal, and Sushil Jajodia. An attack graph-based probabilistic security metric. InData and applications security XXII, pages 283–296. Springer, 2008.