ISSN: 2372-4951 (Print), 2372-496X (Online) Copyright ©The Author(s). All Rights Reserved. Published by American Research Institute for Policy Development DOI: 10.15640/smq.v4n4a2 URL: https://doi.org/10.15640/smq.v4n4a2
Drivers of Strategic Success in a Crisis Environment
João Conrado De Amorim Carvalho1
Abstract
The environment in which businesses operate is subject to turbulences and contingencies. These variations affect businesses’ performance and determine how they should be adjusted to overcome difficulties. This research sought for answers to explain why certain companies work in a turbulent environment and achieve good performance while others do not. As objectives, it sought to understand which drivers were chosen and used by companies that have overcome adversity, as these drivers are related and if it is possible to reduce to a smaller set of drivers without losing evaluate quality. A survey was conducted through questionnaires applied to a sample of 108 Brazilian companies. The answers were submitted to exploratory and confirmatory factor analysis. The results indicated high explanatory power of the drivers without reducing the number of factors, although the structural modeling equations (SEM) indicated that the model of four drivers as the one that best suits the selected sample.
Keywords: Strategy; Contingency; Crisis; Performance; Fit
1. Introduction
The business world has been surprised in recent years by successive economic crises. The Subprime Financial Crises (2007-2008) was probably the worst since the 1930s. Following that and while the companies were still recovering, a new crisis settled in the Euro Zone, affecting the world economy (Zhao et al, 2014).Turbulence seems to be a component in the business management process and transit between periods of growth and fall requires managers capable of adapting business to contingencies.
Companies established in developing countries, such as Brazil, are also affected by international crises and still must overcome the challenges of internal crises. The effects of international crises only began to be perceived by Brazilian companies in 2011. Still, the expansion of credit, the rise of millions of people in the social scale, and the distribution of benefits to poor people delayed the necessary adjustments that should have been made in the Companies. The following years were marked by aggravation of the economic crisis and by corruption investigations involving the most important authorities of the country. The troubled environment resulted in the impeachment of the President of the Brazilian Federal Republic and the arrest of important authorities and businessmen.
The trajectory of the Brazilian economy reveals the dimension of the instability that affects companies. Under these conditions, some companies can read the environment, adjust their strategic plans and achieve good results while other companies do not achieve the desired results. This research sought to understand which drivers explain the strategic success and if it is possible to reduce the number of them without losing the explanatory quality. Drivers are the courses of strategic action that will establish the structural differences of competitors and ensure competitive advantage. Generally, companies choose their drivers at the time of strategic formulation, which requires deep analysis of the internal and external environment to capture the aspects that have the power to positively or negatively impact the business.
2. Background
To generate competitive advantage, resources must be valuable, rare, difficult to replicate and replace and this is the conceptual basis of the resource-based view (RBV). Teece et al (1997), Chandler (1998), Prahalad and Hamel (1998) postulate the company's need to reconfigure and renew its resources to face competition. The external environment, on the other hand, is related to the systemic view of the companies and their relations with stakeholders. Granovetter (1985), Wright et al (2000) and Murray (1978) argue that firms are part of a broader social system and are influenced by cultural, political, religious, technological and economic values. The pressure from stakeholders compels companies to continually review their plans. The Theory of Stakeholders arose from a pioneering work by Freeman (1984). Donaldson and Preston (1995) defined stakeholders as people or groups with legitimate interests in the company. Hill and Jones (1992) added that stakeholders supply firms with critical resources and expect in return to maximize their interests.
2.1. Development of research hypotheses
This work selected from literature seven drivers used by companies to achieve performance, divided into two broad categories: 1) internal: Learning (APZ); Management support (APG); Technology, innovation and diversification (TID);2) external: Market and costumer (MCL);Relationship network (RRL);Competition (CPC); Legislation (LEG).
According to Chandler (1962), Mintzberg et al (1998), Miles et al (1978), Mintzberg (1978) e Su et al (2014) top management support (APG) has positive effect on performance, mainly through improvements in innovation. Schrettle et al (2014)and Li et al (2012) identify the importance of leadership support in resource commitment when environmental changes are perceived and organizational renewal becomes necessary. Li and Zhou (2010) analyze the interaction between managers and external partners to maximize efficiency in resource allocation. Wu et al (2012) and Leonidou et al (2015) emphasize top management’s support for environmental practices associated with better use of communication channels and rewards systems for green initiatives. These statements raise three hypotheses that associate different drivers.
H2 - The support of top management (APG) is decisive in the selection of new technologies and investment in innovation and diversification (TID) that will impact performance;
H3 - High management support (APG) facilitates communication with the relationships network (RRL) and optimization of critical resources that will impact performance.
Learning organizational (APZ) has been highlighted as essential to performance since early works about strategy. Teece et al (1997), Pisano (1994), Su et al (2014) and Grant (1996) assert that sustainable competitive advantage requires development of dynamic capabilities, as learning, that is difficult to imitate and it is unique of each company. Camison and Villar-López (2011) report maintain that learning happens when a company creates, acquires, transfers and integrates knowledge and modifies its behavior to reflect new cognitive situations to improve performance. Hamel (1991) asserts that learning is a core competence that creates value in relationships with partners. So, learning stems from the support of top management (Pisano, 1994; Grant, 1996) and directly influences the selection and use of technology and innovation, two internal drivers critical for organizational performance and long-term competitive advantage (Ferreira et al, 2015, Gerschewski et al, 2014).Technology, innovation and diversification (TID) are being addressed by Hicks (1946), Chandler (1962), Wernerfelt (1984), Barney (1991), Porter (1991) and Burton et al (2013) as essential for strategic success.
H4 - The commitment to learning (APZ) is directly related to technological updating and capacity for innovation and diversification (TID);
H5 - The technological updating, innovation capacity and diversification (TID) are crucial factors for the adjustment of the organizational design and consequent reduction of uncertainties and adaptation of the company to the environmental contingencies.
Market and clients (MCL) are important drivers of strategic success and have been discussed by Ansoff (1987), Porter (1991, 1998), Astley and Van de Ven (1983), Wernerfelt (1978), Kaplan and Norton (1992), Burton and Öbel (1995). In its Diamond Model, Porter (1991) states that demand conditions are major determinant of competitive advantage and that customer pressures influence quality, price and services in an industry. They also affect the pace and direction of innovation. Claro et al. (2013) teach maintain that the company must learn about its clients and perform activities centered on them, which are the active participants in the changes.
Wernerfelt (1984), Chen et al (2009) and Porter (1991 and 1998) explain that collaboration between companies is essential because it involves the efficient use of resources. Porter (1991) highlights the relationship network as one of the crucial factors for success, especially when it shares mechanisms of learning, innovation and technology, within a synergy and interchange relationship. Claro et al (2013) addressed the issue from the perspective of supplier partnerships to achieve efficiency gains. Schrettle et al (2013) include other stakeholders, as suppliers, consumers, competitors and shareholders and the importance of identify their demand to ease pressures and obtain benefits.Thus, two hypotheses were proposed relating to drivers selected in this work.
H6 - The market and customer requirements (MCL) affects learning (APZ) in order to drive innovation and product development (TID);
H7 - Sharing learning (APZ), technology and innovation (TID) with the relationship network (RRL) promotes strategic success by reducing costs and optimizing firm-critical resources.
Agan et al (2013) add that these threats are sources of innovation. Wu et al (2012) believe that the industry is affected by government willingness to invest, provide incentives, improve infrastructure, offer technical and financial support, foster relationships networks, and this impacts drivers such as technology and innovation.The competition (CPC) was cited in Chandler(1962), Porter (1998/1991) and Wright et al (2000). Porter (1991) points out that drivers previously discussed have direct effects on competition within an industry. He states that the way companies are managed in the sense of competing and innovating also stems from aspects that are influenced by the conditions of a country, such as legislation and political-economic perspectives. In this sense, Claro et al (2013) state that economic instability can cause unexpected changes and generate surprise for companies. One hypothesis was proposed in line whit these statements.
H8 – Legislation (LEG) affects the market (MCL) and competition (CPC) in determining technologies and innovation (TID), redistributing costs and benefits, and threatening punishments.
Considering that there is no consensus among the different measures or ways to evaluate the performance of companies in the light of a successful strategy and that in highly volatile environments such as that the one currently experienced by Brazilian companies, this work considered that strategic success will be measured by multiple criteria. Companies that are holding their position in the market or are adopting a cautious stance while the market signals remain undefined are considered as successful in terms of strategy. These companies usually take the leading role, dictating paths that are followed by competitors who are not achieving the same result. On the other hand, companies that did not reach strategic success are all those that could not resist the effects of the economic crisis and that, for that reason, paralyzed their activities or presented negative results in consecutive exercises. By this way, they stopped generating value for the shareholders and started to show uncertainties about the continuity of their operations.
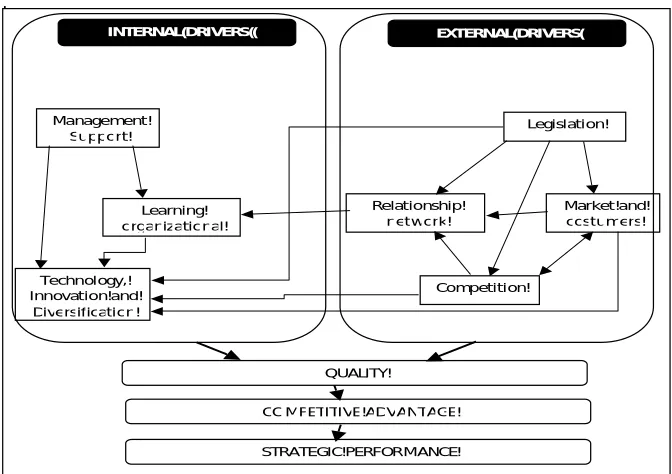
2.2. Conceptual model
The support of top management to provide technological resources, innovations and diversification will allow companies to offer superior products resulting in the competitive advantage that will ensure their permanence in the market and, by extension, strategic success.
Figure 1: Conceptual Model
3. Materials and Methods
This work required an extensive bibliographical revision in the main international scientific journals, newspapers and books that deal with the issue related to strategy, crisis and success, to understand how companies choose and use the drivers that can justify strategic success. The research was done by exploratory factorial analysis to verify if the strategic success is better justified by the set of seven selected drivers or if it is possible to reduce them to a smaller set of factors, using the SPSS (IBM) software. Next, the model was tested through confirmatory factorial analysis (structural equation modeling – SEM) and adjusted to better explain strategic success through the selected drivers, using the AMOS (IBM) software AMOS.
!
!
!
!
!
!
!
!
!
!
!
!
!
!
!
!
!
!
!
!
INTERNAL(DRIVERS(( EXTERNAL(DRIVERS(
Market!and! costumers! Legislation!
Competition! Relationship!
network! Learning!
organizational! Management!
Support!
Technology,! Innovation!and!
Diversification!
QUALITY!
COMPETITIVE!ADVANTAGE!
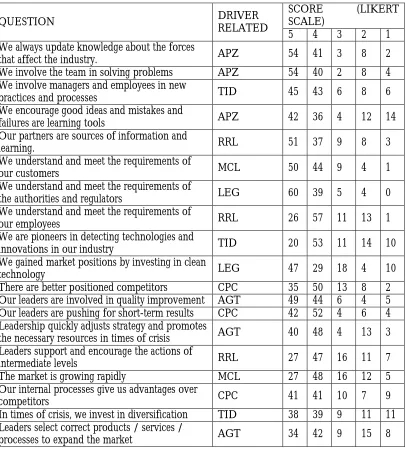
Table 1: Questions, drivers related and score
QUESTION DRIVER
RELATED
SCORE (LIKERT
SCALE)
5 4 3 2 1
We always update knowledge about the forces
that affect the industry. APZ 54 41 3 8 2
We involve the team in solving problems APZ 54 40 2 8 4 We involve managers and employees in new
practices and processes TID 45 43 6 8 6
We encourage good ideas and mistakes and
failures are learning tools APZ 42 36 4 12 14
Our partners are sources of information and
learning. RRL 51 37 9 8 3
We understand and meet the requirements of
our customers MCL 50 44 9 4 1
We understand and meet the requirements of
the authorities and regulators LEG 60 39 5 4 0
We understand and meet the requirements of
our employees RRL 26 57 11 13 1
We are pioneers in detecting technologies and
innovations in our industry TID 20 53 11 14 10
We gained market positions by investing in clean
technology LEG 47 29 18 4 10
There are better positioned competitors CPC 35 50 13 8 2 Our leaders are involved in quality improvement AGT 49 44 6 4 5 Our leaders are pushing for short-term results CPC 42 52 4 6 4 Leadership quickly adjusts strategy and promotes
the necessary resources in times of crisis AGT 40 48 4 13 3 Leaders support and encourage the actions of
intermediate levels RRL 27 47 16 11 7
The market is growing rapidly MCL 27 48 16 12 5
Our internal processes give us advantages over
competitors CPC 41 41 10 7 9
In times of crisis, we invest in diversification TID 38 39 9 11 11 Leaders select correct products / services /
processes to expand the market AGT 34 42 9 15 8
4. Results
Table 2: Characteristics of the sample companies
Type # % Sector # % Size # %
Private 97 88,8 Industry 16 14,8 Micro/small 54 50,0
Public 7 6,5 Commerce 17 15,8 Medium 25 23,2
3rd sector 4 3,7 Service 75 69,4 Big 29 26,8
Total 108 100 Total 108 100 Total 108 100
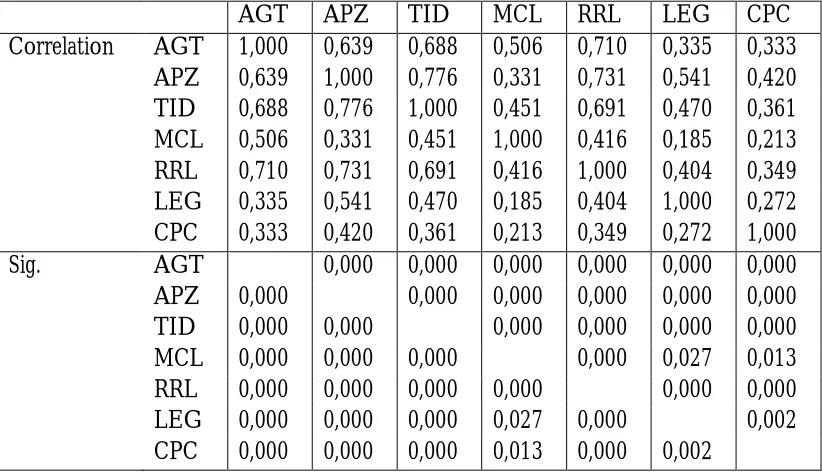
To test the reliability of the questionnaire, the Conbach's alpha was used. The value found of 0.8861 is higher than the recommended value of 0.70 (Christimann and Van Aelst, 2006).The F ANOVA and T test were applied to the Hotelling’s T square, with the objective of comparing the equality of means between two or more groups of variables. The KMO (Kaiser-Meyer-Olkin) test, with a score of 0.868, and Bartlett's sphericity test, with significance below 0.05, revealed a high explanatory power between the factors. The results for p-value confirm that the variances are equal to the level of significance of 0.05 and that there is no iteration among the variables analyzed.Table 3 (correlation matrix and anti-image matrix) shows that most of the factors presented satisfactory results (above 0.5000) and that the significance test revealed values close to zero.
Table 3 Correlation and anti-image matrix
AGT APZ TID MCL RRL LEG CPC
Correlation AGT 1,000 0,639 0,688 0,506 0,710 0,335 0,333
APZ 0,639 1,000 0,776 0,331 0,731 0,541 0,420
TID 0,688 0,776 1,000 0,451 0,691 0,470 0,361
MCL 0,506 0,331 0,451 1,000 0,416 0,185 0,213
RRL 0,710 0,731 0,691 0,416 1,000 0,404 0,349
LEG 0,335 0,541 0,470 0,185 0,404 1,000 0,272
CPC 0,333 0,420 0,361 0,213 0,349 0,272 1,000
Sig. AGT 0,000 0,000 0,000 0,000 0,000 0,000
APZ 0,000 0,000 0,000 0,000 0,000 0,000
TID 0,000 0,000 0,000 0,000 0,000 0,000
MCL 0,000 0,000 0,000 0,000 0,027 0,013
RRL 0,000 0,000 0,000 0,000 0,000 0,000
LEG 0,000 0,000 0,000 0,027 0,000 0,002
Once the total variance had been analyzed and explained, it revealed that the model with seven drivers presents a single factor capable of explaining 56.183% of the data variance, which is not very high, but the first five factors explain 93.2% of the variance, which is very significant. However, to increase the explanatory power of the factors, the Market and Customers (MCL), Legislation (LEG) and Competition (CPC) drivers were withdrawn, with explanatory power lower than 0.5000. However, to increase the explanatory power of the factors, a new factorial analysis was carried out, removing the Market and Customers (MCL), Legislation (LEG) and Competition (CPC) drivers, which presented low correlation. It is noticed that, when removing the Drivers Legislation (LEG) and Competition (CPC), there is increase of explanation of the accumulated variance to 96.1% with only four drivers. The gain is also reflected in the fact that a single factor accounts for 68.4% of the variance. On the other hand, when removing the driver Market and Clients (MCL), the explanation of the cumulative variance dropped to 95%, with a single factor explaining 77.85% of the total variance.
The five-driver model offers a small advantage over the seven-driver model to better explain strategic success. This is because drivers act interdependently, influencing each other. In addition, since only one component was extracted by the SPSS software when calculating the Total Explanation Variance, it is not possible to perform the rotation by the Varimax criterion, that is, it is not possible to reduce the number of factors. Structural equations modeling (SEM) sought to expand the model's explanatory capacity because there is more than one dependent variable and the issues are interrelated (Hair et al., 2005), Schumacker and Lomax; 2010) and Byrne; 2010).The initial model was designed in AMOS software (IBMS) using path diagram. Each of the seven drivers was considered a construct explained by the answers to the nineteen questions formulated to the 108 companies surveyed. Arrow curves indicated the correlations between drivers, as established in the hypotheses proposed. The option chosen was the Maximum Likelihood Estimation (MLE), because it is more efficient, not subject to bias and variables are considered normally distributed when there is no excess of kurtosis (Hair et al, 2005).
The root mean square residual (RMR) value was 0.094, considered to be optimal. On the other hand, the goodness-of-fit index (GFI) and its adjusted variant (AGFI) showed values of 0.803 and 0.714 respectively, close to the ideal above 0.900 reported by Byrne (2010).In the same sense, the normed fit index (NFI) and the comparative fit index (CFI) presented values of 0.716 and 0.819 respectively, close to what would be desirable (> 0.900).Other indexes tested were also close to desirable, such as the incremental fit index (IFI) and the Tucker-Lewis index (TLI) with values of 0.629 and 0.764. The root mean square error of approximation (RMSEA) was 0,102, considered weak, despite of sample size is considered small.
The analysis of the modification index (MI) revealed that two parameters presented covariance above the expected value, related to questions 7 and 8 and 18 and 19. Byrne (2010) clarifies that these cases can be derived from a small factor that has been omitted, prejudices from the Respondents or overlapping content.In this case, the problem possibly derives from the overlapping of content in the face of similarity of the questions. Thus, path diagrams considering the exclusion of two and three drivers, including curved arrows that indicate the correlation between the variables related to questions 7 and 8 and 18 and 19 were developed.
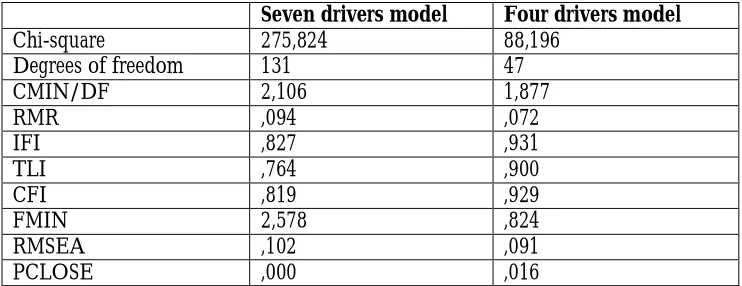
The model's goodness of statistics fit of four drivers (excluding the MCL, LEG, and CPC drivers) revealed a substantial improvement in model fit. The CMIN/DF ratio was 1.877, within the ideal range of 1.0 to 2.0. The RMR indicator was reduced to 0.072 and the IFI indicators Delta2 (0.931), TLI rho2 (0.900) and CFI (0.929) were in the desired mark, greater than 0.900. The RMSEA index (0.091) was below the considered good fit value (<0.10).Table 4 shows comparison of the goodness statistics of the seven model and four drivers.
Table 4 Adjustment parameters of the models
Seven drivers model Four drivers model
Chi-square 275,824 88,196
Degrees of freedom 131 47
CMIN/DF 2,106 1,877
RMR ,094 ,072
IFI ,827 ,931
TLI ,764 ,900
CFI ,819 ,929
FMIN 2,578 ,824
RMSEA ,102 ,091
5. Conclusions
The exploratory factorial analysis applied in 108 samples from companies of different sizes and economic sectors revealed that the drivers selected in the literature have a strong correlation. In the complete model (seven drivers), five of them can explain 93.2% of the variances. The model of five drivers (excluding LEG and CPC drivers) achieved 96.1% explanation of the accumulated variance with four drivers and the model of four drivers (excluding LEG, CPC and MCL drivers) reached a 95% explanation with only four Drivers. It was noticed that the advantage obtained in the models of five and four drivers is very small to justify the elimination of the drivers, besides it was not possible to perform the rotation by the Varimax criterion, inhibiting the reduction of the factors.
In sequence, confirmatory factorial analysis (modeling of structural equations - SEM) was performed using the same set of data obtained from a sample of 108 companies. The complete model (seven drivers) revealed indicators of goodness of the model very close to the ideal, but with two values of variance higher than expected, related to questions 7 and 8 and 18 and 19. For this reason, it was necessary to extend the analysis to alternative models building new path diagrams based on the five and four driver models already tested in the exploratory factorial analysis. The indicators of goodness of the four driver’s model, in which the Market and Customers (MCL), Competition (CPC) and Legislation (LEG) drivers were excluded, presented a better fit, revealing that this model reflects the drivers' ability to justify strategic success.
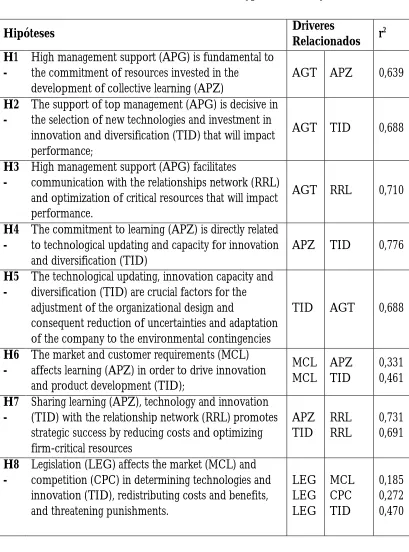
Table 5 Correlation matrixes and hypotheses analysis
Hipóteses Driveres
Relacionados r
2
H1 -
High management support (APG) is fundamental to the commitment of resources invested in the
development of collective learning (APZ)
AGT APZ 0,639
H2 -
The support of top management (APG) is decisive in the selection of new technologies and investment in innovation and diversification (TID) that will impact performance;
AGT TID 0,688
H3 -
High management support (APG) facilitates
communication with the relationships network (RRL) and optimization of critical resources that will impact performance.
AGT RRL 0,710
H4 -
The commitment to learning (APZ) is directly related to technological updating and capacity for innovation and diversification (TID)
APZ TID 0,776
H5 -
The technological updating, innovation capacity and diversification (TID) are crucial factors for the adjustment of the organizational design and
consequent reduction of uncertainties and adaptation of the company to the environmental contingencies
TID AGT 0,688
H6 -
The market and customer requirements (MCL) affects learning (APZ) in order to drive innovation and product development (TID);
MCL MCL APZ TID 0,331 0,461 H7 -
Sharing learning (APZ), technology and innovation (TID) with the relationship network (RRL) promotes strategic success by reducing costs and optimizing firm-critical resources APZ TID RRL RRL 0,731 0,691 H8 -
Legislation (LEG) affects the market (MCL) and competition (CPC) in determining technologies and innovation (TID), redistributing costs and benefits, and threatening punishments.
From the results highlighted in the previous table, it is clear that hypotheses H1, H2, H3, H4, H5 and H7 are confirmed by the high correlation between driver pairs (above 0.5000). Surprisingly, the responses related to hypothesis 6 did not reveal a strong correlation, indicating its non-confirmation. A possible explanation is described in Archibugi et al (2013). They noted that in times of crisis, companies reduce innovation spending and limit investment in new markets and fast-growing products. Hypothesis 8 considers legislation (LEG), market and customers (MCL), and competition (CPC) as main forces in determining technology adequacy, innovation, and diversification.
The non-confirmation of this hypothesis can be explained from the findings of Agan et al (2013). They realized that legislation is more directed at solving specific problems and, therefore, has a low influence on market demand and competition to pressure investments in technology, innovation and diversification. In addition to the explanations given by Archibugi et al (2013) and Agan et al (2013), it should be considered that research questionnaires placed on social networks may have been answered by people working in departments that do not deal with investments in technology, Innovation and diversification and, for this reason, they cannot perceive the correlation between the drivers.
In addition, the drivers that presented low correlation in hypotheses 6 and 8 revealed strong correlation in association with other drivers in the confirmed hypotheses. For example, it is not possible to understand the supply of good products and services without considering the effects of technology, innovation and diversification pressured by market and customer demand and competition.The strategic success necessarily passes through learning from the capture of market information, hence why one cannot fail to consider the importance of the Market / Clients for strategic success. This information is crucial for companies to assess the environment, internally discuss ways to act, and create opportunities in a turbulent environment. Opportunities will only materialize if companies can meet customer needs by delivering innovative products.
Figure 2 Adjusted conceptual model
Figure 2 shows the adapted conceptual model. It should be noted that the dashed lines indicate that the external drivers Legislation, Market and customers and Competition only minimally affect the Network of relationships to motivate the necessary learning to the development of new Technologies, innovations and diversifications supported by the High Management to determine new standards of quality which facilitate strategic success. On the other hand, it is noticed that the Learning is supported by the High Management and obtained from the Network of Relationships and this Learning affects new Technologies, innovations and diversifications. However, the calculated correlations were not strong enough to indicate how the Relationship Network conveys Learning. Although the most appropriate model in structural equation analysis has been the four-conductor model, it is highly likely that this design was influenced by the level of perception of the respondents. For this reason, this research concludes that the seven selected drivers are strong indicators and, if chosen and well used by the companies, can contribute to achieve their best performance.
! ! ! ! ! ! ! ! ! ! ! ! ! ! ! ! ! ! ! !
INTERNAL(DRIVERS(( EXTERNAL(DRIVERS(
Market!and! costumers! Legislation!
Competition! Relationship!
network! Learning!
organizational! Management!
Support!
Technology,! Innovation!and! Diversification!
QUALITY!
COMPETITIVE!ADVANTAGE!
References
AGAN, Y.; ACAR, M. F.; BORODIN, A. (2013)Drivers of Environmental
Processes and their Impact on Performance: a Study of Turkish SMEs.
Journal of Cleaner Production 51, 22-33.
ANSOFF, H. I. (1987) Corporate Strategy. Penguin Books.
ARCHIBUGI, D.; FILIPPETTI, A.; FRENZ, M. (2013)Economic Crisis and
Innovation: Is Destruction Prevailing over Accumulation? Research
Policy 42, 303-314.
ASTLEY, W. G.; VAN DE VEN, A. H. (1983)Central Perspectives and Debates
in Organizational Theory. Administrative Science Quarterly, Vol. 28, No. 2
(Jun), pp. 245-273.
BARNEY, J. (1991)Firm Resource and Competitive Advantage. Journal of Management, Vol. 17, No. 1, 99-120.
BYRNE, B. M. (2010)Structural Equation Modeling whit AMOS: Basic
Concepts, Applications and Programming. 2nd ed. New York: Routledge – Taylor & Francis Group.
BURTON, R. M.; ÖBEL, B. (1995)Strategic Organizational Diagnosis and
Design. Developing Theory for Application. USA: Kluwer Academic
Publishers, 461 p.
CAMISÓN, C.; VILLAR-LÓPEZ, A. (2011)Non-Technical Innovation:
Organizational Memory and Learning Capabilities as Antecedent Factors with Effects on Sustained Competitive Advantage. Industrial
Marketing Management 40, 1294-1304.
CHANDLER, A. Introduction a Strategy and Structure. In. McCRAW, T. (Org.). (1998)Alfred Chandler – Ensaios para uma Teoria Histórica da Grande
Empresa. Rio de Janeiro: FGV.
CHEN, H. H.; LEE, P. Y.; LAY, T. J. (2009)Drivers of Dynamic Learning and
Dynamic Competitive Capabilities in International Strategic Alliances.
Journal of Business Research, 62, 1289-1295.
CHRISTIMANN, A.; VAN AELST, S. (2006)Robust Estimation of Cronbach’s
Alpha. Journal of Multivariate Analysis, Vol. 97, 1660-1674.
CLARO, D. P.; LABAN NETO, S. A.; CLARO, P. B. O. (2013)Sustainability
Drivers in Food Retail. Journal of Retailing Services, 20, 365-371.
DONALDSON, T.; PRESTON, L. E. (1995)The Stakeholder Theory of the
Corporation: Concepts, Evidence, and Implications. Academy of
Management Review, Vol. 20, No. 1, 65-91.
EFRAT, K.; SHOHAM, A. (2012)Born Global Firms: The Differences Between
their Short- and Long-Term Performance Drivers. Journal of World
FERREIRA, J. M.; FERNANDES, C. I.; ALVES, H.; RAPOSO, M. L. (2015)Drivers of Innovation Strategues: Testing the Tidd and Bessant
(2009) Model. Journal of Business Research, 68, 1395-1403.
FREEMAN, R. E. (1984)Strategic Management: a Stakeholder Approach. Boston: Pitman.
GERSCHEWSKI, S.; ROSE, E. L.; LINDSAY, V. J. (2014) Understanding the
Drivers of International Performance Global Firms: An Integrated Perspective. Journal of World Business.
GRANOVETTER, M. (1985)Economic Action and Social Structure: the
Problem of Embeddedness. American Journal of Sociology, Vol. 91, Issue
3, Art. 9, 481-510.
GRANT, R. M. (1996)Toward a Knowledge-Based Theory of the Firm. Strategic Management Journal, Vol. 17. Special Issue: Knowledge and the Firm.
HAIR, JR. J. F.; ANDERSON, R. E.; BLACK, W. C. (2005)Análise Multivariada
de Dados. 4. Ed. Porto Alegre: Bookman.
HAMEL, G. (1991)Competition for Competence and Inter-Partner Learning
Within International Strategic Alliances. Strategic Management Journal,
Vol. 12, Special Issue: Global Strategy, 83-103.
HICKS, J. R. (1946) Value and Capital: an Inquiry Into Some Fundamental
Principles of Economic Theory. 2nd edition. Oxford University Press.
HILL, C. W.; JONES, T. M. (1992)Stakeholders-Agency Theory.Journal of Management Studies, 29:2.
INSTITUTO BRASILEIRO DE GEOGRAFIA E ESTATÍSTICAS – IBGE. (2013)Estatísticas de cadastro central de empresas 2013. Available: www.ibge.gov.br. Acess: 18/05/2016, 10:02h.
INSTITUTO BRASILEIRO DE PLANEJAMENTO TRIBUTÁRIO – IBPT. (2016) Empresômetro – Censo das Empresas e Entidades Públicas e
Privadas Brasileiras.Available: http://ibpt.com.br. Acess: 11/06/2016,
14:21h.
KAPLAN, R. S.; NORTON, D. P. (1992)The Balanced Scorecard: Measures
That Drive Performance. Harvard Business Review.
LEONIDOU, L. C.; FOTIADIS, T. A.; CHRISTODOULIDES, P.;
SPYROPOULOU, S.; KATSIKEAS, C. S. (2015)Environmentally Friendly
Export Business Strategy: Its Determinants and Effects on Competitive Advantage and Performance. International Business Review.
LI, J. J.; ZHOU, K. Z. (2010)How Foreign Firms Achieve Competitive
Advantage in the Chinese Emerging Economy: Managerial Ties and Markets Orientation.Journal of Business Research, 856-862.
LI, W.; HUMPHREYS, P. K.; YEUNG, C. L.; CHENG, T. C. E. (2012)The Impact
MILES, R. E.; SNOW, C. C.; MEYER, A. D.; COLEMAN JR, H. J. (1978)Organizational Strategy, Structure and Process. Academy of Management Revew.
MINTZBERG, H. (1978)Patterns in Strategy Formation. Management Science, Vol. 24, No. 9, 934-945.
MINTZBERG, H.; AHLSTRAND, B.; LAMPEL, J. (1998) Strategy Safari: a
Guided Tour Through the Wilds of Strategic Management. The Free
Press, New York.
MURRAY, E. A. Jr. (1978)Strategic Choice as a Negotiated Outcome. Management Science. Vol. 24, No. 9.
PISANO, G. P.(1994)Knowledge, Integration, and the Locus of Learning: na
Empirical Analysis of Process Development. Strategic Management
Journal, Vol. 15., Special Issue: Competitive Organizational Behavior, 85-100.
PORTER, M. E. (1989)Vantagem Competitiva. Rio de Janeiro: Campus.
PORTER, M. E. (1991)Towards a Dynamics Theory of Strategy. Strategic
Managment Journal, Vol. 12, 95-117.
PRAHALAD, C. HAMEL, G. A. (1998) Competência Essencial da Corporação. In. MONTGOMERY, C.; PORTER, M. Estratégia – a Busca da Vantagem
Competitiva. Rio de Janeiro: Campus.
SCHRETTLE, S.; HINZ, A.; SCHERRER-RATHJE, M.; FRIEDLI, T.
(2014)Turning Sustainability Into Action: Explaining Firm’s
Sustainability Efforts and their Impact on Firm Performance. Int. J.
Production Economics, 147, 73-84.
SCHUMACKER, R. E.; LOMAX, R. G. (2010) A Beginner’s Guide to Strucutral
Equation Modeling. 3rded. Taylor & Francis Group.
SU, H. D.; LINDERMAN, K.; SCROEDER, R. G.; VAN DE VEN, A. H. (2014)A
Comparative Case Study of Sustaining Quality as a Competitive Advantage. Journal of Operations Management, 32, 429-445.
TEECE, D. J.; PISANO, G.; SHUEN, A. (1997)A Dynamic Capabilities and
Strategic Management. Strategic Management Journal, Vol. 18, No. 7,
509-533.
WERNERFELT, B. (1984)A Resource-Based View of the Firm. Strategic Management Journal, 5, 5; pg. 171.
WHITTINGTON, R. (2002)O que é Estratégia. São Paulo: Thompson.
WRIGHT, P.; KROLL, M.; PARNELL, J. (2000)Administração Estratégica. São Paulo: Atlas.
WU, G. C.; DING, J. H.; CHEN, P. S. (2012) The effects of GSCM Drivers and
Institutional Pressures on GSCM Practices in Taiwan’s Textile and Apparel Industry. Int. J. Production Economics 135, 618-636.
ZHAO, X.; JIANG, X.; LI, Z. (2014) The Impact of the Economic Crisis on the
Financial Performance of Multinational Corporations. International