176
_______________________________________________________________
_______________________________________________________________
STABILITY INDICATING RP-HPLC METHOD FOR
SIMULTANEOUS ESTIMATION OF TRAVOPOST AND TIMOLOL
IN BULK AND PHARMACEUTICAL DOSAGE FORMS
R. V. Valli Kumari
*, P. VenkateswarRao, A. Sunitha, K. Keerthy
Department of Pharmaceutical Analysis& Quality Assurance, Malla Reddy Institute of Pharmaceutical Sciences, Maisammaguda, Telangana, India.
ABSTRACT
A Simple, precise and stability indicating RP-HPLC method for simultaneous estimation of Travopost and Timolol in bulk and pharmaceutical dosage form has been developed and validated.The chromatographic separation was carried out on Intersil ODS (150X4.6mm, 5µ) column using acetonitrile: buffer in the ratio of 10:90 % v/v as mobile phase .The flow rate was 1ml/min and effluent was detected at 213nm.The retention time of Travopost and Timolol were found to be 2.516 and 6.198min respectively. The method was linear over the concentration range of 12.5-75 µg/ml and 10-60 µg/ml for Timolol and Travopost respectively. The method was found to be precise as indicated by the repeatability analysis showing %RSD less than 2.Percentage recoveries for Travopost and Timolol were 100.27 and 100.41% respectively .All the validation parameters were determined and found within the limits as per ICH guidelines, which indicates validity of the method. Travopost and Timolol subjected to the stress conditions of acid, base, peroxide, thermal, UV& neutral degradation. The degradation products were well resolved from the main peak and its impurities, proving stability indicating ability of the method.
Key words: HPLC, Travopost,validation, stability indicating, Timolol.
INTRODUCTION
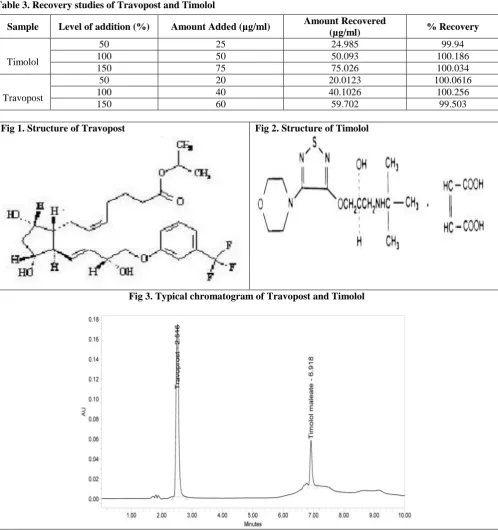
Travopost is asynthetic prostaglandin analog specifically an analog of prostaglandin F that works by increasing the outflow of aqueous fluid from eyes. It is indicated for the reduction of elevated intraocular pressure in patients with open angle glaucoma or ocular or hypertension .Chemically Travopost is propane-2-yl-7-[3,5-dihydroxy-2-[3-hydroxy-4-[3-(trifluoromethyl). phenoxy]-but 1-enyl]-cyclopentyl]hept-5-enoate.(Fig.1)
Timolol maleate is a non-selective βadrenergic receptor antagonist indicated for treating glaucoma, heart attacks, hypertension, migraine and headache. Chemically, Timolol is (S)-1-(tert-butylamino)-3-[(4-morpholin-4-yl-1,2,5-thiadiazol-3-yl)oxy]propan-2-ol.(Fig.2).Literature survey reveals that only one RP-HPLC method for the estimation of both drugs in combined form and several HPLC methods were developed for Timolol along with other drugs [1-3].
EXPERIMENTAL Reagents and chemicals
Travopost and Timolol reference standards were
gifted by Micro labsLtd. Bangalore, Karnataka.
Combination was procured from the local market in the form of injection, containing 4mg of Travopost and 5mg of Timolol. HPLC grade Acetonitrile and water were purchased from S.D.fine chem. Limited (Mumbai, India).Potassium dihydrogen orthophosphate (AR grade) was obtained from Rankem chemicals (Mumbai, India)
CHROMATOGRAPHIC CONDITIONS
Chromatographic separation was performed with Schimadzu(LC 20AT Vp) High performance liquid Chromatographic System equipped with autosampler and PDA detector. Chromatograms and data were recorded by means of Empower software.
The mobile phase containing acetonitrile and 0.02M potassium dihydrogen ortho phosphate (adjusted the pH to 3.10 with ortho phosphate acid) in the ratio of 10-90% v/v was delivered at a flow rate of 1ml/min with detection wavelength at 213nm. Separation was carried on Intersil ODS (150X 4.6mm, 5µ) column performed at ambient temperature [4].
*Corresponding Author R. V. ValliKumari E mail: [email protected]
International Journal
of
Pharmacy Review & Research
www.ijprr.com
177
PREPARATION OF STANDARD STOCK
SOLUTION
Standard stock solution of Travopost and Timolol was prepared separately using mobile phase (1mg/ml). From the stock solution, mixed standard solution of different concentrations ranging from 12.5-75 µg/ml of Timolol and 10-60 µg/ml of Travopost were prepared by using the same mobile phase. Chromatograms were recorded by injecting 10µl of each mixed standard solution. The retention time of Travopost and Timolol were found to be 2.516 and 6.918 min respectively (Fig.3).The method was linear over the above concentration range by plotting calibration curve of concentration against peak areas with correlation coefficients 0.999 and 0.999 for Travopost and Timolol respectively [5].
SAMPLE PREPARATION
Dilute 1ml of the injection to 100ml by using mobile phase from the above; prepare sample solution containing concentrations similar to the standard solution. Chromatograms were recorded by injecting 10µl of each sample preparation. Peak areas were measured and keeping the value in the regression equation of corresponding calibration curve.
STRESS DEGRADATION STUDIES OF BULK DRUG
Stability studies were carried out to provide evidence on how the quality of drug changes under the influence of variety of environmental conditions like hydrolysis, oxidation, temperature etc.
Alkaline treatment
To 1 ml of stock solution of Timolol and Travoprost, 1 ml of 2 N sodium hydroxide was added and refluxed for 30mins at 600c. The resultant solution was diluted to obtain 50µg/ml & 40µg/ml solution and 10 µl were injected into the system and the chromatograms were recorded to assess the stability of sample [6].
Acid treatment
To 1 ml of stock ssolution Timolol and Travoprost, 1 ml of 2N Hydrochloric acid was added and refluxed for 30mins a t 600c.The resultant solution was diluted to obtain 50µg/ml & 40µg/ml solution and10µl solutions were injected into the system and the chromatograms were recorded to assess the stability of sample.
Oxidation
To 1 ml of stock solution of Timolol and Travoprost, 1 ml of 20% hydrogen peroxide (H2O2) was added separately. The solutions were kept for 30 min at 600c. For HPLC study, the resultant solution was diluted to obtain 50µg/ml & 40µg/ml solution and 10µl were injected into the system and the chromatograms were recorded to assess the stability of sample.
Degradation under dry heat
The standard drug solution w a s placed in oven at 1050c for 6h to study dry heat degradation. For HPLC study, the resultant solution was diluted to 50µg/ml & 40µg/ml solution and10µl were injected into the system and the chromatograms were recorded to assess the stability of the sample.
Photo-degradation
The photochemical stability of the drug was also studied by exposing the 100 µg/ml solution to UV Light by keeping the beaker in UV Chamber for 7days or 200 Watt hours/m2 in photo stability chamber. For HPLC study, the resultant solution was diluted to obtain 50µg/ml & 40µg/ml solutions and 10 µl were injected into the system and the chromatograms were recorded to assess the stability of sample.
RESULT AND DISCUSSION
Optimization of chromatographic conditions:
The main objective in developing this stability indicating HPLC method is to achieve the resolution between Travopost, Timolol and its degradation products. To achieve this we used a stationary phase as Intersil ODS column and mobile phase as acetonitrile and 0.02M potassium dihydrogen ortho phosphate (adjusted the pH to 3.10 with ortho phosphate acid) in the ratio of 10-90% v/v. The retention time was 2.516 and 6.918 min for Travopost and Timolol respectively (Fig. 3). Forced degradation study showed the method is highly specific and no degradation products were eluted at retention time of drugs.
Result of forced degradation studies
Degradation studies were observed for Travopost and Timolol samples during stress conditions like base, acid, oxidation and dry heat (Fig.4).
METHOD VALIDATION
The method was validated for accuracy, precision, linearity, LOD, LOQ and stability as per ICH guidelines.
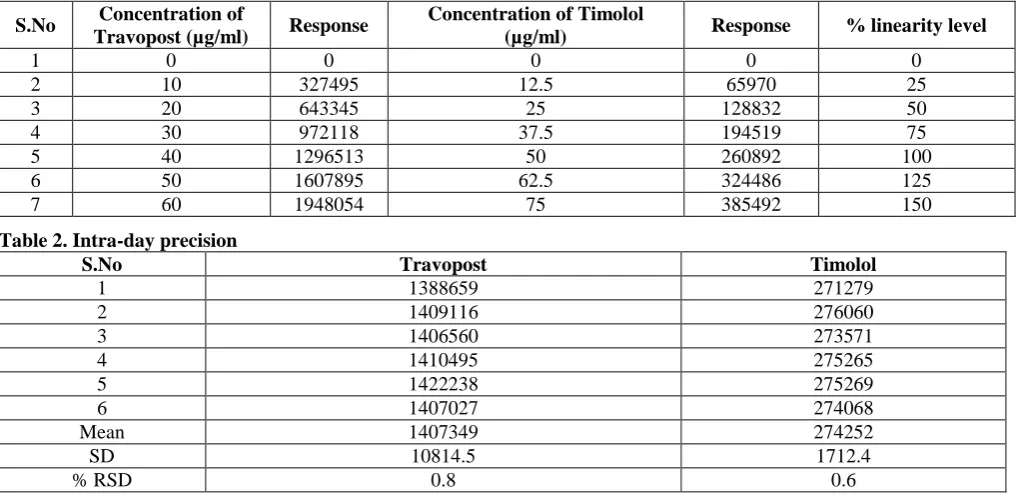
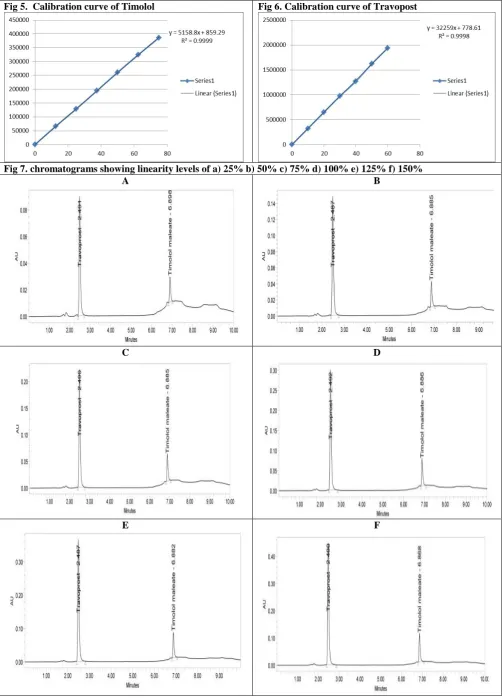
Linearity
The linearity of an analytical procedure with in a given range is its ability to obtain test results which are directly proportional to the concentration. The linearity was determined by taking six concentration levels ranging from 12.5-75µg/ml for Timolol and 10-60 µg/ml for Travopost as shown in the table 1. The calibration graph was obtained by plotting peak area versus the concentration and data was treated by least squares regression analysis. The equation of calibration curve was Y=5158.8x +859.29 for Timolol and Y=32350x+ 260.31 for Travopost respectively (Fig.5&6). The correlation coefficient of determination was 0.999 and 0.999 respectively.
Precision
178 studies and inter-day studies, 6 replicates of Travopost and
Timolol were analyzed in a day and on three consecutive days respectively and percentage RSD was calculated. For intra-day precision %RSD was found to be 0.8 for Travopost and 0.6 for Timolol. For inter-day precision %RSD was found to be 1.25 and 0.58 respectively (Table 2&3).
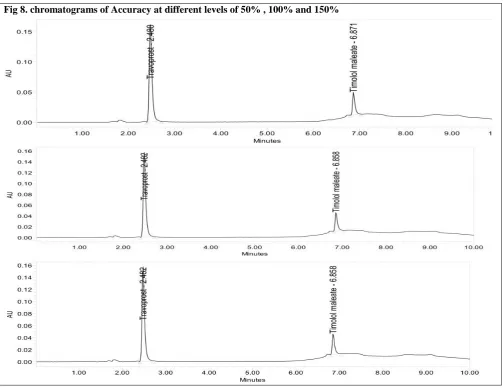
Accuracy
The accuracy of the method was determined by recovery studies. Recovery samples were prepared in triplicate and injected each sample in duplicate to the chromatography system. To carryout recovery studies,fixed amount of sample was taken and standard drug was added at 3 different levels(50,100,150%). The samples were injected into the chromatographic system and the results are shown in the table 3
Timolol maleate Accuracy Preparation 50% :( 75µg/ml) From the above Timolol maleate stock solution 1ml and 0.5ml was pipetted out as standard ppm and added ppm respectively into a 10 ml volumetric flask and then make up the volume with diluents. (Added25 µg/ml+ STD50µg/ml)
Timolol maleate Accuracy Preparation 100% :(100µg/ml):
From the above Timolol maleate stock solution 1ml and 1ml was pipetted out as standard ppm and added ppm respectively into a 10 ml volumetric flask and then make up the volume with diluents. (Added50 µg/ml+ STD50µg/ml)
Timolol maleate Accuracy Preparation 150% :( 125 µg/ml):
From the above Timolol maleate stock solution 1ml and 1.5ml was pipetted out as standard ppm and added ppm respectively into a 10 ml volumetric flask and then make up the volume with diluents. (Added75µg/ ml+ STD50µg/ml)
Travoprost Accuracy Preparation 50%: (60 µg/ml)
From the above Travoprost stock solution 1ml and 0.5ml was pipetted out as standard ppm and added ppm respectively into a 10 ml volumetric flask and then make up the volume with diluents. (Added20µg/ml+ STD40µg/ml)
Travoprost Accuracy Preparation 100%: (80µg/ml)
From the above Travopost stock solution 1ml and 1ml was pipetted out as standard ppm and added ppm respectively into a 10 ml volumetric flask and then make up the volume with diluents. (Added40µg/ml+ STD40µg/ml)
Travopost Accuracy Preparation 150% :( 100µg/ml)
From the above Travopost stock solution 1ml and 1.5ml was pipetted out as standard ppm and added ppm respectively into a 10 ml volumetric flask and then make up the volume with diluents. (Added60µg/ml+ STD40µg/ml).
Specificity
The specificity of the method was determined by peak purity profiling studies, indicating that no interference of other peak of degradation product and impurity.
Limit of detection (LOD) and limit of quantitation (LOQ)
LOD and LOQ were calculated as 3.3σ/S and 10 σ/S, respectively; where σ is the standard deviation of the response (y-intercept) and s is the slope of the calibration plot. The LOD of Travopost and Timolol were found to be 0.0270µg/ml and 0.125µg/ml respectively. The LOQ of Travopost and Timolol were found to be 0.082µg/ml and 0.379µg/ml respectively.
Table 1. linearity range of Travopost and Timolol
Table 2. Intra-day precision
S.No Travopost Timolol
1 1388659 271279
2 1409116 276060
3 1406560 273571
4 1410495 275265
5 1422238 275269
6 1407027 274068
Mean 1407349 274252
SD 10814.5 1712.4
% RSD 0.8 0.6
S.No Concentration of
Travopost (µg/ml) Response
Concentration of Timolol
(µg/ml) Response % linearity level
1 0 0 0 0 0
2 10 327495 12.5 65970 25
3 20 643345 25 128832 50
4 30 972118 37.5 194519 75
5 40 1296513 50 260892 100
6 50 1607895 62.5 324486 125
179 Table 3. Inter-day precision
Table 3. Recovery studies of Travopost and Timolol
Fig 1. Structure of Travopost Fig 2. Structure of Timolol
Fig 3. Typical chromatogram of Travopost and Timolol
S.NO Travopost Timolol
1 1269265 245999
2 1272002 245103
3 1303428 246940
4 1300968 248502
5 1290652 248002
6 1269474 248599
MEAN 1284298 247190
SD 16007.2 1428.4
% RSD 1.25 0.58
Sample Level of addition (%) Amount Added (µg/ml) Amount Recovered
(µg/ml) % Recovery
Timolol
50 25 24.985 99.94
100 50 50.093 100.186
150 75 75.026 100.034
Travopost
50 20 20.0123 100.0616
100 40 40.1026 100.256
180 Fig 4. Forced degradation studies of Travopost and Timolol
a) Acidtreated b) base treated c) oxidation d) dry heat e) photo degradation A
B
C
D
181 Fig 5. Calibration curve of Timolol Fig 6. Calibration curve of Travopost
Fig 7. chromatograms showing linearity levels of a) 25% b) 50% c) 75% d) 100% e) 125% f) 150%
A B
C D
182 Fig 8. chromatograms of Accuracy at different levels of 50% , 100% and 150%
CONCLUSION
The developed method is stability indicating and can be used for simultaneous estimation of Travopost and
Timolol in bulk and pharmaceutical dosage form. The developed method is specific, selective, accurate and precise.
REFERENCES
1. Skoog, Holler, Crouch. Liquid Chromatography. Instrumental analysis, Cengage learnin India. New Delhi, 2011, 893. 2. Sharma BK. High Performance Liquid Chromatography. Instrumental Methods of Chemical Analysis, 24th edition. 2005,
293 – 300
3. http://www.drugbank.ca/drugs/DB00352
4. ICH. International Conference on Harmonization of technical requirements for registration of pharmaceutical for human use, Q2 (R1), validation of analytical procedures, Methodology. London, 2005.
5. ICH. International Conference on Harmonization of technical requirements for registration of pharmaceutical for human use, Q1A (R2), stability testing of new drug substances and products. Geneva, 2003.