VOLUME 39, ARTICLE 11, PAGES 337
,
364
PUBLISHED 29 AUGUST 2018
https://www.demographic-research.org/Volumes/Vol39/11/ DOI: 10.4054/DemRes.2018.39.11
Research Article
Using census data to measure maternal
mortality: A review of recent experience
Kenneth Hill
Peter Johnson
Kavita Singh
Anthony Amuzu-Pharin
Yagya Kharki
© 2018 Kenneth Hill et al.
This open-access work is published under the terms of the Creative Commons Attribution 3.0 Germany (CC BY 3.0 DE), which permits use, reproduction, and distribution in any medium, provided the original author(s) and source are given credit.
1 Background 338
2 Data 341
3 Methods 343
3.1 Evaluating numbers of births 343
3.2 Evaluating numbers of adult female deaths 344
3.3 Evaluating the proportion pregnancy-related of adult female deaths 345
3.4 Data adjustment 345
4 Results 346
4.1 Data evaluation 346
4.2 Comparing adjusted estimates with those from other sources 352
5 Discussion 353
6 Conclusion 358
7 Funding statement 359
8 Acknowledgements 359
Using census data to measure maternal mortality:
A review of recent experience
Kenneth Hill1 Peter Johnson2
Kavita Singh3 Anthony Amuzu-Pharin4
Yagya Kharki5
Abstract
BACKGROUND
The Sustainable Development Goals adopted by the United Nations General Assembly in 2015 (United Nations 2015) set national targets for reducing maternal mortality, putting pressure on governments of countries lacking comprehensive statistical systems to find other ways to measure it. One approach tested since the 1990s has been to collect necessary data through national population censuses.
OBJECTIVE
This paper reviews maternal mortality data from the 2010 round of censuses for several countries to determine whether the census is useful for monitoring maternal mortality.
METHODS
Data on births, deaths, and pregnancy-related deaths from two censuses for 10 countries was evaluated using standard methods; adjustments were applied to the reported numbers if so indicated.
RESULTS
In general, the censuses underreported births moderately and underreported deaths by larger amounts; except in one case, proportions of pregnancy-related deaths appeared plausible. Adjusted estimates of the pregnancy-related mortality ratio (PRMR) were generally higher than estimates from Demographic and Health Survey sibling data or estimates of maternal mortality developed by cross-national studies.
1 Independent researcher, USA. Email:[email protected]. 2 Bureau of the Census, Suitland, USA.
3 University of North Carolina at Chapel Hill, USA. 4 Ghana Statistical Service, Accra, Ghana.
CONCLUSIONS
Analysis of recent data confirms results of earlier assessments: Census data provides imperfect but still valuable information on maternal mortality. Data requires careful assessment and often adjustment, resulting in estimates with large uncertainty.
CONTRIBUTION
This paper provides additional evidence as to whether maternal mortality can usefully be measured by population censuses in countries lacking civil registration data.
1. Background
The first target of Goal Three of the Sustainable Development Goals adopted by the United Nations General Assembly in 2015 (United Nations 2015) is to reduce the global maternal mortality ratio (MMR) to less than 70 maternal deaths per 100,000 live births by the year 2030. This new target continued a long history of international agreements to improve global maternal health, from the 1987 Safe Motherhood Conference to the United Nations Millennium Development Goals (MDG) in 2000. Each agreement sets targets in terms of a specified reduction in the MMR, putting pressure on governments of countries lacking comprehensive civil registration and vital statistics (CRVS) systems to put alternative systems in place to measure maternal mortality; see Hill (2013) for an overview of data needs for measuring maternal mortality. However, in 2015, 12 countries included in a global analysis by UN agencies did not have nationally representative data (WHO 2015).
A maternal death is defined by the International Classification of Diseases Tenth Revision (ICD-10; WHO 1993) as “the death of a woman while pregnant or within 42 days of termination of pregnancy, irrespective of the duration or site of the pregnancy, from any cause related to or aggravated by the pregnancy or its management but not from accidental or incidental causes.” The MMR for a period is defined as maternal deaths in that period divided by births in that period, conventionally multiplied by a scaling factor of 100,000. A parallel concept is a pregnancy-related death, defined as any death of a woman while pregnant or within 42 days of termination of pregnancy, regardless of cause; maternal deaths are thus a subset of pregnancy-related deaths. A parallel measure is the pregnancy-related mortality ratio (PRMR), which looks at pregnancy-related deaths per 100,000 live births.
maternal mortality is a fully functional CRVS system with accurate attribution of cause of death. However, many low- and middle-income countries lack such systems, so other sources of data have had to be used. The most widely available additional data source is the sibling histories collected by the Demographic and Health Surveys and Multiple Indicator Cluster Surveys programs (Rutenberg and Sullivan 1991). Sibling histories ask respondents about all their brothers and sisters. For siblings that are still alive the only information collected is current age; for siblings that have died, information is recorded on how many years’ ago the sibling died and at what age; for deaths of females at ages 13 to 49, three further questions are asked concerning the timing of death relative to pregnancy or childbirth. These questions identify pregnancy-related deaths rather than maternal mortality itself. The focus on pregnancy-related rather than maternal deaths simplifies data collection, since all that is required is information on the timing of death relative to pregnancy rather than an often problematic attribution of cause of death.
Sibling histories thus estimate PRMRs (although this is not generally made clear in published reports). Estimates based on sibling histories also have large sampling errors: Samples are small, and the events of interest are rare, with the result that potential sampling errors are large. Kish (2003) suggests a minimum acceptable precision for the coefficient of variation (standard error relative to the mean) of 10%; very few surveys provide a national estimate of PRMR for the seven year period before the survey with a coefficient of variation below that threshold. Estimates may also be affected by systematic errors (Ahmed et al. 2014; Masquelier 2013; Hill 2013).
histories, the measures generated are of pregnancy-related mortality, so the only data necessary is numbers of pregnancy-related deaths and of births.
The census was seen as having several advantages as a vehicle for collecting data on pregnancy-related mortality relative to sibling histories: Its size would reduce random errors and permit subnational analyses; its marginal cost would be small if the census was being taken anyway; the information on household deaths would additionally permit monitoring of mortality at all ages; and by collecting information about household deaths, it would be possible to follow up the census with a verbal autopsy (WHO 2007) applied to households with identified deaths to refine the estimation of maternal, as opposed to pregnancy-related, mortality, an approach implemented in the 2007 census of Mozambique (Mozambique National Institute of Statistics 2012).
In response to the increased need for maternal mortality data after the Millennium Summit in 2000, the Second Revision of the United Nations Principles and Recommendations for Population and Housing Censuses (PRPHC) included questions on household deaths in the 12 months before the census (or other clearly defined recent reference period) as a core topic and went on to note (paragraph 2.196) that countries “may wish” to add two additional questions about cause of death: whether the death was due to accident, violence, homicide, or suicide; and, if the deceased was a woman aged 15 to 49, whether the woman was pregnant, in childbirth, or within six weeks of the end of pregnancy when she died (United Nations 2007). In practice, the information on the timing of death relative to childbirth is sometimes collected by one single question and other times by three separate questions (while pregnant, during childbirth, or postpartum). The PRPHC adds (paragraph 2.197) that the information must be “interpreted with caution after careful evaluation and often adjustment.”
The inclusion of the language in paragraph 2.196 in the revised PRPHC led to increased use of the questions in the 2010 round of censuses. A workshop in Addis Ababa in 2014 reviewed the experience of six African countries, and a Bangkok workshop in 2015 reviewed the experience of seven Asian countries. The purpose of this paper is to present a systematic assessment of data collected in the 2010 census round based on the countries represented at the two workshops. It adds recent experience to a substantial literature evaluating the performance of census-based questions on pregnancy-related mortality (Hill et al. 2007; Hill et al. 2009; Hakkert 2011; Hill and Stanton 2011; Dorrington and Bradshaw 2011).
The ultimate objective of the review is to inform the design and implementation of censuses for the 2020 round. The paper does not aim to produce new estimates of maternal mortality for the countries included, though as part of the evaluation exercise we compare census-based estimates to those derived from other sources, especially sisterhood questions, and those developed by the MMEIG and Global Burden of Disease exercises.
As a result of problems with data access or permissions, it has only been possible to use data in this review from 8 (Cambodia, Ethiopia, Ghana, Liberia, Malawi, Nepal, Vietnam, and Zambia) of the 13 countries that participated in the workshops. In order to expand the number of countries included, we have added data for two additional countries (Burkina Faso and Mozambique) for which appropriate data is available from the Integrated Public Use Microdata Series (Minnesota Population Center 2015).
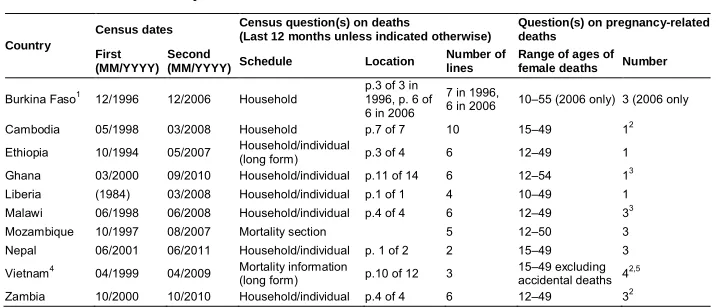
2. Data
Table 1: Summary information about census data used Country
Census dates Census question(s) on deaths
(Last 12 months unless indicated otherwise)
Question(s) on pregnancy-related deaths
First (MM/YYYY)
Second
(MM/YYYY) Schedule Location
Number of lines
Range of ages of female deaths Number
Burkina Faso1 12/1996 12/2006 Household
p.3 of 3 in 1996, p. 6 of 6 in 2006
7 in 1996,
6 in 2006 10–55 (2006 only) 3 (2006 only Cambodia 05/1998 03/2008 Household p.7 of 7 10 15–49 12 Ethiopia 10/1994 05/2007 Household/individual
(long form) p.3 of 4 6 12–49 1 Ghana 03/2000 09/2010 Household/individual p.11 of 14 6 12–54 13 Liberia (1984) 03/2008 Household/individual p.1 of 1 4 10–49 1 Malawi 06/1998 06/2008 Household/individual p.4 of 4 6 12–49 33 Mozambique 10/1997 08/2007 Mortality section 5 12–50 3 Nepal 06/2001 06/2011 Household/individual p. 1 of 2 2 15–49 3 Vietnam4 04/1999 04/2009 Mortality information
(long form) p.10 of 12 3 15–49 excludingaccidental deaths 42,5 Zambia 10/2000 10/2010 Household/individual p.4 of 4 6 12–49 32
Note:1Burkina Faso is the only country with both censuses collecting information on household deaths.2Preceded by cause of death question.3Preceded by question(s) as to whether death was due to injury.4Deaths since previous Lunar New Year (approx.. 14 months).5Questions on timing of death relative to pregnancy skipped if due to accident; included explicit category for “after miscarriage/abortion,” in addition to “during pregnancy.”
The PRPHC emphasize that census data on pregnancy-related deaths needs careful evaluation, possibly with adjustment; such evaluation by standard methods and the calculation of an adjusted PRMR require the collection and compilation of the following pieces of information in addition to deaths by age and sex and whether the deaths were pregnancy-related:
1) Age and sex distribution of the population
2) Births by age of mother for the same clearly defined period before the census 3) Numbers of children ever born to women by age group at the time of the census
A first and critical step in census data processing is editing, whereby invalid or inconsistent data is replaced with plausible values and nonresponses by imputed values. The goal of editing is to ensure an internally consistent data set. Achieving the goal involves assembling a strong editing team comprised of census managers, subject matter specialists, and data processors and following editing best practices, including documentation and archiving of both the unedited and edited data files (UN Department of Economic and Social Affairs 2010; UN Economic Commission for Africa 2015).
data: for Liberia, the intercensal interval is 24 years (1984 to 2008), during which interval there was a brutal civil war, and as a result we treat Liberia as if it only had one census, that of 2008; for Nepal, the 2001 census was conducted during a widespread insurgency, and only partial enumeration was possible in 12 out of 75 districts.
The data used in this analysis was either brought to one or other workshop by representatives of the relevant country’s national statistical office or were downloaded from the IPUMS web site (Minnesota Population Center 2015).
3. Methods
At its most basic, the methodology needed to estimate the PRMR is simple division of the number of pregnancy-related deaths in a period by the number of births in the same period. In practice, in the spirit of the PRPHC paragraph 2.197, the methodology also involves “careful evaluation and often adjustment” of these two numbers. The standard approach to the evaluation of pregnancy-related deaths involves two steps: evaluate (and adjust if necessary) the overall number of female deaths between the ages of 15 (or 10) and 49 and then evaluate the proportion of such deaths reported as pregnancy-related. It is then necessary to evaluate, and adjust if necessary, the reported number of births. The methods are described in detail elsewhere (WHO 2013; Moultrie et al. 2013), but they will be outlined here with details of how they have been applied.
3.1 Evaluating numbers of births
The P/F Ratio approach to evaluating completeness of birth reporting, first proposed by Brass (1975), compares cumulated age-specific fertility rates (ASFRs) to lifetime fertility in the form of average numbers of children ever born (CEB) by age of woman; if reporting is good, and fertility is not changing, the two sets of numbers should be similar. Once again, the details of application depend on data availability (Moultrie et al. 2013); using information from two censuses greatly reduces the sensitivity of the approach to fertility change.
3.2 Evaluating numbers of adult female deaths
The methods used to evaluate numbers of adult deaths, collectively described as death distribution methods (DDMs), depend on necessary relationships between population numbers, death numbers, and growth rates. How these methods are applied depends on data availability (Moultrie et al. 2013, where spreadsheets for application can be found). There is also an R package to apply the methods ( https://cran.r-project.org/package-DDM). In summary, the theory underlying the methods is as follows.
In any population or population age segment that is not significantly affected by migration, the population entry rate minus the population loss (death) rate is equal to the population growth rate. Thus, for example, the rate of entry into the population aged 30 and over (birthdays at age 30 divided by the population aged 30 and over) minus the death rate 30 and over must be equal to the growth rate 30 and over. Differences between entry rates and growth rates, age by age, can be thought of as residual estimates of the death rates over each age; they can then be compared to observed death rates and any systematic differences interpreted as data errors, particularly differences in reporting of deaths relative to reporting of population. These relationships underlie the Brass Growth Balance (BGB) single census method (Brass 1975) and the General Growth Balance (GGB) two census method (Hill 1987). The GGB methodology also provides an estimate of the relative completeness of coverage of two successive censuses.
A second relationship is that the population of a given age today must be equal to all the deaths that will occur to that population in the future; current deaths above that age can be adjusted using age-specific population growth rates to approximate all future deaths. This relationship underlies the Synthetic Extinct Generations (SEG) two census method (Bennett and Horiuchi 1981, 1984). The SEG method primarily estimates completeness of death recording relative to census coverage but can be adapted to allow for differential census coverage.
An evaluation of the performance of these two methods under conditions of simulated data errors suggested that a combination of the two worked better than either method alone (Hill, You, and Choi 2009). The GGB method is applied first to obtain an estimate of differential census coverage; the census counts are then adjusted to correct age-specific growth rates, and the SEG method is applied to the adjusted data.
the information on deaths by age is available only from the second of the two censuses, so intercensal deaths are estimated by applying reported age-specific mortality rates from the second census to an estimated intercensal population. For Burkina Faso, information on deaths by age is available from both the first and the second census, so age-specific mortality rates were calculated for both censuses, averaged, and then applied to an estimated intercensal population. In each case except Liberia, three evaluation methods were applied: the original GGB method, the original SEG method, and the combined GGB-SEG method, applying the SEG method after adjusting population counts for any census coverage change estimated by the GGB method.
3.3 Evaluating the proportion pregnancy-related of adult female deaths
No formal method exists for evaluating a reported proportion of deaths of women of reproductive age that are pregnancy-related. Reported proportions vary widely from population to population and are strongly positively related to the level of maternal mortality. The best option currently available for evaluation is a simple plausibility check: Since pregnancy is the risky event giving rise to pregnancy-related deaths, the age pattern of pregnancy-related deaths should resemble the age pattern of births, with perhaps some flattening of the pattern of pregnancy-related deaths reflecting higher risks at younger and older maternal ages (Blanc et al. 2013).
3.4 Data adjustment
Once the formal methods of evaluating completeness have concluded, the question arises of whether to adjust or not. The answer to this question is really a matter of judgment. If the evaluations indicate that errors are small, for example less than ±10%, the decision would normally be not to adjust, since the potential errors in the methods are likely to be at least that large. At the other end of the scale, if the estimated errors are very large, for example, coverage of less than the Preston (Preston 1984) ‘rule’ of 60%, the assumptions of the methods are probably violated, and the data should probably be abandoned (although the adjustments are at least likely to be in the right direction).
With one or two specified exceptions, the results presented in this paper are derived from the use of the workbook.
4. Results
Our primary interest in this paper is not to produce estimates of PRMRs but rather to examine the quality of the census data collected and, to the extent possible, the performance of the evaluation methods used to assess that quality. This section is divided into two parts, the first reviewing results of data evaluation and the second comparing adjusted estimates with those available from other primary sources, principally sibling histories from Demographic and Health Surveys.
4.1 Data evaluation
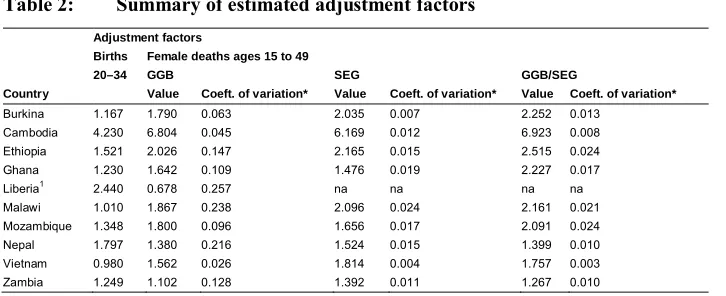
Table 2 summarizes the results of the data evaluation techniques applied to births and adult female deaths by country. The results are expressed in terms of the estimated adjustment factors that need to be applied to the reported numbers; thus a value of 1.23 indicates an upward adjustment of reported numbers of 23%, equivalent to an underreporting of events of 19%.
Table 2: Summary of estimated adjustment factors Adjustment factors
Births Female deaths ages 15 to 49
20–34 GGB SEG GGB/SEG
Country Value Coeft. of variation* Value Coeft. of variation* Value Coeft. of variation* Burkina 1.167 1.790 0.063 2.035 0.007 2.252 0.013
Cambodia 4.230 6.804 0.045 6.169 0.012 6.923 0.008 Ethiopia 1.521 2.026 0.147 2.165 0.015 2.515 0.024 Ghana 1.230 1.642 0.109 1.476 0.019 2.227 0.017
Liberia1 2.440 0.678 0.257 na na na na
Malawi 1.010 1.867 0.238 2.096 0.024 2.161 0.021 Mozambique 1.348 1.800 0.096 1.656 0.017 2.091 0.024 Nepal 1.797 1.380 0.216 1.524 0.015 1.399 0.010 Vietnam 0.980 1.562 0.026 1.814 0.004 1.757 0.003 Zambia 1.249 1.102 0.128 1.392 0.011 1.267 0.010
Note: *Of adjustment factors using range of age trims (see text).1 2008 census only.
range from a low of 0.98 (Vietnam) to a high of 4.23 (Cambodia); the second highest is for Liberia with 2.44. The rule of excluding cases where coverage is estimated at less than 60% would suggest excluding both Cambodia and Liberia from further analysis; however, since the objective of this paper is methodological rather than substantive, we include both for further discussion.
Turning to adult female deaths, the estimates in Table 2 are based on applying the DDM methods to all open-ended age groups from 5+ to 70+. An evaluation of the methods by Murray et al. (2010) indicated that method performance varies by the range of age groups (‘trims’) used and that a narrower age range, from around 50+ to 70+ or higher, is generally optimal. However, the advantage of using a smaller number of points for older ages arises largely from limiting the adverse effects on method performance of migration. Since we are applying the methods to national populations, for which net migration rates are typically trivial, we have chosen to use the full range of available points for all applications. We have preferred to use one single age range throughout, since choosing different trims for different applications would add an undesirably arbitrary element to the results.
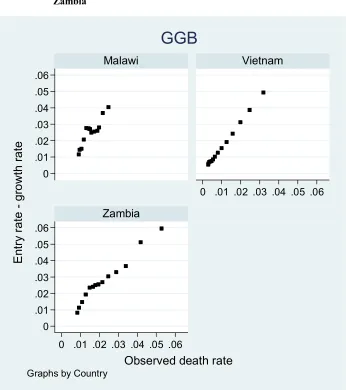
Figure 1: Performance of death distribution methods: Malawi, Vietnam, and Zambia
0 .01 .02 .03 .04 .05 .06
0 .01 .02 .03 .04 .05 .06
0 .01 .02 .03 .04 .05 .06
0 .01 .02 .03 .04 .05 .06
Malawi Vietnam
Zambia
E
nt
ry
ra
te
-g
ro
w
th
ra
te
Observed death rate
Graphs by Country
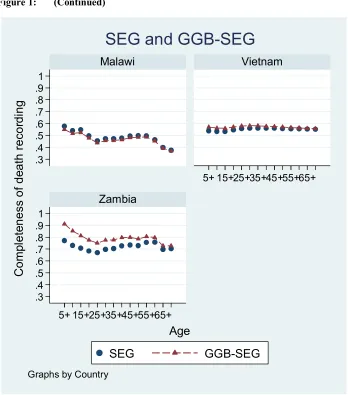
Figure 1: (Continued)
The GGB method uses orthogonal regression to fit a straight line to residual versus observed death rates over each age, whereas the SEG and GGB-SEG methods compare an observed population of a given age to deaths over that age adjusted by age-specific growth rates. The estimates we use are based upon all points for ages 5+ to 70+, slope in the case of GGB and average in the case of SEG. There is no established way of
.3 .4 .5 .6 .7 .8 .91
.3 .4 .5 .6 .7 .8 .9 1
5+ 15+25+35+45+55+65+
5+ 15+25+35+45+55+65+
Malawi Vietnam
Zambia
SEG
GGB-SEG
C
o
m
pl
e
te
n
e
ss
o
f
d
ea
th
re
co
rd
in
g
Age
Graphs by Country
assessing uncertainty of the results of either approach, but a major component of estimation uncertainty arises from the age ranges used for fitting or averaging. As a broad indicator of uncertainty (Table 2), we have calculated adjustment factors based on a total of 16 different age ranges (5+ to 70+ down to 20+ to 55+) and calculated the coefficient of variation across the different estimates. It should be noted that this uncertainty measure is not comparable across DDM methods, but within methods it is comparable across countries.
The estimated mortality adjustments tend to be between 1.0 and 2.0 (15 of 28). There is only one adjustment factor less than 1.0 (BGB for Liberia), though there are several larger than 2.0 (12 in total, though 3 of those are for Cambodia, all over 6.0). There is a systematic pattern by method: GGB results in six of the lowest adjustment factors, and the combined method results in six of the highest. We have no explanation of this pattern. The case of Cambodia is of interest: The adjustment factors are all over 6.0, but the indicators of uncertainty are all among the lowest. Given that Cambodia also had a very high adjustment for births, over 4.0, the suspicion is strong that the data used came from a subsample of the 2008 census; the census report gives no indication of this, however, and reports fertility estimates not very different from those we arrive at after adjustment. We conclude from this that the data is usable even though the adjustment factors are very high.
The three evaluation methods applied give three different adjustment factors (except in the case of Liberia, where only the BGB was used) and the differences are not small, ranging from the highest being only 12% more than the lowest (Cambodia) to being 51% more than the lowest (Ghana). These differences raise concerns about the usefulness of the methods and a difficult question about what to use as an adjustment factor; for want of a better solution, we use the average of the three estimates, as suggested by Murray et al. (2010). Clearly the uncertainty in the adjustment is large, but there is no plausible case for not adjusting at all.
deaths that were pregnancy-related. Figure 2 illustrates three different patterns using data from Mozambique, Malawi, and Liberia.
Figure 2: Proportionate distributions of live births and maternal deaths by age of woman: Liberia, Malawi, and Mozambique
0 .05 .1 .15.2 .25 .3 .35
0 .05 .1 .15.2 .25 .3 .35
15-19
20-2425-2930-3435-3940-4445-49
15-19
20-2425-2930-3435-3940-4445-49
Liberia Malawi
Mozambique
Births
Pregnancy-related deaths
P
ro
p
or
tio
n
o
f
to
ta
l
Age group
4.2 Comparing adjusted estimates with those from other sources
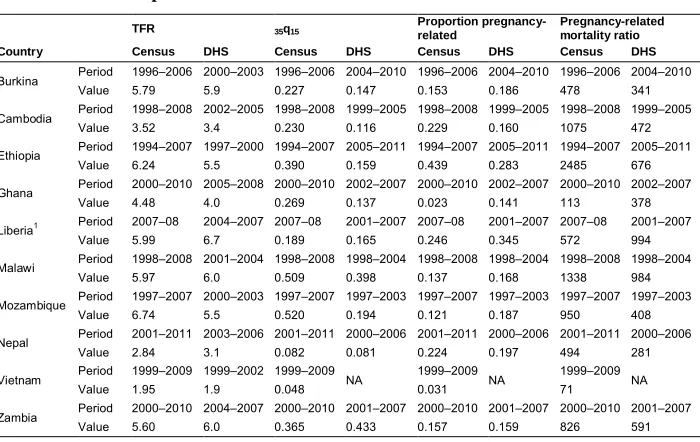
Table 3 compares four indicators (total fertility; the probability of dying between age 15 and age 50 (35q15); the proportion of female deaths between ages 15 and 49
pregnancy-related; and the PRMR) from the census data with estimates of the same indicator from the Demographic and Health Survey of the country that most closely approximates the period covered by each census estimate. The census data has been adjusted as indicated in the previous subsection for all indicators except the proportion of pregnancy-related deaths.
Table 3: Comparisons with DHS Data TFR 35q15
Proportion pregnancy-related
Pregnancy-related mortality ratio Country Census DHS Census DHS Census DHS Census DHS
Burkina Period 1996–2006 2000–2003 1996–2006 2004–2010 1996–2006 2004–2010 1996–2006 2004–2010 Value 5.79 5.9 0.227 0.147 0.153 0.186 478 341
Cambodia Period 1998–2008 2002–2005 1998–2008 1999–2005 1998–2008 1999–2005 1998–2008 1999–2005 Value 3.52 3.4 0.230 0.116 0.229 0.160 1075 472
Ethiopia Period 1994–2007 1997–2000 1994–2007 2005–2011 1994–2007 2005–2011 1994–2007 2005–2011 Value 6.24 5.5 0.390 0.159 0.439 0.283 2485 676
Ghana Period 2000–2010 2005–2008 2000–2010 2002–2007 2000–2010 2002–2007 2000–2010 2002–2007 Value 4.48 4.0 0.269 0.137 0.023 0.141 113 378
Liberia1 Period 2007–08 2004–2007 2007–08 2001–2007 2007–08 2001–2007 2007–08 2001–2007 Value 5.99 6.7 0.189 0.165 0.246 0.345 572 994
Malawi Period 1998–2008 2001–2004 1998–2008 1998–2004 1998–2008 1998–2004 1998–2008 1998–2004 Value 5.97 6.0 0.509 0.398 0.137 0.168 1338 984
Mozambique Period 1997–2007 2000–2003 1997–2007 1997–2003 1997–2007 1997–2003 1997–2007 1997–2003 Value 6.74 5.5 0.520 0.194 0.121 0.187 950 408
Nepal Period 2001–2011 2003–2006 2001–2011 2000–2006 2001–2011 2000–2006 2001–2011 2000–2006 Value 2.84 3.1 0.082 0.081 0.224 0.197 494 281
Vietnam Period 1999–2009 1999–2002 1999–2009 NA 1999–2009 NA 1999–2009 NA
Value 1.95 1.9 0.048 0.031 71
Zambia Period 2000–2010 2004–2007 2000–2010 2001–2007 2000–2010 2001–2007 2000–2010 2001–2007 Value 5.60 6.0 0.365 0.433 0.157 0.159 826 591
Note:12008 census only.
The estimates of total fertility agree fairly closely for 6 of the 10 countries, but for four countries (Ethiopia, Ghana, Liberia, and Mozambique) the census estimate differs from the comparable DHS estimate by more than 10%. In three of these cases, the census estimate is higher and in one lower. The largest difference is for Mozambique, the census estimate being 23% higher than the corresponding DHS estimate.
two cases (Ethiopia and Mozambique) it is more than double the DHS value. Agreement is very close for one country (Nepal), and the census estimate is about 15% lower than the DHS estimate for two countries (Liberia and Zambia). Estimates of proportions of pregnancy-related deaths also vary dramatically though not systematically: The census estimates range from 55% higher (Ethiopia) to more than 80% lower (Ghana) than the DHS value.
Given the wide differences in female adult mortality and proportions of pregnancy-related deaths, it is hardly surprising that the census and DHS estimates of the PRMR diverge widely. With the exceptions of Ghana (70% lower) and Liberia (40% lower), the census estimates are all higher than the DHS estimates by amounts ranging from 36% (Malawi) to 268% (Ethiopia). Ghana is an exception because of an implausibly low proportion in the census of pregnancy-related deaths, while Liberia is an unsatisfactory application of the methodology, since only data from the second census is used.
There is one additional source of information about pregnancy-related mortality relevant to the assessment of census data. The Mozambique 2007 census was followed by a postcensus survey, whereby a sample of deaths reported in the census was followed up by household visits for a verbal autopsy (Mozambique National Institute of Statistics 2012). Of 18,105 deaths in the original sample, over one-third (6,353) were determined to be out of scope mainly because they were determined to have occurred outside the 12 month reference period. The remaining in-scope deaths do not provide a suitable basis for estimating mortality rates because the procedure used provides no way of adjusting for deaths that were not originally reported to the census but should have been; false positives are identified but not false negatives (Hakkert 2011). That said, it may be that the remaining sample was not biased by cause. Maternal deaths as identified by the verbal autopsy were 14% of deaths of women of reproductive age, and maternal deaths were 96% of pregnancy-related deaths. The proportion of deaths of women of reproductive age that were pregnancy-related was thus about 15%, somewhat higher than the value calculated from the overall census data. It is worth noting the close similarity in the Mozambique case between the number of maternal deaths and the number of pregnancy-related deaths, suggesting that pregnancy-related deaths can be a reasonably good proxy for maternal deaths in contexts where maternal mortality is high.
5. Discussion
recently in MICS surveys, gives estimates with large potential sampling errors and the possibility of systematic errors as well; it does not lend itself to disaggregation, whether by geography or socioeconomic condition. An alternative, cautiously promoted by the second revision of the PRPHC, is to include questions in censuses on household deaths and – for female deaths of reproductive age – follow-up questions about the timing of death relative to pregnancy. This approach offers the possibility of much larger samples, and of disaggregation, but data quality remains an issue. In this paper we update earlier evaluations (Stanton et al. 2001; Hill et al. 2007, 2009; Hill and Stanton 2011), incorporating data from the 2010 round of censuses to evaluate data quality across a number of recent census data sets.
The evaluation methods applied to the census data make a number of assumptions that may affect the results. The P/F Ratio method applied to a single data set is very sensitive to fertility change, but in only one application, Liberia, is the single data set method used; in all others, data from two successive censuses is used. The method – whether applied to a single census or to a pair of censuses – in principle also assumes zero migration, but in practice the results are little affected by levels of migration likely to be observed at the national level.
It is not possible to put formal confidence intervals on the fertility or mortality estimates derived from the censuses considered in this paper. It is however clear that there is a great deal of uncertainty. With the GGB mortality estimates, for example, the coefficient of variation from using different age ranges for fitting varies from 2.6% (Vietnam) to 25.7% (Liberia); the SEG or combined method variability is much lower, but this is misleading since there is added uncertainty with these two methods about the treatment of the ‘open’ age interval. There is additional uncertainty in the fertility adjustments and in the proportions of adult female deaths that are pregnancy related.
What conclusions can we draw from these applications? First, the most robust evaluation methodology that we use is of fertility, and reported fertility almost always needs to be adjusted upward from reported levels. Comparisons of adjusted total fertility rates with empirical estimates for broadly comparable time periods from DHS suggest no net bias: For five applications, the estimates are very similar, for three the census estimates are higher, and for two the census estimates are lower.
Second, even though there is substantial uncertainty in the adjustment factors produced, the results of the evaluations of adult female mortality indicate the need for upward adjustment in all cases except one, the exception being the unsatisfactory application to Liberia. Hill, You, and Choi (2009) show that the largest distortions of estimates of adjustment factors arise from net migration and from age-specific patterns of underreporting of age at death. United Nations estimates of net migration for the period 2000–2010 (UN Department of Economic and Social Affairs 2017) for seven of the countries included in this study indicate rates per 1,000 below 2 per 1,000, unlikely to have a major impact on coverage estimates; only Cambodia (–2.4), Nepal (–7.1), and Liberia (+3.2) have rates higher than that. Unfortunately, we have little information about even the direction of age-specific patterns of misreporting of deaths beyond the South Africa case (Dorrington and Bradshaw 2011), which is unlikely to be typical. Comparisons of an overall indicator of adult female mortality, 35q15, between the
adjusted census values (averaging adjustment factors across the three approaches) and the only other source of empirical information, DHS sisterhood reports, show the adjusted census estimates to be substantially higher in all but two cases. The adjustment methods have large uncertainty, but since migration bias is likely to be downward in most of these applications, this systematic pattern raises the possibility that the DHS sisterhood method underestimates adult mortality substantially.
2.3%, has a lower proportion even than low-fertility low-mortality Vietnam; a 2007 DHS in Ghana found a proportion of nearly 16% (Ghana Statistical Service et al. 2009). The Ghana census questionnaire offers no obvious reason for why the PPRD should be so low: The question on timing of death was preceded by a question on whether the death was due to an accident or violence, but that was also the case for Malawi; the question was integrated appropriately with the other questions on deaths in the household. Dorrington and Bradshaw (2011) conclude in their analysis of South African census data that the proportion of adult female deaths reported as pregnancy-related was overreported; our analysis does not suggest that this is the norm, unless the same is true of DHS sibling data.
Reviewing more generally the evaluation results in the context of questionnaire design, it is hard to see any general patterns. In almost all the censuses, the questions on recent household deaths were close to the end of quite long questionnaires (see Table 1 for a summary and web appendix for facsimiles), so it could be that interviewer fatigue played a role in the underrecording of recent deaths. However, in Nepal the question was upfront, and yet coverage is estimated to have been about average. In most cases, the census questionnaire allowed for five or six deaths in a household; without household-level data, it is impossible to know whether the number of lines curtailed the number of deaths reported, but it seems very unlikely that many households experienced more deaths than that in a year. Nepal, however, had lines for only two deaths per household, with no instruction on the questionnaire about what to do if more were recorded, so the design of the questionnaire may have reduced data quality.
cases be even larger. It must be remembered of course in these comparisons that the census estimates are of pregnancy-related mortality, which in low-mortality countries (here represented by Vietnam) may substantially exceed maternal mortality.
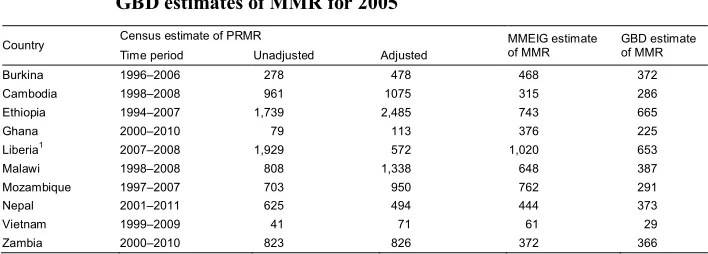
Table 4: Comparison of census-based estimates of PRMR with MMEIG and GBD estimates of MMR for 2005
Country Census estimate of PRMR MMEIG estimateof MMR GBD estimateof MMR Time period Unadjusted Adjusted
Burkina 1996–2006 278 478 468 372
Cambodia 1998–2008 961 1075 315 286
Ethiopia 1994–2007 1,739 2,485 743 665
Ghana 2000–2010 79 113 376 225
Liberia1 2007–2008 1,929 572 1,020 653
Malawi 1998–2008 808 1,338 648 387
Mozambique 1997–2007 703 950 762 291
Nepal 2001–2011 625 494 444 373
Vietnam 1999–2009 41 71 61 29
Zambia 2000–2010 823 826 372 366
Note:12008 census only.
6. Conclusion
As stated in the introduction, the purpose of this paper is not to add more estimates of maternal mortality to existing databases but rather to evaluate the usefulness of census data in the measurement of maternal mortality. The review has focused on the plausibility of the basic data collected by recent censuses as they relate to maternal mortality and on the performance of the adjustment techniques applied to census data on fertility and adult mortality. It updates previous evaluations incorporating data from the 2010 round of censuses.
Our results basically reinforce the conclusions of the earlier evaluations; disappointingly there has been no clear improvement in data quality. We conclude that the census data on fertility generally somewhat underreport recent births but except in the cases of Cambodia and Liberia are not far wrong. For mortality, the data appears to underreport recent adult female deaths by a larger margin. Conclusions with respect to the proportion pregnancy-related of adult female deaths are weaker but suggest no clear bias.
With respect to assessment and adjustment methods, we conclude that the fertility adjustments usually work quite well and improve on the reported data. For mortality, the general direction of adjustment seems likely to be correct, but there is so much uncertainty around a precise adjustment factor that any final adjustment is little better than a guess; wider application to cases with data on deaths by age from both censuses may improve performance. For pregnancy-related proportions, the evaluation through age patterns of deaths is only qualitative; development of a quantitative approach potentially allowing for adjustment is desirable.
round of censuses may therefore be expected to improve the performance of the DDM evaluation methods. If questions on household deaths are being included, additional questions about the timing of death relative to pregnancy can be included with little additional workload relative to that of conducting a census; this study does not determine whether a one question or three question format is preferable, but the three question approach provides more information and potentially an additional basis for evaluation.
7. Funding statement
This study was carried out with support provided by the United States Agency for International Development (USAID) through MEASURE Evaluation (cooperative agreement AID-OAA-L-14-00004). The views expressed are those of the authors and do not necessarily reflect the views of the United States Agency for International Development (USAID) or the United States Government.
8. Acknowledgements
References
Ahmed, S., Li, Q., Scrafford, C., and Pullum, T.W. (2014). An assessment of DHS maternal mortality data and estimates. Rockville: ICF International (DHS Methodological Reports No. 13).
Banda, R., Fylkesnes, K., and Sandøy, I.F. (2015). Rural–urban differentials in pregnancy-related mortality in Zambia: Estimates using data collected in a census.Population Health Metrics 13(1): 32.doi:10.1186/s12963-015-0066-9. Banda, R., Sandøy, I.F., and Fylkesns, K. (2016). Lifetime risk of pregnancy-related
death among Zambian women: District-level estimates from the 2010 census.
Journal of Population Research 33(3): 263–281.
doi:10.1007/s12546-016-9172-1.
Bennett, N.G. and Horiuchi, S. (1981). Estimating the completeness of death registration in a closed population. Population Index 47(2): 207–221.
doi:10.2307/2736447.
Bennett, N.G. and Horiuchi, S. (1984). Mortality estimation from registered deaths in less developed countries.Demography21(2): 217–233.doi:10.2307/2061041. Blanc, A.K., Winfrey, W., and Ross, J. (2013). New findings for maternal mortality age
patterns: Aggregated results for 38 countries. PLoS ONE 8(4): e59864.
doi:10.1371/journal.pone.0059864.
Brass, W. (1975). Methods for estimating fertility and mortality from limited and defective data. Chapel Hill: International Program of Laboratories for Population Statistics.
Dorrington, R.E. and Bradshaw, D. (2011). Maternal mortality in South Africa: Lessons from a case study in the use of deaths reported by households in censuses and surveys.Journal of Population Research 28(1): 49–73.
doi:10.1007/s12546-011-9050-9.
Ghana Statistical Service (GSS), Ghana Health Service (GHS), and Macro International (2009).Ghana Maternal Health Survey 2007. Calverton: GSS, GHS, and Macro International.
Hakkert, R. (2011). Follow-up surveys for census estimates of maternal mortality: Experiences from Bolivia and Mozambique. Journal of Population Research
28(1): 15–30.doi:10.1007/s12546-011-9063-4.
Hill, K. (1987). Estimating census and death registration completeness. Asian and Pacific Census Forum1(3): 8–13, 23–24.
Hill, K. (2013). Estimation of pregnancy-related mortality from deaths reported by households. In: Moultrie, T.D., Dorrington, R., Hill, A., Hill, K., Timæus, I.M., and Zaba, B. (eds.). Tools for demographic estimation. Paris: International Union for the Scientific Study of Population.
Hill, K., Stanton, C., and Gupta, N. (2001). Measuring maternal mortality from a census: Guidelines for potential users. Chapel Hill: Carolina Population Center, University of North Carolina.
Hill, K., Queiroz, B., Stanton, C., and Abou-Zahr, C. (2007). Measuring maternal mortality via the population census: Experience from Africa. Paper presented at the 5th African Population Conference, Arusha, Tanzania, December 10–14,
2007.
Hill, K., Queiroz, B.L., Wong, L., Plata, J., Del Popolo, F., Rosalese, J., and Stanton, C. (2009). Estimating pregnancy-related mortality from census data: Experience in Latin America. Bulletin of the World Health Organization 87(4): 288–295.
doi:10.2471/BLT.08.052233.
Hill, K., You, D., and Choi, Y. (2009). Death distribution methods for estimating adult mortality: Sensitivity analysis with simulated data errors. Demographic Research 21(9): 235–254.doi:10.4054/DemRes.2009.21.9.
Hill, K. and Stanton, C. (2011). Measuring maternal mortality through the census: Rapier or bludgeon?Journal of Population Research 28(1): 31–47.doi:10.1007/
s12546-011-9058-1.
Maternal Mortality Inter-Agency Group (MMIEG) Census Technical Working Group (2015). Census pregnancy-related mortality workbook: Version 2.0R [electronic resource].
Kish, L. (2003). Methods for design effects. In: Kalton, G. and Heeringa, S. (eds.).
Leslie Kish: Selected papers. Hoboken: Wiley: 155–178.
Minnesota Population Center (2015). Integrated public use microdata series, international: Version 6.4 [machine-readable database]. Minneapolis: University of Minnesota.
Moultrie, T.A., Dorrington, R.E., Hill, A.G., Hill, K., Timæus, I.M., and Zaba, B. (2013). Tools for demographic estimation. Paris: International Union for the Scientific Study of Population.
Mozambique National Institute of Statistics, US Census Bureau, MEASURE Evaluation, and US Centers for Disease Control and Prevention (2012).
Mortality in Mozambique: Results from a 2006–2007 post-census mortality survey.Chapel Hill: Measure Evaluation.
Murray, C.J.L., Rajaratnam, J.K., Marcus, J., Lasko, T., and Lopez, A.D. (2010). What can we conclude from death registration? Improved methods for evaluating completeness.PLoS Med 7(4): e1000262.doi:10.1371/journal.pmed.1000262. Preston, S.H. (1984). Use of direct and indirect techniques for estimating the
completeness of death registration systems. In: Data bases for mortality measurement. New York: United Nations.
Queiroz, B.L. (2011). Estimating maternal mortality differentials using census data: Experience in Honduras. Journal of Population Research 28(1): 75–87.
doi:10.1007/s12546-011-9044-7.
Rutenberg, N. and Sullivan, J.M. (1991). Direct and indirect estimates of maternal mortality from the sisterhood method. Washington, D.C.: IRD/Macro International.
Stanton, C., Hobcraft, J., Hill, K., Kodjogbe, N., Mapeta, W.T., Munene, F., Naghavi, M., Rabeza, V., Sisouphanthong, B., and Campbell, O. (2001). Every death counts: Measurement of maternal mortality via a census. Bulletin of the World Health Organization79(7): 657–664.
United Nations (2007). Principles and recommendations for population and housing censuses. New York: United Nations, Statistics Division, Department of Economic and Social Affairs.
United Nations Department of Economic and Social Affairs, Population Division (2017).World population prospects: The 2017 revision: DVD edition.
United Nations Economic Commission for Africa (2015). Africa census editing handbook. Addis Abeba: UNECA.
United Nations Department of Economic and Social Affairs, Statistics Division (2010).
Handbook on population and housing census editing: 1st revision. New York: United Nations.
World Health Organization (WHO) (1993). International statistical classification of diseases and related health problems: 10th revision. Geneva: WHO.
World Health Organization (WHO) (2007). Verbal autopsy standards: Ascertaining and attributing causes of death.Geneva: WHO.
World Health Organization (WHO) (2013). WHO guidance for measuring maternal mortality from a census. Geneva: WHO. http://apps.who.int/iris/bitstream/
10665/87982/1/9789241506113_eng.pdf.