VOLUME 38, ARTICLE 57, PAGES 1733
,
1776
PUBLISHED 25 MAY 2018
http://www.demographic-research.org/Volumes/Vol38/57/ DOI: 10.4054/DemRes.2018.38.57
Research Article
Post-transitional regional fertility in Romania
Dănuţ-Vasile Jemna
Mihaela David
© 2018 Dănuţ-Vasile Jemna & Mihaela David.
This open-access work is published under the terms of the Creative Commons Attribution 3.0 Germany (CC BY 3.0 DE), which permits use, reproduction, and distribution in any medium, provided the original author(s) and source are given credit.
1 Introduction 1734
2 Fertility in CEE countries 1737
3 Fertility determinants: A panel approach 1741
4 Regional demographic and socioeconomic development in Romania (1995–2015)
1746
4.1 Development regions of Romania: An overview 1747
4.2 Dynamics of fertility 1748
4.3 Dynamics of fertility determinants 1750
5 Data and methodology 1753
5.1 Data 1753
5.2 Stationary tests 1754
5.3 Panel data modeling 1755
5.4 Robustness checks 1756
6 Modeling results 1757
6.1 Panel unit root tests results 1757
6.2 Panel estimation results 1758
7 Discussion and conclusions 1762
References 1767
Post-transitional regional fertility in Romania
Dănuţ-Vasile Jemna1
Mihaela David2
Abstract
BACKGROUND
The slight variations in the main demographic indicators, particularly in fertility, recorded after 1995 suggest that the process of demographic transition has reached its final stage. Despite this stabilization at national level, significant differences in the evolution of fertility are found among the eight development regions of Romania. OBJECTIVE
The aim of this article is to analyze empirically the specific dynamics of this phenomenon in relation to its main demographic and socioeconomic determinants. METHODS
Using regional data registered between 1995 and 2015, pooled, fixed effects, and random effects panel models were applied.
RESULTS
Our empirical findings highlight that the variations in the total fertility rate are explained, at regional level and within the post-transitional demographic stage, by the changes in female employment rate, urbanization degree, real GDP per capita, marriage rate, and mean age of woman at first birth.
CONTRIBUTION
We consider that the study responds to a real need for research in this field and that the results may provide support for the development, in Romania, of demographic policy strategies at both regional and national levels.
1 Faculty of Economics and Business Administration, Alexandru Ioan Cuza University, Iași, Romania.
Email:[email protected].
2 Faculty of Economics and Business Administration, Alexandru Ioan Cuza University, Iași, Romania.
1. Introduction
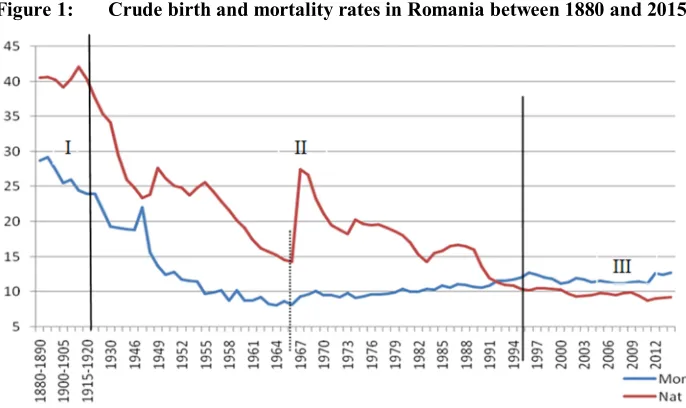
The social, economic, cultural, and educational changes produced in Romania throughout its history have strongly influenced the structure of the population and the evolution of demographic phenomena, especially mortality and natality. Following a pattern similar to that of the European countries, Romania has witnessed a long-term fertility decline trend – characterized by significant variations – that lasted almost a century (see Figure 1). Based on the statistical analysis of the reconstructed data on birth and fertility in the Romanian population during the 1900–1960 period, demographer Retegan-Şerbu (1962) notes that the trigger of the declining fertility process started only after World War I (after 1920). However, we agree with the hypothesis developed by Gheţău (1997), according to which the fertility decline began as early as 1885, except for the 1910–1914 period, when a slight increase of the phenomenon was registered (see Figure 1).
Figure 1: Crude birth and mortality rates in Romania between 1880 and 2015
Source: Authors’ computations based on data provided by the National Institute of Statistics of Romania (INSSE) and by Gheţău (1997).
From the beginning of the 21st century until World War I, natality registered a
slow decline. Between the two world wars, fertility declined abruptly, reaching a level that was almost half of the early 21st century one. After World War II, more precisely
its own baby boom phenomenon. As a result, according to the model of the Western countries, in Romania fertility increased at an average rate of 3.23 children per woman, followed by a slow decline trend, a total rate of 2.9 children per woman being registered in 1956. In 1957, liberalization of abortion accelerated the process, leading to a rate of 1.9 children per woman by 1965.
The change of the communist regime leadership in 1965 also brought about a change in the demographic policy as part of a development project for the whole of society. The new general secretary of the party and, later, head of the state, Nicolae Ceaușescu, imposed the pronatalist policy. Under the effect of the law, the demographic policy measures on abortion prohibition, adopted at the end of 1966, had a very strong short-term impact. In 1967 and 1968, the total fertility rate registered was almost double, from 1.9 children per woman (in 1966) to 3.7 (in 1967) and 3.6 (in 1968). In social and demographic terms, the Ceaușescu period was important because the proposed development project led to the promotion of gender equality and to a specific family formation model and childbearing. The woman came to assume a double role, both as mother, responsible for the domestic space, and as active actor in the economic and social life. Despite such measures, the increase period was very brief, the total fertility rate coming back to its downward tendency. At the end of the communist period, a fertility rate of 2.2 children per woman was reached, which was approximately the same value as in the 1960–1966 period. The 1967–1983 period represented a parenthesis in the decline of fertility, which only appeared as a historical fact induced by the pronatalist measures of the communist regime. Practically, in 1983 a fertility level equal to the one of the year 1966 was reached, meaning that Ceaușescu’s pronatalist policy delayed the fertility decline by nearly 20 years. After a final effort of the communist regime to encourage fertility in the early 1980s, the decline was resumed in the second half of the decade.
The decreasing fertility trend continued after the fall of the communist regime. The socioeconomic model underwent major restructuring, and the demographic changes were marked by these transformations. According to statistical data, fertility continued its past downward trend, started before the pronatalist policy (Rotariu 2006; Jemna 2011, 2015). Despite the pronatalist syncope that maintained fertility over the replacement threshold, the fertility decrease followed its downward course begun at the end of the 19th century. In 1990, fertility fell below the replacement threshold (1.84), and the decrease phenomenon continued by virtue of this long-term process. The fertility level relatively quickly reached very low values, well below the replacement threshold. After 1995, up to the present day, stability in fertility evolution, admitting fluctuations around an average value of about 1.3 children per woman, was recorded.
historical past, marked by the communist period. The decrease of fertility up to very low levels, along with the increase of mortality, are specific to these countries, which explains why, after 1990, most of them registered negative natural increase rates, besides the negative migration ones. Over the last 25 years, the situation of Romania, as well as of the other CEE countries, corresponded to the end of a long-term process that led to a demographically inauspicious situation. Numerous studies devoted to such aspects, which attempt to explain the phenomenon and to identify the possible demographic policy measures, have often mentioned that the demographic and socioeconomic factors that could explain the post-1990 demographic changes should be analyzed in the specific context of each country in spite of their similar pattern in fertility evolution (Frejka 2008; Kohler, Billari, and Ortega 2002).
The present study discusses the hypothesis according to which some conditions specific to the demographic evolution are manifesting in each country. Analysis of the demographic changes observed at the level of CEE countries has allowed highlighting variations of demographic phenomena both among and within them. Regional demographic variability is an important issue in the context of regional development strategies at the European level. Specifically, we are talking about the analysis of the relationship between the demographic and the socioeconomic factors viewed as fertility determinants in a regional context. Despite a relative stabilization of the demographic phenomena at national level after 1995, Romania still registers a series of differences regarding the fertility level and evolution as well as some other demographic phenomena that should be considered for future demographic policy measures. Identification of the regions and of the counties among which the most pronounced disparities are registered, as well as of the causes of these demographic disparities, appear as very important and are current research objectives.
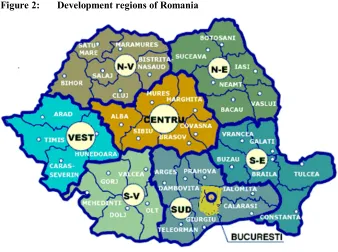
The eight development regions of Romania were established in 1998, in accordance with the second-level regulations of the territorial classification (NUTS 2) in force in the European Union (EU). At European level, special emphasis is placed on analyzing the regional economic, demographic, and social trends and differences on understanding the specificity of each region and on identifying specific local factors – which can be of economic, social, and demographic development nature. In this respect, studies on Romania are relatively few, the obtained results being largely based on the structural changes of the demographic system regarding the socioeconomic and demographic realities.
in the field and that the results can provide support for the development of useful demographic policy strategies and measures.
The paper is structured as follows. Two sections are devoted to the analysis of specialty literature. Section 2 reviews some theoretical aspects on demographic evolution in the CEE countries, and Section 3 refers to a series of results obtained in empirical studies on fertility using panel data. Section 4 is dedicated to a synthesis of the evolution of fertility and of its determinants at regional level in the 1995–2015 period, while Section 5 presents the data and the methodology used in this study. Section 6 illustrates the main empirical results. The study ends with a series of concluding remarks, discussions, and references.
2. Fertility in CEE countries
The demographic changes in the CEE countries are of particular interest for at least two reasons: these countries follow a similar demographic phenomena evolution pattern within a historical context with similar characteristics; the fertility evolution has reached very low rates, well below the replacement threshold, and the phenomenon seems to persist, with some fluctuations over the past 25 years. The specialty literature has attempted at explaining these changes by proposing a series of theories based not only on the experience of these countries but also on the evolution in the countries of Western Europe, Asia, etc.
For the CEE countries, several explanatory theories on demographic changes have been developed. Specialty studies have taken into account both the specificity of the communist regime and a number of characteristics of the socioeconomic transition period after the fall of the communist system. The CEE countries have a demographic regime marked by at least three determinants coming from the past: a probirth demographic policy, a centralized socioeconomic system, and an authoritarian political system (Frejka 2008). The communist period provided a relatively stable framework for family formation and childbearing, job security, free education and health systems, and low-cost housing. Moreover, within this system, an interesting model on both the economic and reproductive role of the woman has emerged. Based on pronatalist policies, the demographic evolution in the communist era delayed fertility – according to the past trend – for almost 20 years, and the process was resumed in the late 1980s. After 1990, fertility continued to decline, according to the previous trend, then reached a level of relative stability with low values, well below the replacement threshold. The fall of the communist system eliminated the favorable conditions for family formation and childbearing, replacing them with a number of restrictive features: job insecurity, expensive housing, labor market dynamics, etc.
In literature, fertility decline in the CEE countries is most often explained by two theories. One of them argues that demographic change is strongly determined by the socioeconomic transition process of these countries from the communist to the capitalist society type (Frejka 2008; Philipov and Kohler 2001; Kohler and Kohler 2002). From this perspective, some authors talk about a demographic transition crisis that led to a fertility decline well below the replacement threshold (Cornia and Paniccià 1996). This explanatory model considers that deterioration of the socioeconomic conditions and a certain amount of uncertainty at this level entails a rational response at demographic level that ultimately leads to fertility decrease. The second theory refers to the internalization of the Western value system in these countries: ideas, attitudes, and norms that give a specific demographic behavior type. To be more exact, we are talking about the internalization of the family formation and childbearing Western pattern, as stipulated by the second demographic transition theory (Sobotka, Zeman, and Kantorová 2003; Frejka 2008).
the natural fertility model to a controlled one). The defining element of the new theory is the transition of fertility in close connection with the changes in the value system of the Western world, in particular the replacement of the numerous family model with the narrowed family one, characterized by planning of child’s birth, according to the parents’ choices. In this regard, the fertility decline below the replacement threshold is explained by the increased contraception use, by the abortion legislation change, by the low marriage rates, by the increasing divorce rate, and by a higher consensual union level. Marriage rate decrease is related to the prolongation of the schooling period for women, which determines an age increase at marriage. Moreover, fertility decline also coincides with a massive economic and social restructuring, especially in gender relations. Men have lost their economic power in relative terms, while women, by massively entering the labor market, have had the tendency to earn more money and to gain economic and social independence (Lesthaeghe 1998). Within the second demographic transition, two more important components explaining the downward movement of fertility are distinguished. First, the significant and long-lasting decline in fertility is the result of the economic, social, and cultural factors relevant to the modernization process of societies. Second, fertility evolution below the replacement threshold is caused by postponing the birth of the first child, which leads to the general increase in the mean age of mothers at the birth of the child, or even to the abandonment of the idea of having children.
There are studies that try to evaluate the manner in which this theory works in different countries of Europe, Asia, and America. The research results show that we are actually witnessing a plurality of manifestation forms of the relationship between the value system and fertility dynamics within different contexts. Such studies seem to argue that postponement of childbearing and a decline in higher order births are two distinctive characteristics of fertility decline in the CEE countries, strongly correlated with the deterioration of the economic and social state of affairs (Billingsley 2010).
(corresponding to the post-transitional stage, predicted by the demographic transition theory). On the contrary, it is considered that we are dealing with a specific phenomenon and that a theoretical explanatory framework, which allows analysis of fertility evolution in the countries and regions affected by this situation, can be built up (Kohler, Billari, and Ortega 2002). According to the quoted study, such a theoretical framework explains the lowest-low fertility phenomenon by means of four reciprocally combined demographic and socioeconomic determinants: demographic distortions of period fertility measures; socioeconomic factors leading to the postponement of fertility; social interaction effects on the timing of fertility; postponement-quantum interactions, which lead to reductions in completed fertility.
The phenomenon of fertility decline to a level below the replacement threshold has been first observed in Western countries. The specialty literature considers that the emergence and persistence of low fertility is the consequence of two major socioeconomic phenomena: social liberalism, which questions the fertility issue in relation to gender equity, and labor market deregulation, which brings into discussion the relationship between fertility and risk aversion (McDonald 2006). According to the first dimension, fertility remains low because of some incoherence between two types of social institutions that put pressure on woman’s choice between family and work: the individual-oriented and family-oriented institutions. The second analysis dimension leads to the conclusion that a low fertility level arises as a result of people’s perception that childbirth would represent a risk to economic well being (McDonald 2000, 2006). These two characteristics are also valid for the CEE countries and correspond to the period following the year 1990.
The studies that take into account the lowest-low fertility idea for the CEE countries seem, in the end, to highlight two main causes of the phenomenon: childbearing postponement (Kohler, Billari, and Ortega 2002) and unfavorable socioeconomic conditions specific to the transition process from communism to a democratic society (Sobotka 2004; Frejka 2008). Practically, these explanations correspond to the two previously mentioned theoretical directions, however nuanced for the peculiarities of the CEE countries. If we accept these two explanations, or a version that combines them, then this phenomenon will persist in the future. On one hand, postponement may persist because, in these countries, the mean age of women at first marriage is still low compared to the Western countries. On the other hand, if the socioeconomic transition process continues, we may not record a recovery in fertility. Equally, certain measures that act upon these two factors may cause some fertility recovery.
demographic, social, and economic factors mentioned by the various theoretical approaches acquires different expressions not only in the CEE region, but also in each country separately, and we tend to think that this also happens at regional level. The regionalization paradigm, the socioeconomic development orientation in terms of regional resources and specificity, is an important reference point for both demographic phenomena dynamics analysis and possible measures that may have an impact on the demographic situation of a region or country.
3. Fertility determinants: A panel approach
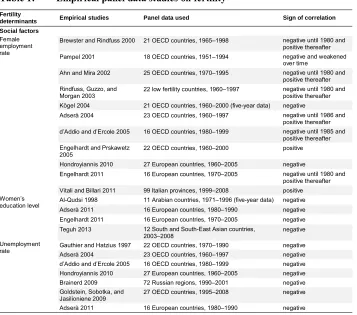
Considering the magnitude and importance of the demographic transformations, as part and parcel of the socioeconomic development process of a society, many demographers and economists have attempted to explain their nature, the correlations between the economic and demographic factors, the implications of these changes for various future development scenarios. Thus, in order to identify the main features specific to fertility decline at both global and regional development levels, we have synthesized (in Table 1) the results of certain empirical studies. The methodology approached in these studies corresponds to panel analysis, as it aims at discussing the phenomenon both in time and at country level, which highlights some more complex relationships. For the most part, the studies are carried out at the level of OECD countries as well as in Asian and European countries experiencing the low fertility phenomenon. Analysis of these studies allows general conclusions on the factors influencing fertility as well as their impact over time and their space heterogeneity. The results of the analysis will be used to substantiate the empirical study, in the case of Romania, at regional level.
female employment have changed over time. The authors support this hypothesis through both the presence of unmeasured factors specific to each country and the heterogeneity in the magnitude of the negative time-series association between fertility and female employment. Their results show that the initial increases in female employment rates lead to a substantial fertility decrease, but the continuous increases of this factor have an increasingly lower impact upon fertility. Therefore, the correlation sign between the two factors does not change, while a progressive decrease in the negative influence intensity of the female employment rate on the total fertility rate is registered.
Table 1: Empirical panel data studies on fertility
Fertility
determinants Empirical studies Panel data used Sign of correlation Social factors
Female employment rate
Brewster and Rindfuss 2000 21 OECD countries, 1965–1998 negative until 1980 and positive thereafter Pampel 2001 18 OECD countries, 1951–1994 negative and weakened
over time
Ahn and Mira 2002 25 OECD countries, 1970–1995 negative until 1980 and positive thereafter Rindfuss, Guzzo, and
Morgan 2003 22 low fertility countries, 1960–1997 negative until 1980 andpositive thereafter Kögel 2004 21 OECD countries, 1960–2000 (five-year data) negative
Adserà 2004 23 OECD countries, 1960–1997 negative until 1986 and positive thereafter d’Addio and d’Ercole 2005 16 OECD countries, 1980–1999 negative until 1985 and
positive thereafter Engelhardt and Prskawetz
2005 22 OECD countries, 1960–2000 positive
Hondroyiannis 2010 27 European countries, 1960–2005 negative
Engelhardt 2011 16 European countries, 1970–2005 negative until 1980 and positive thereafter Vitali and Billari 2011 99 Italian provinces, 1999–2008 positive Women’s
education level Al-Qudsi 1998 11 Arabian countries, 1971–1996 (five-year data) negative Adserà 2011 16 European countries, 1980–1990 negative Engelhardt 2011 16 European countries, 1970–2005 negative Teguh 2013 12 South and South-East Asian countries,
2003–2008 negative
Unemployment
rate Gauthier and Hatzius 1997Adserà 2004 22 OECD countries, 1970–199023 OECD countries, 1960–1997 negativenegative
d’Addio and d’Ercole 2005 16 OECD countries, 1980–1999 negative Hondroyiannis 2010 27 European countries, 1960–2005 negative Brainerd 2009 72 Russian regions, 1990–2001 negative Goldstein, Sobotka, and
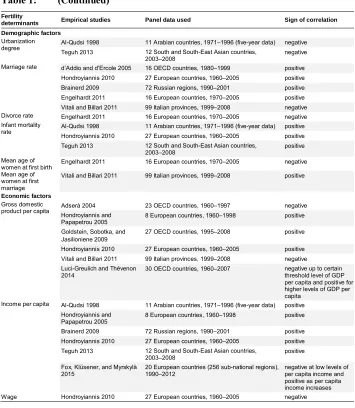
Table 1: (Continued)
Fertility
determinants Empirical studies Panel data used Sign of correlation Demographic factors
Urbanization
degree Al-Qudsi 1998 11 Arabian countries, 1971–1996 (five-year data) negative Teguh 2013 12 South and South-East Asian countries,
2003–2008 negative
Marriage rate d’Addio and d’Ercole 2005 16 OECD countries, 1980–1999 positive Hondroyiannis 2010 27 European countries, 1960–2005 positive Brainerd 2009 72 Russian regions, 1990–2001 positive Engelhardt 2011 16 European countries, 1970–2005 positive Vitali and Billari 2011 99 Italian provinces, 1999–2008 negative Divorce rate Engelhardt 2011 16 European countries, 1970–2005 negative Infant mortality
rate Al-Qudsi 1998 11 Arabian countries, 1971–1996 (five-year data) positive Hondroyiannis 2010 27 European countries, 1960–2005 positive Teguh 2013 12 South and South-East Asian countries,
2003–2008 positive
Mean age of
women at first birth Engelhardt 2011 16 European countries, 1970–2005 negative Mean age of
women at first marriage
Vitali and Billari 2011 99 Italian provinces, 1999–2008 positive
Economic factors Gross domestic
product per capita Adserà 2004 23 OECD countries, 1960–1997 negative Hondroyiannis and
Papapetrou 2005 8 European countries, 1960–1998 positive Goldstein, Sobotka, and
Jasilioniene 2009
27 OECD countries, 1995–2008 positive
Hondroyiannis 2010 27 European countries, 1960–2005 positive Vitali and Billari 2011 99 Italian provinces, 1999–2008 negative Luci-Greulich and Thévenon
2014 30 OECD countries, 1960–2007
negative up to certain threshold level of GDP per capita and positive for higher levels of GDP per capita
Income per capita Al-Qudsi 1998 11 Arabian countries, 1971–1996 (five-year data) positive Hondroyiannis and
Papapetrou 2005 8 European countries, 1960–1998 positive Brainerd 2009 72 Russian regions, 1990–2001 positive Hondroyiannis 2010 27 European countries, 1960–2005 positive Teguh 2013 12 South and South-East Asian countries,
2003–2008 positive
Fox, Klüsener, and Myrskylä 2015
20 European countries (256 sub-national regions), 1990–2012
negative at low levels of per capita income and positive as per capita income increases Wage Hondroyiannis 2010 27 European countries, 1960–2005 negative
equality and women’s roles as mothers and spouses in the family. This hypothesis is in line with the studies of Engelhardt and Prskawetz (2005) and Engelhardt (2011), who argue that educational attainment of women contributes to the association change between total fertility rate and female employment, as well as with Hondryiannis’ observation (Hondryiannis 2010), according to which women’s level of education plays an important role in female labor market involvement, which directly affects marriage and childbirth decisions and, implicitly, fertility. Consequently, the education level increase and women’s delayed transition to the labor market lead to a postponement of childbirth (tempo effect) while not necessarily affecting parents’ demand for the total number of children (quantum effect). In other words, the total fertility rate registers a decline tendency due to the changes in the timing of births, which, however, begins to increase at the end of the postponement period (Rindfuss, Bumpass, and St. John 1980; Lesthaeghe 2001; Bongaarts 2002; Sobotka 2004; Luci-Greulich and Thévenon 2014).
A downward shock to infant mortality, due, for example, to the advanced technology in medicine and to the improvement of the living standards, contributes to fertility decrease (Al-Qudsi 1998; Panopoulou and Tsakloglou 2001; Hondroyiannis 2010; Teguh 2013). For the highly developed countries, the already low level of infant mortality no longer has an important effect on fertility, but the theory argues that a continued decline of this index may lead to further reductions in fertility (Cigno 1998; Sah 1991; Becker, Glaeser, and Murphy 1999; Pommeret and Smith 2005).
Other proximate demographic determinants of fertility are marriage and divorce. The increase of marriage rate leads to a subsequent fertility increase, considering that one of the major goals of marriage remains related to the desire to have children (Bailey and Chambers 1998; Hondroyiannis and Papapetrou 2005; Brainerd 2009). The divorce rate is negatively correlated with the total fertility rate, which, unlike the marriage rate, also contributes significantly to changing the association sign between female employment and fertility (Engelhardt 2011).
In the context of low fertility, the negative impact of economic advancement has been widely discussed in literature; however, the robustness of some results continues to be debated. Numerous empirical studies support the negative correlation between the dynamics of economic development and the fertility trend at both regional level (Brainerd 2009; Vitali and Billari 2011) and European (Hondroyiannis and Papapetrou 2005; Hondroyiannis 2010), Asian (Al-Qudsi 1998; Teguh 2013), or OECD countries (Adserà 2004; Goldstein, Sobotka, and Jasilioniene 2009) level. Therefore, the countries with low economic level register high fertility rates, while the economically developed ones contribute to fertility decrease. Nevertheless, recent evidence suggests that the long-term negative association pattern between fertility and the economic level is no longer significant for some of the most economically developed countries since, above a certain economic growth level, the turnaround of this association is observed. For example, Myrskylä, Kohler, and Billari (2009) show that, for high socioeconomic development levels, measured by the human development index, the relationship becomes positive. Considering the economic development of the OECD countries, Luci-Greulich and Thévenon (2014) argue that the strong negative relationship between GDP per capita and fertility is no longer valid for high values of the economic indicator, but that it becomes positive starting from a certain economic development threshold. The authors argue that this change in the correlation sign between the two indices is supported by the modified relationship between fertility and female employment within-country variation sign. This explanation implies that reversal in the positive relationship between fertility and economic trends is only possible for countries where economic development is accompanied by an increased female employment rate. An alternative interpretation suggests that fertility rebound is largely linked to the end of postponement (Goldstein, Sobotka, and Jasilioniene 2009; Bongaarts and Sobotka 2012). However, literature does not clearly support the postponement end effect on the relationship between economic development and fertility dynamics. In this respect, although Luci-Greulich and Thévenon (2014) conclude that birth postponement has a certain role in explaining such tendencies towards a reversal of fertility in the economic development process, other factors captured by GDP per capita contribute to fertility reincrease. In the same note, Fox, Klüsener, and Myrskylä (2015) point out that this causality hypothesis is not entirely supported, as the end of postponement and the economic outcome improvement can occur simultaneously. However, in line with the works of Myrskylä and Goldstein (2013), Myrskylä, Goldstein, and Cheng (2013), and Schmertmann et al. (2014), part of the fertility increase in highly developed countries is not attributed to this tempo effect but rather to a real fertility level increase.
sub-national regions. For most of these countries, the results suggest a decline in the previously strong negative relationship between fertility and income per capita at regional level while, for others, a turnaround in the relationship between the two factors. However, the fertility and economic development levels at which this change occurs vary significantly among countries. With these results, the authors manage to show that the regional dimension is important in understanding the potential mechanisms through which economic development could positively influence fertility, given that this approach allows the control of idiosyncrasies at national level and, at the same time, large income variations.
To conclude with, the previous empirical evidences suggest that the traditional determinant effects of fertility dynamics must be analyzed in relation to the influence of the different social, cultural, institutional, and economic characteristics of a country. Likewise, as pointed out by Luci-Greulich and Thévenon (2014), in the context of modern societies, a recovery in fertility cannot take place unless it is accompanied by institutional changes aimed at improving parents’ opportunities to combine their professional and family life.
4. Regional demographic and socioeconomic development in
Romania (1995–2015)
The aim of the present study is to analyze fertility dynamics both in time and within the regional profile of Romania, in relation to a series of economic, social, and demographic factors identified in literature. Analysis of these factors at Romanian level is carried out mainly in the context of the broader topic of regional economic and social disparities recorded (Pintilescu 2011, Benedek and Verres 2013; Goschin 2014, 2015; Chirilă and Chirilă 2014). Regional disparities are considered a phenomenon specific to countries with emerging economies (Kuznetz 1995) whose economic development is carried out at different rhythms. However, these disparities are directly correlated with the natural, geographical, and demographic potential of the regions, namely with the differential spatial distribution of their resources (OECD 2013). Last, but not least, regional disparities are also explained by the quality of the functioning political and social institutional mechanism (Kutscherauer et al. 2010). At the level of Romania, studies evidence the presence of regional disparities, which depend on both their natural profile and past development process dynamics. The most important factors responsible for such disparities are the economic development; the natural, demographic, social, and cultural profile of the regions; the regional development policy measures.
Synthesis of the evolution of fertility and of its determinants at regional level, for the 1995–2015 period, realized by descriptive statistical analysis, is presented in the following.
4.1 Development regions of Romania: An overview
Figure 2: Development regions of Romania
Source: INSSE.
Specialty studies show that regional disparities, such as economic development and demographic configuration, tend to increase during the transition period, opened by the 1990s. The determinants of fertility identified in literature and discussed in the previous section are part of the variables that may also explain the regional disparities in Romania. Using the descriptive statistical analysis, we present a synthesis of the evolution of fertility and of its determinants at regional level, along the 1995–2014 period.
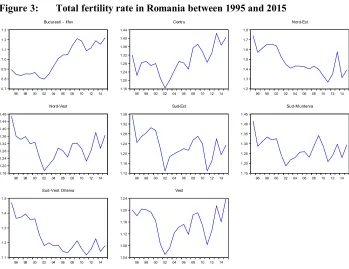
4.2 Dynamics of fertility
Figure 3: Total fertility rate in Romania between 1995 and 2015 0.7 0.8 0.9 1.0 1.1 1.2 1.3
96 98 00 02 04 06 08 10 12 14 Bucuresti - Ilfov
1.16 1.20 1.24 1.28 1.32 1.36 1.40 1.44
96 98 00 02 04 06 08 10 12 14 Centru 1.2 1.3 1.4 1.5 1.6 1.7 1.8
96 98 00 02 04 06 08 10 12 14 Nord-Est 1.16 1.20 1.24 1.28 1.32 1.36 1.40 1.44 1.48
96 98 00 02 04 06 08 10 12 14 Nord-Vest 1.12 1.16 1.20 1.24 1.28 1.32 1.36
96 98 00 02 04 06 08 10 12 14 Sud-Est 1.15 1.20 1.25 1.30 1.35 1.40 1.45
96 98 00 02 04 06 08 10 12 14 Sud-Muntenia 1.1 1.2 1.3 1.4 1.5
96 98 00 02 04 06 08 10 12 14 Sud-Vest Oltenia 1.04 1.08 1.12 1.16 1.20 1.24
96 98 00 02 04 06 08 10 12 14 Vest
Source:Authors’ computations based on the data provided by INSSE.
4.3 Dynamics of fertility determinants
Over the analyzed period, the real GDP per capita shows an increase trend at both national and regional level, however regional variability implies an important temporal dynamics (Figure 4a). In addition to an upward trend of the economic development level, affected by the 2008 crisis, an increase in regional disparities regarding the economic development may be observed.
If assessing the real GDP per capita variability between regions, using the variation coefficient, one may mention that this indicator is increasing, from 0.19 in 1995 to a value of 0.53 in 2015. It follows that the differences between regions as to the degree of economic development are gradually increasing from one year to another.
Such GDP discrepancies can also be observed if analyzing the variation in the participation of each region in the national GDP. According to the INSSE data, between 1995 and 2015, the Bucureşti-Ilfov region increased its regional GDP share in the national GDP share (%) by almost 12% (i.e., an increase from 15% to 27%). The Vest region also recorded an increase (0.23%) while the other regions reduced their contribution. The least economically developed regions, the Nord-Est, the Sud-Est, and the Sud-Vest Oltenia, also reduced their contribution to the national GDP in 2015 by 3.4%, 2.1%, and 1.6%, respectively, compared to the year 1995.
Figure 4: Real GDP per capita (a) and female employment rate (b) for Romanian regions between 1995 and 2015
a) b)
0 4,000 8,000 12,000 16,000 20,000
96 98 00 02 04 06 08 10 12 14 Bucuresti - Ilfov Centru
Nord-Est Nord-Vest Sud-Est Sud-Muntenia Sud-Vest Oltenia Vest
52 56 60 64 68 72 76
96 98 00 02 04 06 08 10 12 14 BUCURESTI-ILFOV CENTRU NORD-EST NORD-VEST SUD-EST SUD-MUNTENIA SUD-VEST OLTENIA VEST
Source:Authors’ computations based on data provided by Eurostat (a) and INSSE (b).
The rapid rise in unemployment after 1990 was a phenomenon specific to CEE countries after the collapse of the communist system. As shown in Figure 5a, the evolution of unemployment at national and regional levels after 1995 shows quite clearly the conjectural nature of the transition. The less developed regions, where the labor market structure was not diversified, were the most affected by unemployment. The industrialized areas of the Centru and Sud-Est regions suffered because some huge industrial complexes have been closed. The disparities among regions tend to increase over time, even though this indicator registers a downward trend. Overall, unemployment does not achieve a certain trend but conjectural variations at the level of all regions. Exceptions are the Centru region, where unemployment presented a slight upward trend, and the Nord-Est region, where a slight downward trend was registered.
Figure 5: Unemployment rate (a) and mean age of women at first birth (b) in Romania between 1995 and 2015
a) b) 0 2 4 6 8 10 12 14 16
96 98 00 02 04 06 08 10 12 14 Bucuresti - Ilfov Centru
Nord-Est Nord-Vest Sud-Est Sud-Muntenia Sud-Vest Oltenia Vest
21 22 23 24 25 26 27 28
96 98 00 02 04 06 08 10 12 14 Bucuresti - Ilfov Centru
Nord-Est Nord-Vest Sud-Est Sud-Muntenia Sud-Vest Oltenia Vest
Source:Authors’ computations based on data provided by INSSE (a) and Eurostat (b).
At regional level, the marriage and divorce phenomena somehow followed the national level trend (Figure 6): the marriage rate was decreasing, with a syncope registered in 2007 (when the increase is conjectural, due to some financial measures taken to encourage marriage, which were stopped afterwards); the divorce rate allowed slight fluctuations, around an average of 1.4 divorces per one thousand people. Over time, inter-regional differences are accentuated when it comes to marriage, and reduced in the case of divorce. The higher marriage rate in the developed regions is easy to explain, and it is a sign of the transition period.
Figure 6: Marriage (a) and divorce rate (b) in Romania between 1995 and 2015
a) b) 4 5 6 7 8 9 10
96 98 00 02 04 06 08 10 12 14 Bucuresti - Ilfov Centru
Nord-Est Nord-Vest Sud-Est Sud-Muntenia Sud-Vest Oltenia Vest
0.8 1.2 1.6 2.0 2.4 2.8
96 98 00 02 04 06 08 10 12 14 Bucuresti - Ilfov Centru
Nord-Est Nord-Vest Sud-Est Sud-Muntenia Sud-Vest Oltenia Vest
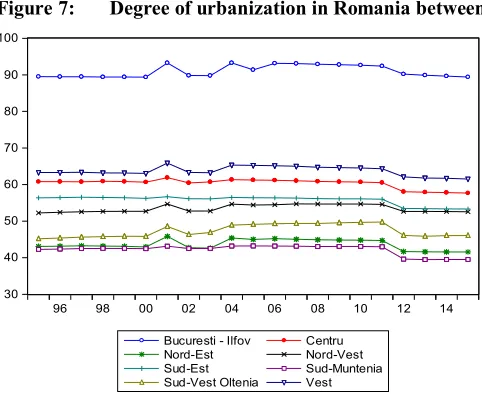
As to the degree of urbanization (Figure 7), the differences among regions are obvious: the developed regions were also those with a higher urbanization level (over 60%), whereas the least developed ones (Nord-Est, Sud-Muntenia, and Sud-Vest Oltenia) registered a low level (below 50%). The increase of the urbanization level is not very important during the analyzed period (a mean of 0.8%).
Figure 7: Degree of urbanization in Romania between 1995 and 2015
30 40 50 60 70 80 90 100
96 98 00 02 04 06 08 10 12 14
Bucuresti - Ilfov Centru
Nord-Est Nord-Vest
Sud-Est Sud-Muntenia
Sud-Vest Oltenia Vest
Source:Authors’ computations based on data provided by INSSE.
5. Data and methodology
This section presents the data and the methodology used to assess empirically the output effects of the demographic and socioeconomic factors upon the dynamics of regional fertility.
5.1 Data
As in the studies described in Table 1, the dependent variable is the total fertility rate (the average number of children who would be born to a woman over her reproductive lifetime), while the independent variables on which focus is laid are theoretically and empirically well known as demographic and socioeconomic determinants of fertility. Out of the demographic factors, the degree of urbanization (%), the crude marriage rate (number of marriages per 1,000 mid-year total population), the crude divorce rate (number of divorces per 1,000 mid-year total population), and the mean age of women at first birth (years) are used. Out of the social factors group, included here were the female employment rate (%) and the unemployment rate (%). From the last category of factors, the economic ones, the real GDP per capita (euro) was considered.
As a standard method in most applied macro-econometric works, all variables are transformed by logarithm. This common practice has theoretical reasons. In addition to the possibility of obtaining more homogeneous data series, using log-log models facilitates the interpretation of results in terms of elasticity and, as Comolli (2017) argues, allows smoothing of any non-linearity in the relationship between fertility and its determinants.
5.2 Stationary tests
It is possible that the variables in this study are stationary in first difference, meaning that the mean and the variance values are constant over time after the first differencing. This could give rise to a spurious regression problem, which implies that it is not appropriate to apply standard inference to the estimation results.
In literature, two categories of unit root tests, which allow the analysis of the integration order of the variables in the panel data setting, are distinguished. On one hand, there are the tests that verify the hypothesis according to which there is an individual unit root for each panel in the series, against the alternative of at least one stationary panel. On the other hand, the tests that assume the null hypothesis of a common unit root for each panel against the alternative that all panel data series are stationary are distinguished.
small size of the panel, which is inherent in analyzing the regional data in a country, having as reference a short period. To test for both difference and trend stationarity, we include both the trend and the intercept in the autoregressive specification of each test.
5.3 Panel data modeling
The panel models are based on the idea of pooling cross-sectional time series, which involves including simultaneously the cross-sectional and the time series effects of the independent variables on the dependent variable.
In the present analysis, alternative models are built up to measure the effect of an increase in different demographic and socioeconomic factors upon fertility. This approach also allows for assessing the change in the magnitude of the relation between fertility and its determinants. By applying pooled OLS, a first model is estimated with the log of fertility as the endogenous variable and the log of the exogenous variables – taking into consideration the first-differenced transformation of the log of non-stationary ones. The pooled time series regression equation is:
= + + , = 1, , = 1, , (1)
where is a vector of the independent variables and is the error term assumed with conditional mean zero and independent on .
Following several authors (Pampel 2001; Kögel 2004; Adserà 2004, 2011; Engelhardt and Prskawetz 2005; Hondryiannis 2010; Engelhardt 2011), we attempt to capture the unobserved region- or time-specific (demographic, socioeconomic, as well as social policy) factors that may affect fertility by applying the fixed effects estimation method with robust standard errors (Wooldridge 2015). To do so, three variants of models are distinguished: the region-specific fixed effects model, the time-specific fixed effects model, and the jointly region- and time-specific fixed effects model.
The first model captures the unobserved effects of region-specific variables ( ), which are constant over time and correlated with the explanatory variables. The analytical equation of this model is:
= + + + , (2)
= + + + . (3) The inclusion of both fixed effects in the model controls for the time-constant region-specific factors and the time-varying factors common to all regions in the panel. Such a model allows assessing the change in fertility controlling for time- and region-specific heterogeneity in the effect of the demographic and socioeconomic factors that influence fertility. Theoretically, this model is given by:
= + + + + . (4)
The validity of the fixed effects included in the model is tested by performing a Fisher test, which takes into account the residual variance of the restricted model (pooled OLS) and the residual variance of the unrestricted one (fixed effects model). If the null hypothesis is not true, the model with fixed effects is significant.
5.4 Robustness checks
Further on, several robustness checks for the estimated models are applied for capturing the possible biases caused by the unobserved heterogeneity, the sensitivity of the stationary panel unit root tests, and the presence of multicollinearity.
In our analysis, in order to capture the unobserved heterogeneity, two panel data estimation methods were employed: the fixed effects and the random effects estimations. By applying fixed effects OLS estimation with robust standard errors (Wooldridge 2015) might produce unbiased and consistent estimates of the coefficients. The approach of the random effects estimation, which consists in applying the generalized least square (GLS) estimation method while also allowing control of the unobserved heterogeneity, but, unlike the fixed effects one, it captures both within- and between-regions variation. The difference between the two estimation specifications is underlined with the and components, which are random variables with zero mean and constant variance, independent on and on each other, regardless of i andt. To test for the validity of the random effects estimator, the Hausman test is used. Hence, a significant value of the test suggests that the fixed effects model is better than the random effects one. As shown in the following, the fixed effects models turn out to be better suited than the pooled and the random effects models for assessing the relationship between fertility and the demographic and socioeconomic factors.
function of the log of all exogenous variables. Then, using the same specification estimation, the first-differenced transformation of the log of total fertility rate is expressed as a function of the first-differenced transformation of the log of all independent variables. These robustness checks are important because the estimation results show whether, once different fixed effects are included, the relationship between fertility and each exogenous factor becomes insignificant, or whether this association remains similar in sign and magnitude once different transformations on variables are included.
Finally, the lack of any statistical significance for some exogenous variables may be driven by the existence of possible multicollinearity. In order to test for the presence of multicollinearity among independent variables, the variance inflation factor (VIF) is used.
6. Modeling results
This section presents the main results of fertility modeling following the previously discussed steps regarding the methodology on panel data.
6.1 Panel unit root tests results
To assess the stationarity of our variables, Table 2 reports the results of the LLC, IPS, and Fisher-ADF unit root tests. The correction of non-stationarity, if applicable, is performed by means of the difference operator.
Table 2: Panel unit root tests
Undifferenced First difference
Variables LLC IPS Fisher-ADF LLC IPS Fisher-ADF LTFR –2.93770 *** –0.04541 35.3757 ***
LGDP 0.80851 2.15732 3.69360 –4.17130 *** –2.15551 ** 26.4384 **
LFEM –1.51000 * –1.21669 27.5886 ** – – –
LNUP –2.10675 *** –2.65669 *** 28.3303 ** – – –
LDIV –3.92158 *** –2.39486 *** 29.3710 *** – – –
LUNEMP 0.71359 0.17024 12.1618 0.20511 –5.60832 *** 61.9684 *** LURB –0.42164 3.02948 1.99687 –7.56003 *** –6.60612 *** 71.8154 *** LMAB –4.22626 *** –0.40780 15.7471 0.61355 –6.67650 *** 72.6041 ***
Note: *** indicate the rejection of null hypothesis for 1%; ** indicate the rejection of null hypothesis for 5%; * indicate the rejection of null hypothesis for 10%. Variables are abbreviated as follows: LTFR – log of total fertility rate; LGDP – log of real GDP per capita; LFEM – log of female employment rate; LNUP – log of nuptiality rate; LDIV – log of divorce rate; LUNEMP – log of unemployment rate; LURB – log of urbanization degree; LMAB – log of mean age of women at first birth.
To reject the non-stationarity hypothesis, the results of at least two tests were simultaneously taken into consideration. According to Table 2, the logarithm of real GDP per capita, the unemployment rate, the degree of urbanization, and the mean age of women at first birth are non-stationary. On the contrary, the test rejected the null hypothesis for the first differences. For the other variables, the null hypothesis of the presence of a unit root is rejected.
6.2 Panel estimation results
To assess the effects of the demographic, social, and economic factors on the dynamics of fertility over time and at the level of the Romanian regions, several panel regression models (discussed in Sections 5.3 and 5.4) were built up. The empirical analysis allows for heterogeneity across regions and/or time in the association between fertility and its potential determinants. The results obtained from the estimation of these models are synthesized in Table 3 and included in the core text and in the tables available in the Appendix.
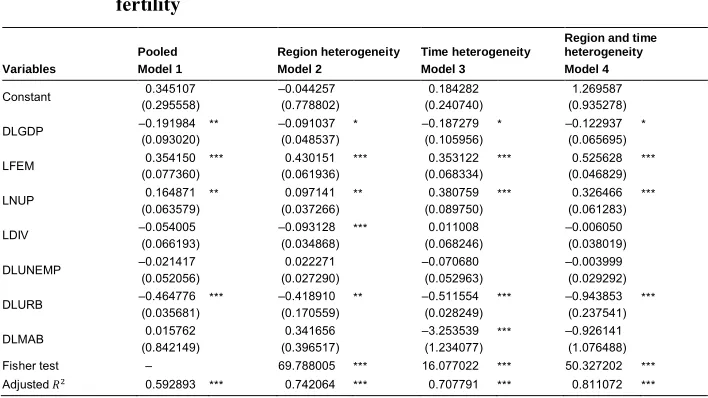
Table 3 summarizes the estimation results of two categories of models: pooled and fixed effects models. The latter category includes three types of models: the model with region-specific fixed effects (model 2), the model with time-specific fixed effects (model 3), and the model also including fixed effects but specific to both dimensions (model 4).
We start with testing a log-log model (model 1) capturing the relationship between fertility and its determinants by using pooled OLS estimation. The results obtained suggest that fertility is significantly related to demographic and socioeconomic factors, such as female employment rate, real GDP per capita, degree of urbanization and marriage rate. The fertility decline can be explained by the increase in real GDP per capita and in the degree of urbanization, and by the decrease in female employment rate and nuptiality rate. For all exogenous variables, the VIF values fall below 5 (Table A-1). Therefore, the model has no problem of multicollinearity.
Table 3: Estimates of the pooled and fixed effects regression models on fertility
Region and time heterogeneity Pooled Region heterogeneity Time heterogeneity
Variables Model 1 Model 2 Model 3 Model 4
Constant 0.345107 (0.295558) –0.044257 (0.778802) 0.184282 (0.240740) 1.269587 (0.935278) DLGDP –0.191984 (0.093020) ** –0.091037 (0.048537) * –0.187279 (0.105956) * –0.122937 (0.065695) * LFEM 0.354150 (0.077360) *** 0.430151 (0.061936) *** 0.353122 (0.068334) *** 0.525628 (0.046829) *** LNUP 0.164871 (0.063579) ** 0.097141 (0.037266) ** 0.380759 (0.089750) *** 0.326466 (0.061283) *** LDIV –0.054005 (0.066193) –0.093128 (0.034868) *** 0.011008 (0.068246) –0.006050 (0.038019) DLUNEMP –0.021417 (0.052056) 0.022271 (0.027290) –0.070680 (0.052963) –0.003999 (0.029292) DLURB –0.464776 (0.035681) *** –0.418910 (0.170559) ** –0.511554 (0.028249) *** –0.943853 (0.237541) *** DLMAB 0.015762 (0.842149) 0.341656 (0.396517) –3.253539 (1.234077) *** –0.926141 (1.076488)
Fisher test – 69.788005 *** 16.077022 *** 50.327202 ***
Adjusted 0.592893 *** 0.742064 *** 0.707791 *** 0.811072 ***
Notes: *** indicate the rejection of null hypothesis for 1%; ** indicate the rejection of null hypothesis for 5%; * indicate the rejection of null hypothesis for 10%; Robust standard errors in parentheses. Variables are abbreviated as follows: DLGDP – first difference of log of real GDP per capita; LFEM – log of female employment rate; LNUP – log of nuptiality rate; LDIV – log of divorce rate; DLUNEMP – first difference of log of unemployment rate; DLURB – first difference of log of urbanization degree; DLMAB – first difference of log of mean age of women at first birth.
Source: Authors’ computations.
Furthermore, we apply random effects models, which also control for unobserved region and time heterogeneity. Table A-2 shows the results of GLS estimations with region-specific random effects (model 5), time-specific random effects (model 6), and jointly region- and time-specific random effects (model 7). The table also includes the test results for choosing between the models with fixed effects and the ones with random effects. For any of the three types of models described above, the estimated statistics for the Hausman test were high enough to reject the null hypothesis at the 1% level of significance. Therefore, we could conclude that, for our data, the fixed effect specification is superior to a random effects specification in controlling for unobserved heterogeneity. Yet, potential bias in these estimates may be caused by the sensitivity of panel unit root tests. For this reason, the three types of models with fixed effects are re-estimated, including once all variables transformed by log and once the first-differenced transformation of the log of all variables (Tables A-3 and A-4). Overall, the results are not qualitatively different, being robust to different transformation of variables and estimation techniques used.
the divorce and mean age of women at first birth variables, which change their magnitude and significance in the case of two models. The divorce rate is significant only in the case of the region-specific fixed effects model, which is explained by the existing level of differences of this indicator by regions. Including regions fixed effects avoids omitted variable bias arising from unobserved factors that vary across regions but are constant over time. This result suggests that the unobserved factors, such as the cultural ones, which differ among regions, may have a more important impact on the influence of divorce on fertility. On the contrary, when controlling for time-specific unobserved factors, the mean age of women at first birth is significant for fertility decline. In this case, the negative impact of this indicator could be explained by the over time variations and lack of significant differences between regions after 1995. A similar aspect for all three models is the significant positive effect of female employment rate and of marriage rate on fertility. For all models, the negative impact of the economic development and of the urbanization degree on fertility is also maintained. Among the positive effect factors, the highest impact on fertility dynamics rate is that of the female employment rate, and among the negative ones – the degree of urbanization.
The signs of the regression coefficients are consistent with other literature studies (see Table 1), with the exception of the female employment rate. The estimates unveil that, in the regions with high levels of real GDP per capita, divorce (only when region-specific factors are included), urbanization, and mean age of women at first birth (only when time heterogeneity is controlled), the total fertility rate trend is decreasing. Within the regions with increasing rates of female employment and nuptiality, a fertility increase is also expected.
that the intra-regional and over time variations of the total fertility rate from the average estimated level change, compared to the other two models. The change is more obvious in the case of fixed effects specific to the Bucureşti-Ilfov, Nord-Est, and Vest regions, which change their sign.
increase in the growth rate of real GDP per capita reduces the total fertility rates by 0.18% (model 3). The negative association between the real GDP per capita and the total fertility rate is statistically different from zero and almost identical in magnitude for the rest of the fixed effects models.
7. Discussion and conclusions
Analysis of the specialty literature allowed us to identify some possible explanatory theories regarding the evolution of fertility in CEE countries, to which Romania also belongs. The theoretical and empirical approaches to the low fertility rate support the development of research toward new directions that should analyze the interaction between fertility and the demographic, social, and economic factors in the specific context of each country and also at regional level.
In the case of Romania, the slight variations of the main demographic indices after 1995 reveal that the demographic transition process reached a stage of relative stability, with a low fertility level, around an average of 1.3 children per woman. Despite this stabilization at national level, the regional profile registers significant differences regarding the level and variation of fertility and its possible determinants.
In order to analyze the variation of fertility in time and space, the specialty literature recommends the panel data modeling methodology. A detailed analysis of the empirical studies employing this approach enabled us to identify a series of fertility determinant factors at both country and region level. Synthesis of these studies (presented in Table 1) permitted the identification of three categories of factors: social (female employment rate, women’s education level, unemployment rate), demographic (mean age of women at first birth, mean age of women at first marriage, urbanization, divorce, marriage, infant mortality), and economic (GDP per capita, income per capita, wage).
The empirical analysis developed in this study led to the construction of some panel econometric models to assess the relationship between fertility and its main determinants at the level of the eight development regions of Romania over the 1995– 2015 period. As to the evolution of fertility, we identified two categories of regions with weaker or more pronounced variations from the national average: regions with a downward trend (Nord-Est, Sud-Est, Sud-Muntenia, Sud-Vest Oltenia, and Nord-Vest) and regions with a slight increase (Bucureşti-Ilfov, Centru, and Vest).
could conclude that the fixed effects models turn out to be superior to the pooled and random effects ones, being more appropriate for practical reasons.
The empirical results obtained for fixed effects models unveil that fertility variations observed at regional level after 1995 are explained by the changes in the female employment rate, marriage rate, degree of urbanization, and real GDP per capita. In addition, for the region-specific fixed effects model, the divorce rate has a significant impact upon fertility while, for the model with fixed effects over time, the mean age of women at first birth becomes significant in explaining fertility variation. Moreover, it was noticed that unemployment is not a significant fertility factor for any of the models. The regression coefficient signs for the significant variables are maintained for all constructed models and, except for the female employment rate, are consistent with the specialty literature results.
The significant positive relationship between fertility and female employment rate at regional level is one of the peculiarities of Romania and, eventually, of all CEE countries. This type of relationship finds support in at least two arguments. On one hand, we are talking about a woman’s profile ‘forged’ in the communist era, which asks her to play a double role within the society: the productive role as participant in the labor market and the reproductive role as mother. On the other hand, after 1990, the socioeconomic transition had a massive impact on the labor market, leading to a decline of the female employment rate. This particularity could be exploited for the possible fertility recovery policies by encouraging women to assume this double role within society. On one hand, it is possible to encourage women’s labor participation by eliminating any gender inequality and discrimination in the labor market. On the other hand, the support of women’s employment should be correlated with a series of measures that facilitate a coherent relationship between work and family life (a top public nursery system, working program flexibility, etc.). In this respect, the experience of France should be carefully analyzed (Toulemon, Pailhé, and Rossier 2008).
The empirical results support a significant impact of marriage upon fertility variation. In agreement with other empirical studies, there is a positive relationship between fertility and marriage. Despite a slight decline, in Romania we are witnessing stability of the family institution, with a high rate of marriage and small differences among regions.
The previous empirical evidence outlined the hypothesis of a negative impact of unemployment on couples’ decision to have a child and, implicitly, on fertility levels. Our results confirm the negative association between fertility and unemployment, but no significant fertility response to unemployment was found out. A possible explanation might be related to the small differences among regions and to the intra-regional variations over the post-communist period – from 1995 to 2015. In the same time, it is possible that due to the presence of other factors in the models, unemployment has very little additional explanatory power.
The mean age of women at first birth is another factor of interest for the analysis, as it partially allows the capture of birth postponing, especially at advanced ages, upon fertility. Empirical analysis suggests a significant negative effect of this indicator on fertility only if heterogeneity over time is controlled. This result is in line with literature studies, and it can be explained by the mean age at the first birth upward trend for all eight regions as well as by the very low intra-regional variations. Postponing the birth of the first child is a specific reality for CEE countries during the post-communist transition period, a phenomenon to be probably continued in the future, as the indicator level is below the EU average.
The significant negative impact of the urbanization degree on fertility complies with the specific character of the different demographic behavior of the two environments considering that, in Romania, by comparison, fertility is higher in the rural areas than in the urban ones. At the same time, the urbanization effect on fertility dynamics has to be studied in relation to the significant disparities regarding the level of this indicator recorded among regions. On one hand, for the regions with the highest urbanization degree and lowest fertility rates (Bucureşti-Ilfov, Centru, and Vest), a slight increase in the fertility rate is observed. On the other hand, in the regions with the lowest urbanization level (Sud-Muntenia, Nord-Est, and Sud-Vest Oltenia), fertility is declining and, moreover, the population is decreasing. Therefore, the influence of the urbanization degree should be taken into consideration both from the perspective of the inter-regional disparities and of the population structure by age group of each region (in the regions with a low degree of urbanization, there is a tendency of population aging), and even from that of the slight tendency decrease in the indicator observed in recent years at the level of each region.
but declining, whereas the regions with a high GDP level have lower but increasing fertility rates. Despite the overall negative impact of the economic development, the observed variation of the real GDP per capita and fertility for some regions (Bucureşti-Ilfov, Centru, and Vest) agrees with the recent empirical results recorded in literature. Based on them, the hypothesis of lowest-low fertility – according to which, under a certain fertility rate, the economic improvement plays an important role in explaining the increase of the total fertility rate – is supported.
The results of the empirical analysis carried out in this paper may be useful in developing fertility recovery policies that take into account regional specificities. Encouragement of natality could be sustained by the increase in female employment rate. For almost all regions, the female employment rate increase has led to a slight recovery of fertility in recent years and, for the regions also registering a high economic development level, such as Bucureşti-Ilfov, Centru, and Vest, the fertility recovery rate is even more pronounced. In this respect, the support of the public and private institutions and the public policy measures that allow parents to combine professional and family life plays an important part. As these public and private work-life balance instruments are part of the GDP measures, the economic development can be a crucial element in this process. In other words, economic development can lead to fertility increase for the regions that encourage women’s participation in the labor market. According to the obtained results, attention should also be focused on the urbanization degree, considering that the negative impact of this factor upon fertility is more pronounced compared to the GDP. Maintaining a higher fertility in the rural area in relation to the urban environment could be exploited in the direction of recovering fertility by providing a series of favorable socioeconomic conditions in rural environments, especially regarding the health and education systems. This observation should be correlated with that of the relative stability of marriage and divorce indicators, which still show that Romanians prefer the traditional family model. It is difficult to predict the evolution of the family within a society that tends to adopt the behavior of the Western societies, still tormented by the uncertainties of the transition process. However, encouraging and supporting family formation could be an important measure for fertility recovery. Synthesizing what has been discussed, we note that it is essential to understand the overall effect of the determinants upon fertility dynamics. In this regard, on one hand, the impact of heterogeneity over time and at regional level upon fertility and, on the other hand, the effect of the significant explanatory factors upon fertility dynamics should also be studied in detail.
References
Adserà, A. (2004). Changing fertility rates in developed countries: The impact of labor market institutions.Journal of Population Economics 17(1): 17–43.doi:10.1007/ s00148-003-0166-x.
Adserà, A. (2011). Where are the babies? Labor market conditions and fertility in Europe.European Journal of Population 21(1): 1–32. doi:10.1007/s10680-010-9222-x.
Ahn, N. and Mira, P. (2002). A note on the changing relationship between fertility and female employment rates in developed countries. Journal of Population Economics 15(4): 667–682.doi:10.1007/s001480100078.
Al-Qudsi, S. (1998). The demand for children in Arab countries: Evidence from panel and count data model. Journal of Population Economics 11(3): 435–452.
doi:10.1007/s001480050078.
Bailey, R.E. and Chambers, M.J. (1998). The impact of real wage and mortality fluctuations on fertility and nuptiality in precensus England. Journal of Population Economics 11(3): 413–434.doi:10.1007/s001480050077.
Becker, G.S. (1960). An economic analysis of fertility. In: National Bureau of Economic Research (ed.). Demographic and economic change in developed countries. New York: Columbia University Press: 209–240.
Becker, G.S. (1992). Fertility and the economy.Journal of Population Economics 5(3): 185–201.doi:10.1007/BF00172092.
Becker, G.S., Glaeser, E.L., and Murphy, K.M. (1999). Population and economic growth. American Economic Review, Papers and Proceedings 89(2): 145–149.
doi:10.1257/aer.89.2.145.
Benedek, J. and Verres, N.C. (2013). Economic disparities and changes in the convergence of the Romanian NUTS 2 and NUTS 3 regions.Romanian Review of Regional Studies 9(1): 85–90.
Billingsey, S. (2010). The post-communist fertility puzzle. Population Research and Policy Review 29(2): 193–231.doi:10.1007/s11113-009-9136-7.
Bongaarts, J. and Sobotka, T. (2012). A demographic explanation for the recent rise in European fertility. Population and Development Review 38(1): 83–120.
doi:10.1111/j.1728-4457.2012.00473.x.
Brainerd, E. (2009). The demographic transformation of post-socialist countries: causes, consequences, and questions. In: Roland, G. (ed.). Economies in transition: The long-run view. London: Palgrave Macmillan: 57–83.
Brewster, K.L. and Rindfuss, R.R. (2000). Fertility and women’s employment in industrialized nations. Annual Review of Sociology 26: 271–296. doi:10.1146/ annurev.soc.26.1.271.
Butz, W.P. and Ward, M.P. (1979). The emergence of counter cyclical U.S. fertility. American Economic Review 69(3): 318–328.
Cigno, A. (1998). Fertility decisions when infant survival is endogenous. Journal of Population Economics11(1): 21–28.doi:10.1007/s001480050056.
Chirilă, V. and Chirilă, C. (2014). The impact of economic and financial crisis on the regional disparities in Romania and European Union. Procedia – Social and Behavioral Sciences 109: 502–506.doi:10.1016/j.sbspro.2013.12.497.
Choi, I. (2001). Unit root tests for panel data. Journal of International Money and Finance 20(2): 249–272.doi:10.1016/S0261-5606(00)00048-6.
Comolli, C.L. (2017). The fertility response to the Great Recession in Europe and the United States. Demographic Research 36(51): 1549–1600. doi:10.4054/Dem es.2017.36.51.
Cornia, G.A. and Paniccià, R. (1996). The transition’s population crisis: An econometric investigation of nuptiality, fertility and mortality in severely distressed economies. MOCT-MOST Economic Policy in Transitional Economies 6(1): 95–129.doi:10.1007/BF02430940.
D’Addio, A.C. and d’Ecole, M. (2005). Policies, institutions and fertility rates: A panel data analysis for OECD countries.OECD Economic Studies 41(2): 8–45. Dyson, T. (2010).Population and development: The demographic transition. London:
Zed Books.