www.biogeosciences.net/11/4897/2014/ doi:10.5194/bg-11-4897-2014
© Author(s) 2014. CC Attribution 3.0 License.
Assessing the spatial variability in peak season CO
2
exchange
characteristics across the Arctic tundra using a light response
curve parameterization
H. N. Mbufong1, M. Lund1, M. Aurela2, T. R. Christensen1,3, W. Eugster4, T. Friborg5, B. U. Hansen5,
E. R. Humphreys6, M. Jackowicz-Korczynski3, L. Kutzbach7, P. M. Lafleur6, W. C. Oechel8, F. J. W. Parmentier1,3,
D. P. Rasse9, A. V. Rocha10, T. Sachs11, M. K. van der Molen12, and M. P. Tamstorf1
1Arctic Research Center, Department of Bioscience, Aarhus University, Roskilde, Denmark 2Finnish Meteorological Institute, Helsinki, Finland
3Department of Physical Geography and Ecosystem Science, Lund University, Lund, Sweden 4ETH Zürich, Institute of Agricultural Sciences, Dept. Env. Systems Science, Zurich, Switzerland 5Department of Geography and Geology, University of Copenhagen, Copenhagen, Denmark 6Department of Geography, Trent University, Trent, Canada
7Institute of Soil Science, University of Hamburg, Hamburg, Germany
8Department of Biology, San Diego State University, San Diego, California, USA 9Bioforsk, Norwegian Institute for Agricultural and Environmental Research, Ås, Norway 10University of Notre Dame, Department of Biological Sciences, Notre Dame, Indiana, USA 11Helmholtz Centre Potsdam, GFZ German Research Centre for Geosciences, Potsdam, Germany 12Meteorology and Air Quality group, Wageningen University, Wageningen, the Netherlands
Correspondence to: H. N. Mbufong ([email protected])
Received: 3 March 2014 – Published in Biogeosciences Discuss.: 6 May 2014 Revised: 29 July 2014 – Accepted: 4 August 2014 – Published: 15 September 2014
Abstract. This paper aims to assess the spatial variability
in the response of CO2 exchange to irradiance across the
Arctic tundra during peak season using light response curve (LRC) parameters. This investigation allows us to better un-derstand the future response of Arctic tundra under climatic change. Peak season data were collected during different years (between 1998 and 2010) using the micrometeorolog-ical eddy covariance technique from 12 circumpolar Arctic tundra sites, in the range of 64–74◦N.
The LRCs were generated for 14 days with peak net ecosystem exchange (NEE) using an NEE–irradiance model. Parameters from LRCs represent site-specific traits and char-acteristics describing the following: (a) NEE at light satura-tion (Fcsat), (b) dark respiration (Rd), (c) light use efficiency
(α), (d) NEE when light is at 1000 µmol m−2s−1(F
c1000),
(e) potential photosynthesis at light saturation (Psat) and (f)
the light compensation point (LCP).
Parameterization of LRCs was successful in predicting CO2flux dynamics across the Arctic tundra. We did not find
any trends in LRC parameters across the whole Arctic tundra but there were indications for temperature and latitudinal dif-ferences within sub-regions like Russia and Greenland. To-gether, leaf area index (LAI) and July temperature had a high explanatory power of the variance in assimilation parame-ters (Fcsat,Fc1000andPsat), thus illustrating the potential for
upscaling CO2exchange for the whole Arctic tundra. Dark
1 Introduction
Arctic tundra ecosystems contain vast amounts of carbon (C) that could potentially be released to the atmosphere in a warming climate. It is, however, unclear how these car-bon stocks are renewed by presently growing vegetation, and whether actual C sequestration rates vary among Arctic tun-dra ecosystems and vegetation types. Using eddy covariance (EC) flux data collected from the few seasonally active long-term flux sites in the Arctic, we assessed ecosystem-scale growth and respiration rates using a light response approach to answer this question.
Arctic tundra ecosystems are unique ecosystems with per-manently frozen subsoil (permafrost), which have global implications for climate and global environmental change (Shaver et al., 1992). Although estimated to cover only 8 % of the global land surface (McGuire et al., 2009), they contain vast stocks of C stored in the permafrost, estimated to be of the order of 1400 to 1850 Pg C (Hugelius et al., 2013; Kuhry et al., 2009; McGuire et al., 2009; Schuur et al., 2008). Their climate and vegetation have been shown to be most sensitive to global change (ACIA, 2005; Oechel et al., 2000; SWIPA, 2011). A decade ago, studies still did not agree on whether this region is a net sink or source of carbon dioxide (CO2)
as individual site studies either proved insufficient or incon-clusive in explaining this (Vourlitis and Oechel, 1997, 1999). Yet, recent estimates suggest that the Arctic tundra is most likely a net sink of CO2(IPCC, 2013), though whether it is a
strong or weak sink needs to be further assessed (McGuire et al., 2012).
Previously, the Arctic tundra C budget has been estimated by using data from a few detailed study sites to extrapolate to the larger surrounding area (Williams et al., 2006), and by the application of regional process-based models (McGuire et al., 2012). Scaling up from a few measurement sites to the circum-Arctic region raises the question of representa-tiveness of sites and measurements. This also holds for the widely used EC methodology (Baldocchi, 2003) with which a footprint of typically a few tens of square metres to a hectare of tundra surface is covered, from which conclu-sions are drawn for a vast area where no measurements ex-ist (Chapin et al., 2000). Hence, the derivation of functional relationships of assimilation and ecosystem respiration rates as a function of environmental drivers bears more potential for providing insights into the overall functioning of Arctic tundra vegetation (Laurila et al., 2001). Simple models using leaf area index (LAI), temperature and photosynthetic pho-ton flux density (Shaver et al., 2007, 2013) have been shown to make reliable predictions of measured net ecosystem ex-change (NEE) and its components at the plot scale (≤1 m2)
in the Arctic tundra. Model parameters can then be examined for differences among sites related to differences in climatic and environmental conditions (Laurila et al., 2001; Williams et al., 2006).
Most Arctic tundra sites are characterized by small emis-sions of CO2during winter (Fahnestock et al., 1999; Jones
et al., 1999) and by high uptake during the short growing season, which is often less than 100 days. Despite being short, the growing season has been shown to be most rele-vant in defining the spatial (Aurela et al., 2004; Kwon et al., 2006; Lund et al., 2010) and temporal variability (Griffis et al., 2000; Groendahl et al., 2007; Lund et al., 2012) in net ecosystem C budgets of Arctic tundra. During this period, there is a net uptake of CO2 from the atmosphere, which
is characterized by a seasonal trend, peaking shortly after midsummer, i.e. July (Groendahl et al., 2007). In the Arctic tundra, peak season coincides with maximum air tempera-ture leading to the highest plant growth rates. Consequently, plants reach their maximum leaf area towards the end of that period. It should be noted that light is not a limiting factor to plant growth (Oberbauer et al., 1998) as the sun does not set during peak season. However, this complicates the accurate determination of ecosystem respiration with the EC approach (Eugster et al., 2005) in the absence of dark nights. The light response approach circumvents this problem (Gilmanov et al., 2003) by only using daytime data. Therefore, the light response method used with peak season EC flux measure-ments from available long-term sites in the Arctic seems the best approach associated with EC to increase our understand-ing of how net CO2exchange and its gross components of
assimilation and ecosystem respiration differ among tundra ecosystems. This study is the first to compare peak season NEE–irradiance characteristics at the landscape scale across different tundra types covering the entire circumpolar Arctic. We hypothesized that(1) light response curve (LRC) param-eters can be used to predict NEE dynamics across the Arctic tundra; (2) vegetation properties, e.g. LAI and normalized difference vegetation index (NDVI), temperature and peak season phenology (start date) are the main drivers of Arctic tundra’s NEE dynamics; (3) variability in Arctic tundra LRC characteristics follows a temperature and latitudinal gradient.
2 Materials and methods
2.1 Site description
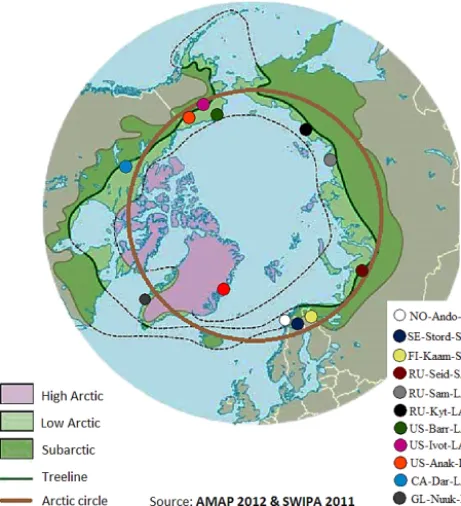
This study focuses on some of the most common types of tundra ecosystems across the circumpolar Arctic ranging from 64 to 74◦N; including three Alaskan sites
Figure 1. Location of study sites in a circumpolar context; classifi-cation according to Arctic floristic boundaries (AMAP, 1998).
Stordalen and Zack for Zackenberg), and abbreviated Arc-tic tundra type (e.g. SA for SubarcArc-tic, LA for Low ArcArc-tic and HA for High Arctic). A detailed site description can be found in Table 1. Figure 1 illustrates site locations and Arctic floristic boundaries (AMAP, 1998).
2.2 Data sets
The analyses in this study are based on EC measurements of NEE of CO2alongside environmental variables.
Environ-mental variables include photosynthetic photon flux density (PPFD), temperature (air and soil), soil moisture, precipita-tion and radiaprecipita-tion (net and global). The length and range of measurements vary among sites from year-round measure-ments to summer campaigns at the most inaccessible sites.
Various instruments for EC measurements have been used across the sites in this study, including analysers such as the open-path LI-7500 (LiCor Inc., USA), closed-path LI-6262 and LI-7000 (LiCor Inc., USA), and the open-path IRGA de-signed by NOAA’s Atmospheric Turbulence and Diffusion Division (ATDD). In this study, we have only examined peak season data, a period during which snow and moisture ob-structions of the infrared path, as well as the surface self-heating issue (Burba et al., 2008) on open path systems, are expected to be either minimal or inexistent. Wind ve-locity and temperature has been measured using 3-D sonic anemometers (R2 and R3, Gill Instruments, UK; CSAT3, Campbell Sci., UK; and SWS-211, Applied Technologies). The frequency of CO2flux signal measurements ranged from
5 to 20 Hz depending on the site. Varying data collection fquency between 5 and 10 Hz did not significantly affect re-sulting fluxes in Kytalyk (van der Molen et al., 2007). With the exception of Samoylov Island, with 1-hourly averaged flux data, all sites have averaged flux data into 30 minute averages. Quantum sensors (Models Li-190SA, Li-190SB and Li-190SZ, LiCor Inc., USA) have been used to measure PPFD (unit: µmol m−2s−1). For Kytalyk, where there were no direct PPFD measurements, estimates were made from global incoming radiation assuming a linear relationship (Ja-covides et al., 2003). Table 1 summarizes ecosystem charac-teristics and EC instrumentation and setup across sites in this study.
Raw data from the EC systems have been processed us-ing standard procedures (Aubinet et al., 2000; Baldocchi et al., 2001). It is imperative that standardized post-processing procedures are used so as to avoid bias introduced by dif-ferent flux correction approaches (Lund et al., 2010). De-tails of the EC post-processing corrections are found in the relevant publications for each site: US-Anak-LA (Rocha and Shaver, 2011), US-Barr-LA and US-Ivot-LA (Kwon et al., 2006), CA-Dar-LA (Lafleur and Humphreys, 2008), FI-Kaam-SA (Aurela et al., 2001), RU-Kyt-LA (Parmentier et al., 2011), NO-Ando-SA, GL-Nuuk-LA and GL-Zack-HA (Lund et al., 2012), RU-Sam-LA (Kutzbach et al., 2007; Run-kle et al., 2013), RU-Seid-SA (Marushchak et al., 2013), and SE-Stord-SA (Christensen et al., 2012).
2.3 Data analyses
Growing season was calculated as the period from the first to the last day of net daily uptake of CO2. We split each growing
season into 14-day segments and carried out LRC analyses on these segments, using the Misterlich function (Falge et al., 2001):
NEE= −(Fcsat+Rd)(1−e
−α(PPFD)
Fcsat+Rd)+Rd. (1)
This function has three parameters (Fcsat,α,Rd) that were
obtained via least-squares fitting in Matlab R2010 (The Mathworks Inc., USA) to observed daytime (PPFD > 10 µmol m−2s−1)values of NEE (µmol m−2s−1), using PPFD (µmol m−2s−1) as the single environmental driving vari-able. The flux at light saturation (Fcsat) parameter is the
maximum net CO2 uptake – i.e. when further increases in
PPFD do not affect the uptake of CO2by the vegetation (in
µmol m−2s−1). The parameter R
d illustrates dark
respira-tion, i.e. the CO2 flux when PPFD equals 0 (also given in
µmol m−2s−1). Light use efficiency, also known as quantum yield (α), is the initial rate of change in NEE with increas-ing PPFD. Other functional parameters examined include the flux when PPFD equals 1000 in µmol m−2s−1(Fc1000);
po-tential photosynthesis at light saturation (Psat), calculated as Fcsat+Rd; and the light compensation point (LCP),
source to a net sink (PPFD when NEE=0 µmol m−2s−1).
Appendix Fig. B1a–e illustrate the parameterization of LRC using Eq. (1). The 14-day period with maximumFcsatis
here-after referred to as the peak season. This period is character-ized by maximum light levels as the sun never sets below the horizon. Also, vegetation is at its peak (maximum NDVI and LAI) with highest plant growth rates coinciding with maxi-mum air temperatures.
The LRC parameters were then compared among sites to identify the variability of the Arctic tundra. This approach is advantageous for inter-site comparisons because sites can readily be compared irrespective of varying meteorological conditions (Laurila et al., 2001). The Misterlich function (Falge et al., 2001) is ideal for such a comparison as it as-sumes a more realistic upper limit for NEE, with a clearly defined value at high PPFD and a stronger curvature than the rectangular hyperbola (Appendix Fig. B2).
For comparison with other studies, we have used results from previous studies that compared Greenland, Finland, Norway and Sweden (Frolking et al., 1998; Laurila et al., 2001). These studies used a rectangular hyperbolic function: NEE= α2·PPFD·Pmax
α2·PPFD+Pmax
+R. (2)
The resulting parameter Pmax refers to potential
photosyn-thesis at light saturation, R is dark respiration, while α2 is
the initial slope of the light response curve or light use effi-ciency. The parametersRdandαfrom Eq. (1) are comparable
toRandα2from Eq. (2), respectively (Appendix Fig. B2),
whereasPmaxfrom Eq. (2) consistently shows more negative
values than Psat (Appendix Fig. B3), due to an unrealistic
increase in NEE (in absolute terms) at high light levels in Eq. (2) (Appendix Fig. B2).
For sites with multi-year data, LRC parameters and an-cillary variables were averaged for corresponding peak peri-ods and error bars indicate standard deviations among site years. In order to investigate the drivers of variability in peak season LRC parameters across the Arctic, regression analyses with phenological variables – such as growing sea-son start, growing seasea-son length and peak seasea-son start – were performed using the linear regression tool in IBM SPSS Statistics 20. Mean environmental variables for July – e.g. air and soil temperature, soil moisture, vapour pres-sure deficit (VPD), relative humidity, incoming and outgoing short-wave radiation, net radiation, precipitation and PPFD – were also examined for significant relationship to LRC pa-rameters. Maximum LAI was extracted from referenced lit-erature (Lafleur et al., 2012; Laurila et al., 2001; Lund et al., 2010; Marushchak et al., 2013), while NDVI data were re-trieved from MODIS Land Product Subsets (http://daac.ornl. gov/MODIS/) as 250 m×250 m pixels in the dominant wind direction and within the footprint of the flux tower. The coef-ficient of variation (CV), calculated by dividing the standard deviation by the mean, has been used to compare the vari-ation among LRC parameters across the Arctic. Curve
esti-mation and regression analysis was done using analyses of variance (ANOVA) for linear relationships using the curve estimation tool (IBM SPSS Statistics 20). Multiple linear re-gressions (step-wise) were used to investigate the combined control of environmental variables on LRC parameters using the linear regression tool (IBM SPSS Statistics 20).
3 Results and discussion
A multiple linear regression using maximum LAI and July air temperature as independent variables was found to strongly explain plant growth across 12 Arctic tundra sites as expressed by the assimilation parameters (Psat, Fc1000,
andFcsat) of the LRC (Table 2). A maximum of 93 % of
the variability inFc1000could be explained, and similar
per-formance of the model was found forFcsat(92 %) andPsat,
(90 %). Shaver et al. (2013) developed a model for predict-ing NEE based on short-term small-scale chamber flux mea-surements (≤1 m2)from various ecosystem types within five Arctic sites (including US-Barr-LA, SE-Stord-SA and GL-Zack-HA in this study) using LAI (estimated from NDVI), air temperature and PPFD. Their model explained ca. 75 % of the variation in NEE across Arctic ecosystems. The main advantage of using landscape-scale EC data compared with plot-scale chamber data is that EC data integrate fluxes over a larger area, which thus makes the data more readily compa-rable with satellite-derived information. Despite differences in scale and model parameterizations, our results confirm the findings of Shaver et al. (2013) on the great potential in us-ing LAI, NDVI, air temperature and irradiance for upscalus-ing Arctic CO2exchange.
Maximum LAI explained 70–75 % (Fig. 2, Table 2) of the assimilation parameters, suggesting that direct measure-ments of leaf area could be useful in estimating photosyn-thesis from tundra ecosystems. Satellite-derived LAI has also been shown to significantly explain photosynthesis in the Alaskan Arctic (Ueyama et al., 2013). Remotely sensed NDVI was not quite as powerful in explaining plant growth; NDVI explained 59–67 % of the variance in assimilation pa-rameters (Fig. 3, Table 2). Generally, LAI exerted stronger controls on LRC parameters than NDVI (Figs. 2–3). Using LAI is advantageous as it is a real and physical vegetation property, directly measured through plot sampling and shown to be directly linked to C exchange, while NDVI is a surro-gate vegetation property often used to estimate LAI (Shaver et al., 2007, 2013). In our study, LAI data were available for only 9 sites as opposed to 12 for NDVI. Given the dif-ferences in measurement methodology and instrumentations, comparing LAI between sites may introduce uncertainty in the estimates. LAI used herein is for vascular plant cover only (Ross, 1981), thereby ignoring non-vascular plants like mosses, which are known to contribute significantly to Arc-tic ecosystem CO2 exchange (Street et al., 2012).
Table 2. Linear regressions between variables (environmental and vegetation properties) and LRC parameters: goodness of fit (r2), slope and level of significance (p <0.1).
Variables LRC parameter Slope r2 p N
Maximum leaf Fcsat −2.4 and−0.2 0.92 0.001 9
area index (LAI) Rd – – – 9
and July air α – – – 9
temperature Psat −3.3 and−0.4 0.90 0.003 9
Fc1000 −2.3 and−0.3 0.93 0.001 9
LCP – – – 9
Maximum leaf Fcsat −2.8 0.75 0.006 9
area index (LAI) Rd 1.1 0.52 0.042 9
α 0.02 0.61 0.023 9
Psat −3.9 0.70 0.009 9
Fc1000 −2.7 0.73 0.007 9
LCP – – – 9
Normalized difference Fcsat −28.3 0.67 0.001 12
vegetation index (NDVI) Rd 10.4 0.40 0.026 12
α 0.1 0.25 0.09 12
Psat −38.7 0.61 0.003 12
Fc1000 −26.0 0.59 0.004 12
LCP – – – 12
July air Fcsat −0.3 0.32 0.055 12
temperature Rd 0.1 0.26 0.094 12
α – – – 12
Psat −0.4 0.32 0.056 12
Fc1000 −0.3 0.35 0.043 12
LCP – – – 12
Peak season Fcsat – – – 12
PPFD Rd – – – 12
α – – – 12
Psat – – – 12
Fc1000 – – – 12
LCP 0.2 0.52 0.008 12
calculation methods have been used and there is a possibility of upscaling for the whole Arctic tundra as satellite-derived NDVI data are readily available (Loranty et al., 2011). De-spite the shortcomings of LAI and NDVI, they have been shown to satisfactorily estimate gross primary productivity (GPP) (r2=0.78−0.81) in northern Scandinavia and Alaska (Street et al., 2007). In general, all LRC parameters had a sig-nificant, or, in the case ofα, close to significant (p=0.09) relationship with NDVI, illustrating the potential to use Earth observation products for spatial integration.
On its own, temperature was the least significant driver of variations in LRC parameters, explaining only about 32– 35 % ofFcsat,PsatandFc1000(Table 2). Yet, in combination
with LAI, control on assimilation parameters was greatly im-proved (Table 2) as warming increases the productive ca-pacity and leaf area of most plant species (Walker et al., 2003). This could be explained by the fact that higher tem-peratures increase weathering, nitrogen fixation (Sorensen
et al., 2006) and soil organic matter decomposition (Robin-son et al., 1997), thereby increasing soil nutrient availability. There is, therefore, an urgent need for standardized routines for monitoring other aspects that are not covered at several sites across the Arctic tundra like nutrient availability and substrate quality.
It was interesting to notice that mean July air temperature seemed to exert stronger controls onFcsat, Psat andFc1000
(assimilation parameters) than onRd. A steeper slope (0.3–
0.4 µmol CO2m−2s−1K−1)of the temperature vs.
assimi-lation parameter regressions (Table 2) as opposed to tem-perature vs.Rd(0.1 µmol CO2m−2s−1K−1)suggested that
an increase in temperature would cause an increase in net CO2 uptake during peak season for the ecosystems in this
T able 3. Light response curv e parameters ( Fcsat , Rd , α, Psat , Fc1000 , LCP), fitting period and related statistics, and v ariables (en vironmental and v egetation properties) fo r the study sites. Note that assimilation parameters ( Fcsat , Psat , Fc 1000 ) are reported as ne g ati v e v alues so as to demo nstrate that the y represent uptak e from the atmosphere by the ecosystem. Study sites Peak period Fcsat Rd α Psat Fc 1000 LCP July (µmol m − 2s − 1) (µmol m − 2s − 1) (µmo lm − 2s − 1) (µmol m − 2s − 1) (µmol m − 2s − 1) r 2 N ND VI L AI T emperature ( ◦C) R U-Seid-SA 24 July–6 August − 8.0 3.9 0.057 − 11.9 − 7.9 80 0.69 253 0.74 1.85 15.8 FI-Kaam-SA 24 July–6 August ( ± 10 days) − 4.7 ± 0.6 1.7 ± 0.2 0.02 0 ± 0.002 − 6.4 ± 0.7 − 4.4 ± 0.5 100 ± 15 0.91 561 0.69 ± 0.03 0 .70 13.9 ± 0.4 SE-Stord-SA 23 July–5 August ( ± 16 days) − 6.2 ± 1.9 2.0 ± 0.5 0.0 25 ± 0.005 − 8.2 ± 1.9 − 5.7 ± 1.6 97 ± 32 0.79 353 0.68 ± 0.02 > 2 11.8 ± 1.3 NO-Ando-SA 9 July–22 July ( ± 18 days) − 4.0 ± 0.4 1.1 ± 0.1 0.0 18 ± 0.005 − 5.2 ± 0.3 − 3.9 ± 0.4 73 ± 18 0.77 373 0.70 ± 0.06 – 10.9 ± 0.7 US-Anak-LA 12 July–25 July ( ± 8 days) − 4.6 ± 0.3 1.2 ± 0.4 0.0 17 ± 0.005 − 5.7 ± 0.3 − 4.2 ± 0.3 77 ± 10 0.51 296 0.68 ± 0.02 – 15.8 ± 1.0 CA-Dar -LA 9 July–22 July ( ± 16 days) − 3.3 ± 0.5 1.0 ± 0.1 0.0 12 ± 0.002 − 4.4 ± 0.5 − 3.0 ± 0.3 102 ± 10 0.73 428 0.60 ± 0.01 0.70 12.4 ± 1.5 US-Iv ot-LA 23 July–5 August ( ± 4 days) − 4.7 ± 0.9 1.2 ± 0.5 0.0 12 ± 0.011 − 5.9 ± 0.4 − 3.1 ± 1.2 156 ± 87 0.73 582 0.71 ± 0.03 0.71 12.2 ± 2.9 R U-K yt-LA 24 July – 6 August ( ± 10 days) − 5.4 ± 0.8 1.6 ± 0.6 0.0 20 ± 0.006 − 7.0 ± 1.1 − 4.9 ± 0.8 91 ± 20 0.78 463 0.68 ± 0.03 0.78 10.6 ± 3.2 GL-Nuuk-LA 30 June – 13 July ( ± 17 days) − 4.0 ± 0.7 1.8 ± 0.5 0. 019 ± 0.003 − 5.8 ± 0.9 − 3.8 ± 0.5 111 ± 22 0.74 363 0.67 ± 0.01 − 10.1 ± 0.2 R U-Sam-LA 30 July–12 August ( ± 13 days) − 1.7 ± 0.3 0.6 ± 0.3 0. 013 ± 0.001 − 2.3 ± 0.6 − 1.7 ± 0.3 53 ± 26 0.59 246 0.62 ± 0.05 0.30 9.2 ± 0.1 US-Barr -LA 25 July–07 August ( ± 8 days) − 4.4 ± 1.4 1.2 ± 0.5 0. 035 ± 0.031 − 5.6 ± 1.9 − 3.6 ± 1.2 50 ± 25 0.42 569 0.63 1.5 4.7 ± 1.0 GL-Zack-HA 17 July–30 July ( ± 9 days) − 1.6 ± 0.2 1.0 ± 0.3 0. 011 ± 0.003 − 2.6 ± 0.4 − 1.5 ± 0.2 113 ± 19 0.67 407 0.56 ± 0.05 0.30 6.6 ± 1.2 Coef ficient of v ariation (CV): 0.3 9 0.52 0.58 0.41 0.42 0.3 0.18 0.28 0.07 0.63 0.29
Figure 2. Relationships between maximum LAI and (a) light saturation NEE,Fcsat; (b) dark respiration, Rd; (c) rate of
car-bon assimilation with initial increase in light, α; (d) potential photosynthesis at light saturation, Psat; (e) NEE when PPFD
is 1000 µmol m−2s−1, Fc1000 and (f) light compensation point
(LCP). Red line represents linear fit between maximum LAI and LRC parameters while error bars are standard deviations.
tend to undergo different degrees of acclimation to some en-vironmental variables. Ecosystems acclimate to warmer tem-perature by increasing the thermal optimum for their contin-ued survival (Niu et al., 2012). Previous studies have shown a strong and independent thermal acclimation of photosyn-thesis (Baldocchi, 2001, 2008; Mooney et al., 1978; Niu et al., 2008), leaf and ecosystem respiration (Baldocchi, 2008; Centritto et al., 2011; Ow et al., 2008a, b) and NEE (Yuan et al., 2011) at the level of the ecosystem. Short-term monitor-ing in the High Arctic has suggested that photosynthesis and ecosystem respiration (Lund et al., 2012; Oechel et al., 2000) have increased with observed changes in climate, while NEE trends remain unclear (Lund et al., 2012).
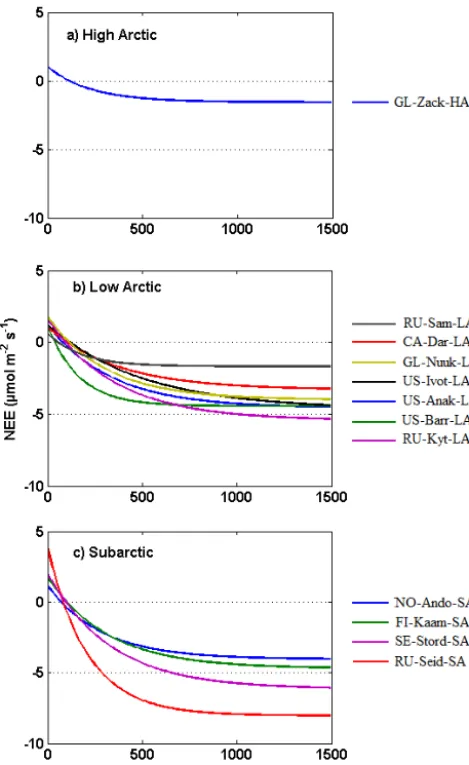
We have identified that there is a large circumpolar vari-ability in the light response and LRC parameters within the Arctic tundra. This is reflected in the varying shapes of LRC among the sites (Fig. 4a–c), suggesting that Arc-tic tundra ecosystems are diverse and should not be treated as a single entity. We originally had expected that respira-tion rates from the generally waterlogged active layers typ-ical of tundra ecosystems should respond more clearly and positively to temperatures. But the dark respiration (Rd) did
Figure 3. Relationships between peak season NDVI and (a) light saturation NEE, Fcsat; (b) dark respiration, Rd; (c) rate of
car-bon assimilation with initial increase in light, α; (d) potential photosynthesis at light saturation, Psat; (e) NEE when PPFD
is 1000 µmol m−2s−1, Fc1000 and (f) light compensation point
(LCP). Red line represents linear fit between peak season NDVI and LRC parameters while error bars are standard deviations.
The correlations between Rd and vegetation indices (LAI
and NDVI) were significant (Figs. 2b–3b; Table 2); how-ever, the relationships were weaker compared to those ob-served for assimilation parameters (Figs. 2–3a, d, e; Ta-ble 2). Previous research has shown that Arctic plants vary in their light responses and rates of photosynthesis (Bigger and Oechel, 1982; Chapin and Shaver, 1996; Oberbauer and Oechel, 1989). Similarly, a high inter-site variability of sum-mertime NEE has been documented in another comparison study (Lund et al., 2010) on northern wetlands in northern Europe and North America. This is contrary to quantified variability in seven Canadian sites (Humphreys et al., 2006), where the rates of peak season NEE were comparable.
Though all sites attained peak productivity in July (Ta-ble 3), a regression analysis showed that the variability was unrelated to the start of the peak season and did not reveal any latitudinal dependency. Interestingly, the largest differences among LRC curves within the Low Arctic were seen between RU-Sam-LA and RU-Kyt-LA (Fig. 4b; Table 1). This may mean that geographical proximity and similar latitude are not the key factors that explain tundra ecosystem CO2fluxes.
An examination of the CV showed that the assimilation pa-rameters (Fcsat,Fc1000andPsat)were less variable thanRd
[image:8.612.309.546.65.352.2](Table 3) among study sites. This suggested that ecosystem
Figure 4. Light response curves across the Arctic tundra, (a) High Arctic sites, (b) Low Arctic sites, (c) Subarctic sites; classification according to Arctic floristic boundaries (AMAP, 1998)
respiration is a stronger driver of CO2flux variability in the
Arctic tundra during peak season than the assimilation pa-rameters. Yet comparable variability in photosynthesis and ecosystem respiration was found in seven Canadian Boreal peatlands (Humphreys et al., 2006) during peak season while in northern wetlands (Lund et al., 2010) and Canadian tun-dra (Lafleur et al., 2012) ecosystems, variability in NEE was driven mainly by photosynthesis. This may be because our study is comprised of a wide range of climate and ecosystem settings as opposed to northern wetlands (Lund et al., 2010) and the Canadian Boreal peatlands (Humphreys et al., 2006) and the Canadian tundra (Lafleur et al., 2012).
The LCP is the light level at which the amount of CO2
released through ecosystem respiration equals the amount taken up by plants through photosynthesis. This varies in re-sponse to a different vegetation composition and light condi-tions (Givnish, 1988; Givnish et al., 2004). Photosynthetic CO2 assimilation also depends on Ribulose 1,5
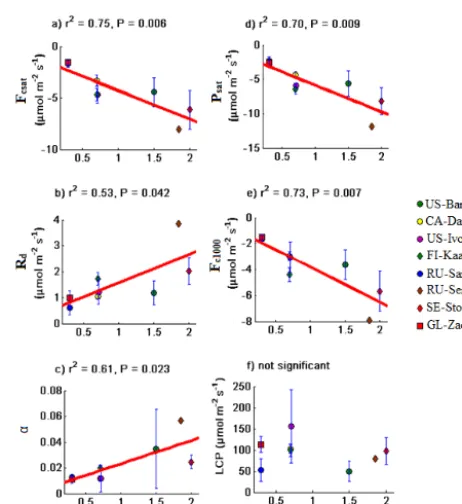
Figure 5. Variability in LRC parameters among Arctic tundra sites. (a) Flux at light saturation (Fcsat); (b) dark respiration (Rd); (c)
ini-tial light use efficiency (α); (d) potenini-tial photosynthesis at light sat-uration (Psat); (e) flux when PPFD=1000 µmol m−2s−1(Fc1000);
and (f) light compensation point (LCP). Illustrated according to mean July temperature in different tundra types.
[image:9.612.52.287.66.449.2]the estimated (33 µmol m−2s−1)rate for a temperate peat-land (Shurpali et al., 1995) but within the estimated rates for Sphagnum-dominated tundra ecosystems in the Low Arc-tic, 10–140 µmol m−2s−1Skre and Oechel, 1981). Previous studies have shown LCP to be lower for shade-grown than for sun-grown vegetation even when there is no significant dif-ference in their photosynthetic parameters (Björkman et al., 1972; Givnish, 1988). This suggests that LCP may have no control on the C gain/loss of the ecosystem. Givnish (1988) therefore proposed that, for the compensation point to be meaningful, other vegetation costs related to night-time leaf respiration, growth of plant stems, leaves and roots must be considered (effective compensation point).
Figure 6. Averaged peak season PPFD (light) control on light com-pensation point (LCP) parameter.r2=0.5,p=0.008.
Variability in local weather conditions has been shown to be largely responsible for between-year fluctuations in CO2flux components of northern ecosystems (Groendahl et
al., 2007; Lafleur and Humphreys, 2008; Lund et al., 2010, 2012). In this study, for example, RU-Seid-SA consistently had the highest rates of LRC parameters (Fig. 5; Table 3); however, this was based on one single year of data (2008). Though 3–5◦C warmer than the long-term July mean, 2008 July temperatures were lower than 2007 (Marushchak et al., 2013). Thus, we have further examined peak season for sites with available 2008 data (RU-Seid-SA, SE-Stord-SA, NO-Ando-SA, US-Anak-LA, RU-Kyt-LA, GL-Nuuk-LA, and GL-Zack-HA) to investigate whether the outlier was the year (2008) or the site (RU-Seid-SA). Mean July temperature was higher than average in RU-Seid-SA, US-Anak-LA and SE-Stord-SA but RU-Seid-SA was most extreme with a July temperature significantly higher than the mean (> 1 SD, Ap-pendix Table A2). This was further emphasized as RU-Seid-SA was consistently higher (> 1 SD) above the mean for 2008 in terms of LRC parameters. The high Fcsat andα during
the peak season in RU-Seid-SA illustrates the high photo-synthetic capacity of this site but perhaps more interesting was the highRdfor this site, which considerably diminishes
its sink function and reiterates the importance of soil charac-teristics.
Previous studies have used hyperbolic relationships be-tween NEE and PPFD to estimate comparable parameters among sites (Frolking et al., 1998; Laurila et al., 2001; Ruimy et al., 1995). Though they used another function, Eq. (2),R andα2have been shown to be comparable with Rdandαfrom Eq. (1) in this study (Appendix Fig. B2). The
apparent quantum yield parameter (α2, the initial slope of
peatlands (ca. 0.044 for fens; and ca. 0.031 for bogs). Esti-mates from fen sites (Laurila et al., 2001) were comparable to estimates from wet sites in our study while the estimates for bogs (Frolking et al., 1998) were higher than observed in SA (Table 3). This could be because NO-Ando-SA is more northerly situated and thus colder compared with sites in Frolking et al. (1998). Dark respiration was esti-mated to be between 4.0 to 6.6 µmol m−2s−1 for fens and 2.2 µmol m−2s−1 (Frolking et al., 1998) at a Swedish bog. These are higher than estimated in our study because our sites were located at higher latitudes (64–74◦N), with as-sociated lower summer temperatures, compared to 43◦N to 56◦N (Frolking et al., 1998). Dark respiration estimates from the only High Arctic site in our study (GL-Zack-HA) was similar to estimates from the same site based on earlier data from 1997 (Laurila et al., 2001) and at a nearby willow snow bed (0.9 µmol m−2s−1), while a higher value was obtained
from a nearby fen (2.3 µmol m−2s−1); all three sites being
located within ca. 1 km of each other (Laurila et al., 2001), again demonstrating the heterogeneity of Arctic landscapes.
The possibility of explaining and modelling the variation of CO2exchange components based on controlling
environ-mental drivers is essential to improve our understanding of current CO2 exchange, and to better simulate the response
of Arctic tundra to an expected change in climate (Lund et al., 2010). In follow-up studies, it is intended to model and upscale LRC parameters using the functional relationships with LAI, NDVI and air temperature across the Arctic tundra. Arctic vegetation data (e.g. LAI and NDVI) will be retrieved through remote sensing data, e.g. the MODIS Land Product Subsets and circumpolar Arctic vegetation maps (CAVMs; Walker et al., 2005) while climate data can be retrieved from global grid data sets such as Climatic Research Unit (CRU; New et al., 2002). Detangling the effects of a changing cli-mate and reducing the level of uncertainties in the Arctic C balance estimations remains a highly prioritized topic for climate research. Combining increased monitoring activities and process-based studies using remote sensing tools and mechanistic modelling serves as the most plausible way for-ward to improve our understanding of the Arctic and global C cycle.
4 Conclusions
We have shown that LRC parameterization could be used successfully to predict NEE dynamics in the Arctic tundra. Though peak season phenology could not explain CO2
ex-change dynamics, a combination of vegetation properties (LAI) and temperature showed a strong positive relation-ship with assimilation parameters. Individual environmen-tal variables were not as good in explaining variability in LRC parameters, especially respiration parameters, suggest-ing that these physiological parameters may acclimate to warmer temperatures. Also, some factors that are typically not included in EC CO2 exchange studies (such as
nutri-ent availability and substrate quantity and quality of soil or-ganic matter) could be instrumental in explaining the spatial variability in CO2 fluxes among Arctic tundra ecosystems.
Appendix A
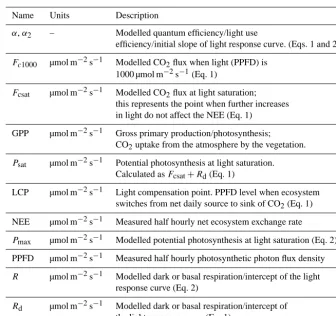
Table A1. List of symbols.
Name Units Description
α,α2 – Modelled quantum efficiency/light use
efficiency/initial slope of light response curve. (Eqs. 1 and 2)
Fc1000 µmol m−2s−1 Modelled CO2flux when light (PPFD) is
1000 µmol m−2s−1(Eq. 1)
Fcsat µmol m−2s−1 Modelled CO2flux at light saturation;
this represents the point when further increases in light do not affect the NEE (Eq. 1)
GPP µmol m−2s−1 Gross primary production/photosynthesis;
CO2uptake from the atmosphere by the vegetation.
Psat µmol m−2s−1 Potential photosynthesis at light saturation.
Calculated asFcsat+Rd(Eq. 1)
LCP µmol m−2s−1 Light compensation point. PPFD level when ecosystem switches from net daily source to sink of CO2(Eq. 1)
NEE µmol m−2s−1 Measured half hourly net ecosystem exchange rate
Pmax µmol m−2s−1 Modelled potential photosynthesis at light saturation (Eq. 2)
PPFD µmol m−2s−1 Measured half hourly photosynthetic photon flux density
R µmol m−2s−1 Modelled dark or basal respiration/intercept of the light response curve (Eq. 2)
Rd µmol m−2s−1 Modelled dark or basal respiration/intercept of
the light response curve (Eq. 1)
Table A2. Light response curve (LRC) parameters for peak period in 2008.
Study sites 2008 peak period Fcsat Rd α Psat Fc1000 r2 N Jul 2008
(µmol m−2s−1) (µmol m−2s−1) (µmol m−2s−1) (µmol m−2s−1) temperature (◦C)
US-Anak-LA 16 July–29 July −4.4 1.4 0.018 −5.8 −4.2 0.50 243 11.7
NO-Ando-SA 31 June–13 July −3.5 1.2 0.014 −4.7 −3.3 0.82 470 10.5
RU-Kyt-LA 7 August–20 August −6.1 1.6 0.016 −7.7 −5.2 0.75 484 8.4
GL-Nuuk-LA 6 July–19 July −3.8 1.2 0.016 −5.0 −3.6 0.67 346 10.1
RU-Seid-SA 24 July–6 August −8.0 3.9 0.057 −11.9 −7.9 0.69 253 15.8
SE-Stord-SA 25 July–7 August −8.0 1.4 0.022 −9.4 −7.2 0.67 358 11.3
GL-Zack-HA 23 July–5 August −1.7 1.1 0.015 −2.8 −1.7 0.67 327 8.7
[image:11.612.51.546.481.579.2]Appendix B
[image:12.612.339.514.109.262.2]Figure B1. Parameterization of LRC (Eq. 1). Continuous lines show the shape of the light response curves while broken lines illustrate parameters of the light response curves: (a) flux at light saturation; (b) dark respiration (c) initial light use efficiency; (d) NEE when PPFD=1000 µmol m−2s−1and (e) light compensation point.
Figure B2. Comparing Eqs. (1) and (2) using Seida 2008 peak sea-son. The LRC curves suggest that the parametersRdandαfrom
[image:12.612.342.511.459.616.2]Eq. (1) are comparable withRandα2from Eq. (2).
Figure B3. Correlations between Eq. (1) (Falge et al., 2001) and (2) (Ruimy et al., 1995) using photosynthesis at light saturation. Potential photosynthesis at light saturation (Psat) was calculated as
the sum ofFcsatandRdin Eq. (1) (Falge et al., 2001; Lindroth et
al., 2007) and was estimated byPmaxin Eq. (2) (Frolking et al.,
1998; Laurila et al., 2001; Ruimy et al., 1995) based on the 12 sites in this study. Broken line represents the 1:1 line.
Figure B4. Comparing LRC curves for peak period 2008 shows thatFcsatfor RU-Seid-SA may be comparable to SE-Stord-SA but
differs in terms ofαandRd. Also, the LRC for RU-Seid-SA shows
[image:12.612.84.251.497.656.2]Acknowledgements. We would like to thank the two anonymous
reviewers for their valuable comments which were instrumental in improving this paper. We also thank NordForsk for funding the DEFROST project through its Top-Level Research Initiative (TFI), the Nordic Center of Excellence (NCoE), through which this work is partly funded, and Aarhus University’s Graduate School of Science and Technology for the rest of the funding. We are grateful to all the research teams and their funding sources. US-Anak-SA was funded by the National Science Foundation (NSF grant number 1065587); NO-Ando-SA was sponsored by Bioforsk, NILU – Norwegian Institute for Air Research and the Smithsonian Environmental Research Center, with funding from the Research Council of Norway (project NFR208424, GHG-NOR) and the Stiftelsen Fondet for Jord-og Myrundersøkelser; US-Barr-LA and US-Ivot-LA was funded by NSF (OPP-0421588 BE/CBC), NSF (ARC-1204263), Department of Energy, DOE (Terrestrial Carbon Cycle Research DE-SC0005160), the Carbon in Arctic Reservoirs Vulnerability Experiment (CARVE), an Earth Ventures (EV-1) investigation, under contract with the National Aeronautics and Space Administration (NASA); CA-Dar-LA was sponsored by the Natural Science and Engineering Research Council of Canada (NSERC); FI-Kaam-SA was funded by the European Commission (ENV4-CT95-0093) and the Academy of Finland; RU-Kyt-LA was supported by the Research Council for Earth and Life Sciences (ALW) with financial aid from the Netherlands Organization for Scientific Research (NWO, grant no. 854.00.018), the Darwin Center for Biogeology of ALW/NWO, the European Commission under the Fifth Framework Programme TCOS-Siberia (EVK2-2001-00143), the NWO Dutch Russian research cooper-ation programme entitled “Long term observcooper-ation of soil carbon and methane fluxes in Siberian tundra” (047.017.037), the Green-CyclesII training network (7th Framework programme reference 238366) and Darwin Center for Biogeosciences who supported with a grant to F. J. W. Parmentier (142.16.1041); monitoring in GL-Nuuk-SA and GL-Zack-HA was through the GeoBasis and ClimateBasis programs of the Nuuk and Zackenberg Ecological Research Operations (NERO and ZERO) networks funded by the Danish Energy Agency; RU-Sam-LA and Torsten Sachs was supported through the Helmholtz Association (Helmholtz Young Investigators Group, grant VH-NG-821); RU-Seid-SA was funded by the EU 6th Framework Programme project CARBO-North (contract number 036993; www.carbonorth.net) and SE-Stord-SA was supported by the EU funded GREENCYCLES-RTN, Swedish Research Councils VR and FORMAS, the Danish Natural Science Research Council as well as the Crafoord Foundation and the Royal Swedish Physiographical Society. We are also very grateful to all who have assisted in the collection of data for these study sites.
Edited by: S. M. Noe
References
ACIA: Arctic Climate Impact Assessment-Scientific Report, 1st edn., New York, 2005.
AMAP: AMAP Assessment Report: Arctic Pollution Issues, Arc-tic Monitoring and Assessment Programme (AMAP), Oslo, Nor-way, 859 pp., 1998.
Aubinet, M., Grelle, A., Ibrom, A., Rannik, U., Moncrieff, J., Fo-ken, T., Kowalski, A. S., Martin, P. H., Berbigier, P., Bern-hofer, C., Clement, R., Elbers, J., Granier, A., Grunwald, T., Mor-genstern, K., Pilegaard, K., Rebmann, C., Snijders, W., Valen-tini, R., and Vesala, T.: Estimates of the annual net carbon and water exchange of forests: the EUROFLUX methodology, Adv. Ecol. Res., 30, 113–175, 2000.
Aurela, M., Laurila, T., and Tuovinen, J. P.: Seasonal CO2balances
of a subarctic mire, J. Geophys. Res.-Atmos., 106, 1623–1637, 2001.
Aurela, M., Laurila, T., and Tuovinen, J. P.: The timing of snow melt controls the annual CO2 balance in a subarctic fen, Geophys. Res. Lett., 31, L16119, doi:10.1029/2004GL020315, 2004. Baldocchi, D.: Breathing of the terrestrial biosphere: lessons
learned from a global network of carbon dioxide flux measure-ment systems, Aust. J. Bot., 56, 1–26, 2008.
Baldocchi, D. D.: Assessing the eddy covariance technique for evaluating carbon dioxide exchange rates of ecosystems: past, present and future, Glob. Change Biol., 9, 479–492, 2003. Baldocchi, D. D., Falge, E., Gu, L. H., Olson, R., Hollinger, D.,
Running, S., Anthoni, P., Bernhofer, C., Davis, K., Evans, R., Fuentes, J., Goldstein, A., Katul, G., Law, B., Lee, X. H., Malhi, Y., Meyers, T., Munger, W., Oechel, W., U, K. T. P., Pi-legaard, K., Schmid, H. P., Valentini, R., Verma, S., Vesala, T., Wilson, K., and Wofsy, S.: FLUXNET: a new tool to study the temporal and spatial variability of ecosystem-scale carbon diox-ide, water vapor, and energy flux densities, B. Am. Meteorol. Soc., 82, 2415–2434, 2001.
Bigger, C. M. and Oechel, W. C.: Nutrient effect on maximum pho-tosynthesis in Arctic plants, Holarctic Ecol., 5, 158–163, 1982. Björkman, O., Boardman, N. K., Anderson, J. M., Thorne, S. W.,
Goodchild, D. J., and Pyliotis, N. A.: Effect of light intensity during growth of Atriplex patula on the capacity of photosyn-thetic reactions, chloroplast components and structure, Carnegie I. Wash., 115–135, 1972.
Burba, G. G., McDermitt, D. K., Grelle, A., Anderson, D. J., and Xu, L. K.: Addressing the influence of instrument surface heat exchange on the measurements of CO2flux from open-path gas
analyzers, Glob. Change Biol., 14, 1854–1876, 2008.
Centritto, M., Brilli, F., Fodale, R., and Loreto, F.: Different sen-sitivity of isoprene emission, respiration and photosynthesis to high growth temperature coupled with drought stress in black poplar (Populus nigra) saplings, Tree Physiol., 31, 275–286, 2011.
Chapin, F. S. and Shaver, G. R.: Physiological and growth responses of arctic plants to a field experiment simulating climatic change, Ecology, 77, 822–840, 1996.
Chapin, F. S., Eugster, W., McFadden, J. P., Lynch, A. H., and Walker, D. A.: Summer differences among Arctic ecosystems in regional climate forcing, J. Climate, 13, 2002–2010, 2000. Christensen, T. R., Jackowicz-Korczynski, M., Aurela, M., Crill, P.,
multi-year carbon balance of a subarctic palsa mire with microm-eteorological techniques, Ambio, 41, 207–217, 2012.
Eugster, W., McFadden, J. P., and Chapin, F. S.: Differences in sur-face roughness, energy, and CO2fluxes in two moist tundra
veg-etation types, Kuparuk watershed, Alaska, USA, Arct. Antarct. Alp. Res., 37, 61–67, 2005.
Fahnestock, J. T., Jones, M. H., and Welker, J. M.: Wintertime CO2
efflux from arctic soils: implications for annual carbon budgets, Global Biogeochem. Cy., 13, 775–779, 1999.
Falge, E., Baldocchi, D., Olson, R., Anthoni, P., Aubinet, M., Bern-hofer, C., Burba, G., Ceulemans, R., Clement, R., Dolman, H., Granier, A., Gross, P., Grunwald, T., Hollinger, D., Jensen, N. O., Katul, G., Keronen, P., Kowalski, A., Lai, C. T., Law, B. E., Mey-ers, T., Moncrieff, H., Moors, E., Munger, J. W., Pilegaard, K., Rannik, U., Rebmann, C., Suyker, A., Tenhunen, J., Tu, K., Verma, S., Vesala, T., Wilson, K., and Wofsy, S.: Gap filling strategies for defensible annual sums of net ecosystem exchange, Agr. Forest Meteorol., 107, 43–69, 2001.
Frolking, S. E., Bubier, J. L., Moore, T. R., Ball, T., Bellis-ario, L. M., Bhardwaj, A., Carroll, P., Crill, P. M., Lafleur, P. M., McCaughey, J. H., Roulet, N. T., Suyker, A. E., Verma, S. B., Waddington, J. M., and Whiting, G. J.: Relationship between ecosystem productivity and photosynthetically active radiation for northern peatlands, Global Biogeochem. Cy., 12, 115–126, 1998.
Gilmanov, T. G., Verma, S. B., Sims, P. L., Meyers, T. P., Bradford, J. A., Burba, G. G., and Suyker, A. E.: Gross primary production and light response parameters of four Southern Plains ecosystems estimated using long-term CO2
-flux tower measurements, Global Biogeochem. Cy., 17, 1071, doi:10.1029/2002GB002023, 2003.
Givnish, T. J.: Adaptation to sun and shade – a whole-plant perspec-tive, Aust. J. Plant Physiol., 15, 63–92, 1988.
Givnish, T. J., Montgomery, R. A., Goldstein, G.: Adaptive radi-ation of photosynthetic physiology in the Hawaiian lobeliads: Light regimes, static light responses, and whole-plant compen-sation points, Am. J. Botany, 91, 228–246, 2004.
Griffis, T. J., Rouse, W. R., Waddington, J. M.: Interannual vari-ability of net ecosystem CO2exchange at a subarcticfen, Glob.
Biogeo. Cy., 14, 1109–1121, 2000.
Groendahl, L., Friborg, T., and Soegaard, H.: Temperature and snow-melt controls on interannual variability in carbon exchange in the high Arctic, Theo. Appl. Climatol., 88, 111–125, 2007. Hugelius, G., Bockheim, J. G., Camill, P., Elberling, B., Grosse, G.,
Harden, J. W., Johnson, K., Jorgenson, T., Koven, C. D., Kuhry, P., Michaelson, G., Mishra, U., Palmtag, J., Ping, C.-L., O’Donnell, J., Schirrmeister, L., Schuur, E. A. G., Sheng, Y., Smith, L. C., Strauss, J., and Yu, Z.: A new data set for estimating organic carbon storage to 3 m depth in soils of the northern cir-cumpolar permafrost region, Earth Syst. Sci. Data, 5, 393–402, doi:10.5194/essd-5-393-2013, 2013.
Humphreys, E. R., Lafleur, P. M., Flanagan, L. B., Hed-strom, N., Syed, K. H., Glenn, A. J., and Granger, R.: Sum-mer carbon dioxide and water vapor fluxes across a range of northern peatlands, J. Geophys. Res.-Biogeo., 111, G04011, doi:10.1029/2005JG000111, 2006.
IPCC: Summary for policymakers, in: Climate Change 2013: The Physical Science Basis. Contribution of Working Group I to the Fifth Assessment Report of the Intergovernmental Panel on
Cli-mate Change, edited by: Stocker, T. F., Qin, D., Plattner, G.-K., Tignor, M., Allen, S. G.-K., Boschung, J., Nauels, A., Xia, Y., Bex, V., and Midgley, P. M., Cambridge, 1–29, 2013.
Jacovides, C. P., Tymvios, F. S., Asimakopoulos, D. N., The-ofilou, K. M., and Pashiardes, S.: Global photosynthetically ac-tive radiation and its relationship with global solar radiation in the Eastern Mediterranean basin, Theor. Appl. Climatol., 74, 227–233, 2003.
Jones, M. H., Fahnestock, J. T., and Welker, J. M.: Early and late winter CO2efflux from arctic tundra in the Kuparuk River water-shed, Alaska, USA, Arct. Antarct. Alp. Res., 31, 187–190, 1999. Kiepe, I., Friborg, T., Herbst, M., Johansson, T., and Soegaard, H.: Modeling Canopy CO2Exchange in the European Russian
Arc-tic, Arc. Antarc. Alp. Res., 45, 50–63, 2013.
Kuhry, P., Ping, C. L., Schuur, E. A. G., Tarnocai, C., and Zimov, S.: Report from the International Permafrost Association: carbon pools in permafrost regions, Permafrost Periglac., 20, 229–234, 2009.
Kutzbach, L., Wille, C., and Pfeiffer, E.-M.: The exchange of car-bon dioxide between wet arctic tundra and the atmosphere at the Lena River Delta, Northern Siberia, Biogeosciences, 4, 869–890, doi:10.5194/bg-4-869-2007, 2007.
Kwon, H. J., Oechel, W. C., Zulueta, R. C., and Hast-ings, S. J.: Effects of climate variability on carbon seques-tration among adjacent wet sedge tundra and moist tussock tundra ecosystems, J. Geophys. Res.-Biogeo., 111, G03014, doi:10.1029/2005JG000036, 2006.
Lafleur, P. M. and Humphreys, E. R.: Spring warming and carbon dioxide exchange over low Arctic tundra in central Canada, Glob. Change Biol., 14, 740–756, 2008.
Lafleur, P. M., Humphreys, E. R., St Louis, V. L., Myklebust, M. C., Papakyriakou, T., Poissant, L., Barker, J. D., Pilote, M., and Swystun, K. A.: Variation in peak growing season net ecosystem production across the Canadian Arctic, Environ. Sci. Technol., 46, 7971–7977, 2012.
Laurila, T., Soegaard, H., Lloyd, C. R., Aurela, M., Tuovinen, J. P., and Nordstroem, C.: Seasonal variations of net CO2exchange in
European Arctic ecosystems, Theor. Appl. Climatol., 70, 183– 201, 2001.
Lindroth, A., Lund, M., Nilsson, M., Aurela, M., Christensen, T. R., Laurila, T., Rinne, J., Riutta, T., Sagerfors, J., Strom, L., Tuovi-nen, J. P., and Vesala, T.: Environmental controls on the CO2 exchange in north European mires, Tellus B, 59, 812–825, 2007. Loranty, M. M., Goetz, S. J., Rastetter, E. B., Rocha, A. V., Shaver, G. R., Humphreys, E. R., and Lafleur, P. M.: Scaling an instantaneous model of Tundra NEE to the Arctic landscape, Ecosystems, 14, 76–93, 2011.
Lund, M., Falk, J. M., Friborg, T., Mbufong, H. N., Sigsgaard, C., Soegaard, H., and Tamstorf, M. P.: Trends in CO2 exchange
in a high Arctic tundra heath, 2000–2010, J. Geophys. Res.-Biogeo., 117, G02001, doi:10.1029/2011JG001901, 2012. Lund, M., Lafleur, P. M., Roulet, N. T., Lindroth, A.,
Chris-tensen, T. R., Aurela, M., Chojnicki, B. H., Flanagan, L. B., Humphreys, E. R., Laurila, T., Oechel, W. C., Olejnik, J., Rinne, J., Schubert, P., and Nilsson, M. B.: Variability in ex-change of CO2 across 12 northern peatland and tundra sites,
Glob. Change Biol., 16, 2436–2448, 2010.
emissions found in different types of permafrost peatlands, Glob. Change Biol., 17, 2601–2614, 2011.
Marushchak, M. E., Kiepe, I., Biasi, C., Elsakov, V., Friborg, T., Jo-hansson, T., Soegaard, H., Virtanen, T., and Martikainen, P. J.: Carbon dioxide balance of subarctic tundra from plot to re-gional scales, Biogeosciences, 10, 437–452, doi:10.5194/bg-10-437-2013, 2013.
McGuire, A. D., Anderson, L. G., Christensen, T. R., Dallimore, S., Guo, L. D., Hayes, D. J., Heimann, M., Lorenson, T. D., Mac-donald, R. W., and Roulet, N.: Sensitivity of the carbon cycle in the Arctic to climate change, Ecol. Monogr., 79, 523–555, 2009. McGuire, A. D., Christensen, T. R., Hayes, D., Heroult, A., Eu-skirchen, E., Kimball, J. S., Koven, C., Lafleur, P., Miller, P. A., Oechel, W., Peylin, P., Williams, M., and Yi, Y.: An assessment of the carbon balance of Arctic tundra: comparisons among ob-servations, process models, and atmospheric inversions, Biogeo-sciences, 9, 3185–3204, doi:10.5194/bg-9-3185-2012, 2012. Mooney, H. A., Bjorkman, O., and Collatz, G. J.: Photosynthetic
acclimation to temperature in desert shrub, larrea-divaricata, 1. Carbon-dioxide exchange characteristics of intact leaves, Plant Physiol., 61, 406–410, 1978.
New, M., Lister, D., Hulme, M., and Makin, I.: A high-resolution data set of surface climate over global land areas, Clim. Res., 21, 1–25, 2002.
Niu, S. L., Li, Z. X., Xia, J. Y., Han, Y., Wu, M. Y., and Wan, S.: Cli-matic warming changes plant photosynthesis and its temperature dependence in a temperate steppe of northern China, Environ. Exp. Bot., 63, 91–101, 2008.
Niu, S. L., Luo, Y. Q., Fei, S. F., Yuan, W. P., Schimel, D., Law, B. E., Ammann, C., Arain, M. A., Arneth, A., Aubi-net, M., Barr, A., Beringer, J., Bernhofer, C., Black, T. A., Buchmann, N., Cescatti, A., Chen, J. Q., Davis, K. J., Dell-wik, E., Desai, A. R., Etzold, S., Francois, L., Gianelle, D., Gie-len, B., Goldstein, A., Groenendijk, M., Gu, L. H., Hanan, N., Helfter, C., Hirano, T., Hollinger, D. Y., Jones, M. B., Kiely, G., Kolb, T. E., Kutsch, W. L., Lafleur, P., Lawrence, D. M., Li, L. H., Lindroth, A., Litvak, M., Loustau, D., Lund, M., Marek, M., Martin, T. A., Matteucci, G., Migliavacca, M., Montagnani, L., Moors, E., Munger, J. W., Noormets, A., Oechel, W., Olejnik, J., Kyaw, T. P. U., Pilegaard, K., Rambal, S., Raschi, A., Scott, R. L., Seufert, G., Spano, D., Stoy, P., Sutton, M. A., Varlagin, A., Vesala, T., Weng, E. S., Wohlfahrt, G., Yang, B., Zhang, Z. D., and Zhou, X. H.: Thermal optimality of net ecosystem exchange of carbon dioxide and underlying mechanisms, New Phytol., 194, 775–783, 2012.
Oberbauer, S. F. and Oechel, W. C.: Maximum CO2-assimilation
rates of vascular plants on an Alaskan Arctic Tundra slope, Hol-arctic Ecol., 12, 312–316, 1989.
Oberbauer, S. F., Starr, G., and Pop, E. W.: Effects of extended growing season and soil warming on carbon dioxide and methane exchange of tussock tundra in Alaska, J. Geophys. Res.-Atmos., 103, 29075–29082, 1998.
Oechel, W. C., Vourlitis, G. L., Hastings, S. J., Zulueta, R. C., Hinz-man, L., and Kane, D.: Acclimation of ecosystem CO2exchange
in the Alaskan Arctic in response to decadal climate warming, Nature, 406, 978–981, 2000.
Ow, L. F., Griffin, K. L., Whitehead, D., Walcroft, A. S., and Turn-bull, M. H.: Thermal acclimation of leaf respiration but not
pho-tosynthesis in Populus deltoides x nigra, New Phytol., 178, 123– 134, 2008a.
Ow, L. F., Whitehead, D., Walcroft, A. S., and Turnbull, M. H.: Thermal acclimation of respiration but not photosynthesis in Pi-nus radiata, Funct. Plant Biol., 35, 448–461, 2008b.
Parmentier, F. J. W., van der Molen, M. K., van Huisste-den, J., Karsanaev, S. A., Kononov, A. V., Suzdalov, D. A., Maximov, T. C., and Dolman, A. J.: Longer growing sea-sons do not increase net carbon uptake in the northeast-ern Siberian tundra, J. Geophys. Res.-Biogeo., 116, G04013, doi:10.1029/2011JG001653, 2011.
Robinson, C. H., Michelsen, A., Lee, J. A., Whitehead, S. J., Callaghan, T. V., Press, M. C., and Jonasson, S.: Elevated atmo-spheric CO2affects decomposition of Festuca vivipara (L) Sm
litter and roots in experiments simulating environmental change in two contrasting arctic ecosystems, Glob. Change Biol., 3, 37– 49, 1997.
Rocha, A. V. and Shaver, G. R.: Burn severity influences postfire CO2exchange in arctic tundra, Ecol. Appl., 21, 477–489, 2011. Ross, J.: The Radiation Regime and Architecture of Plant Stands,
Tasks for Vegetation Sciences, The Hague, Boston, London, 391 pp., 1981.
Ruimy, A., Jarvis, P. G., Baldocchi, D. D., and Saugier, B.: CO2
fluxes over plant canopies and solar radiation: a review, Adv. Ecol. Res., 26, 1–68, 1995.
Runkle, B. R. K., Sachs, T., Wille, C., Pfeiffer, E.-M., and Kutzbach, L.: Bulk partitioning the growing season net ecosys-tem exchange of CO2in Siberian tundra reveals the seasonality of its carbon sequestration strength, Biogeosciences, 10, 1337– 1349, doi:10.5194/bg-10-1337-2013, 2013.
Schuur, E. A. G., Bockheim, J., Canadell, J. G., Euskirchen, E., Field, C. B., Goryachkin, S. V., Hagemann, S., Kuhry, P., Lafleur, P. M., Lee, H., Mazhitova, G., Nelson, F. E., Rinke, A., Romanovsky, V. E., Shiklomanov, N., Tarnocai, C., Venevsky, S., Vogel, J. G., and Zimov, S. A.: Vulnerability of permafrost car-bon to climate change: implications for the global carcar-bon cycle, Bioscience, 58, 701–714, 2008.
Shaver, G. R., Billings, W. D., Chapin, F. S., Giblin, A. E., Nadel-hoffer, K. J., Oechel, W. C., and Rastetter, E. B.: Global change and the carbon balance of Arctic ecosystems, Bioscience, 42, 433–441, 1992.
Shaver, G. R., Rastetter, E. B., Salmon, V., Street, L. E., van de Weg, M. J., Rocha, A., van Wijk, M. T., and Williams, M.: Pan-Arctic modelling of net ecosystem exchange of CO2, Philos. T. R. Soc. B, 368, 20120485. doi:10.1098/rstb.2012.0485, 2013. Shaver, G. R., Street, L. E., Rastetter, E. B., Van Wijk, M. T., and
Williams, M.: Functional convergence in regulation of net CO2
flux in heterogeneous tundra landscapes in Alaska and Sweden, J. Ecol., 95, 802–817, 2007.
Shurpali, N. J., Verma, S. B., Kim, J., and Arkebauer, T. J.: Carbon-dioxide exchange in a peatland ecosystem, J. Geophys. Res.-Atmos., 100, 14319–14326, 1995.
Skre, O. and Oechel, W. C.: Moss functioning in different Taiga ecosystems in Interior Alaska, 1. Seasonal, phenotypic, and drought effects on photosynthesis and response patterns, Oecolo-gia, 48, 50–59, 1981.
vege-tation development in the subarctic, Arct. Antarct. Alp. Res., 38, 263–272, 2006.
Street, L. E., Shaver, G. R., Williams, M., Van and Wijk, M. T.: What is the relationship between changes in canopy leaf area and changes in photosynthetic CO2flux in arctic ecosystems?,
J. Ecol., 95, 139–150, 2007.
Street, L. E., Stoy, P. C., Sommerkorn, M., Fletcher, B. J., Sloan, V. L., Hill, T. C., and Williams, M.: Seasonal bryophyte productivity in the sub-Arctic: a comparison with vascular plants, Funct. Ecol., 26, 365–378, 2012.
SWIPA: Snow, Water, Ice, Permafrost in the Arctic, available at: http://www.amap.no/swipa/, 2011.
Ueyama, M., Iwata, H., Harazono, Y., Euskirchen, E. S., Oechel, W. C., and Zona, D.: Growing season and spatial variations of carbon fluxes of Arctic and boreal ecosystems in Alaska (USA), Ecol. Appl., 23, 1798–1816, 2013.
van der Molen, M. K., van Huissteden, J., Parmentier, F. J. W., Pe-trescu, A. M. R., Dolman, A. J., Maximov, T. C., Kononov, A. V., Karsanaev, S. V., and Suzdalov, D. A.: The growing season greenhouse gas balance of a continental tundra site in the In-digirka lowlands, NE Siberia, Biogeosciences, 4, 985–1003, doi:10.5194/bg-4-985-2007, 2007.
Vourlitis, G. L. and Oechel, W. C.: Landscape-scale CO2, H2O
vapour and energy flux of moist-wet coastal tundra ecosystems over two growing seasons, J. Ecol., 85, 575–590, 1997. Vourlitis, G. L. and Oechel, W. C.: Eddy covariance measurements
of CO2and energy fluxes of an Alaskan tussock tundra
ecosys-tem, Ecology, 80, 686–701, 1999.
Walker, D. A., Jia, G. J., Epstein, H. E., Raynolds, M. K., Chapin, F. S., Copass, C., Hinzman, L. D., Knudson, J. A., Maier, H. A., Michaelson, G. J., Nelson, F., Ping, C. L., Ro-manovsky, V. E., and Shiklomanov, N.: Vegetation-soil-thaw-depth relationships along a Low-Arctic bioclimate gradient, Alaska: synthesis of information from the ATLAS studies, Per-mafrost Periglac., 14, 103–123, 2003.
Walker, D. A., Raynolds, M. K., Daniels, F. J. A., Einarsson, E., Elvebakk, A., Gould, W. A., Katenin, A. E., Kholod, S. S., Markon, C. J., Melnikov, E. S., Moskalenko, N. G., Talbot, S. S., Yurtsev, B. A., and Team, C.: The Circumpolar Arctic vegetation map, J. Veg. Sci., 16, 267–282, 2005.
Westergaard-Nielsen, A., Lund, M., Hansen, B. U., and Tam-storf, M. P.: Camera derived vegetation greenness index as proxy for gross primary production in a low Arctic wetland area, ISPRS J. Photogramm., 83, 89–99, 2013.
Williams, M., Street, L. E., van Wijk, M. T., and Shaver, G. R.: Identifying differences in carbon exchange among arctic ecosys-tem types, Ecosysecosys-tems, 9, 288–304, 2006.