www.ann-geophys.net/26/2749/2008/ © European Geosciences Union 2008
Annales
Geophysicae
Comparison of multi-point measurements of current sheet structure
and analytical models
A. V. Artemyev1, A. A. Petrukovich1, L. M. Zelenyi1, H. V. Malova1,2, V. Y. Popov1,3, R. Nakamura4, A. Runov5, and S. Apatenkov6
1Space Research Institute, Russian Academy of Sciences, Moscow, Russia 2Nuclear Physics Institute, Moscow State University, Russia
3Faculty of Physics, Moscow State University, Russia
4Space Research Institute, Austrian Academy of sciences, Graz, Austria 5Institute of Geophysics and Planetary Physics, UCLA, Los Angeles, USA 6St. Petersburg University, St. Petersburg, Russia
Received: 5 June 2008 – Accepted: 12 August 2008 – Published: 15 September 2008
Abstract. Current density profiles of 22 thin current sheets, crossed by four Cluster spacecraft in the magnetotail are compared with the self-consistent model of anisotropic 1-D equilibrium, including several species of quasi-adiabatic (transient) ions and drifting electrons. In order to examine ion-scale features of the current density profile Cluster data from the 2001 and 2004 tail seasons were used when the spacecraft separation was about 2000 and 1000 km, respec-tively, while electron-scale features are studied using Clus-ter data from the 2003 season , when the spacecraft separa-tion was about 200 km. The model ion and electron current density peaks embedded in a background plasma sheet suc-cessfully reproduce observed profiles. Stability criteria of the model current sheet are also consistent with the experiment. Keywords. Magnetospheric physics (Magnetotail) – Space plasma physics (Kinetic and MHD theory; Numerical simu-lation studies)
1 Introduction
The magnetotail current sheet is an essential element of the Earth’s magnetosphere and is responsible for energy storage and release processes during substorms and storms, particle acceleration. The novel multi-point Cluster project revealed a rich variety of sheet structures. The scale (thickness) of a thin sheet is of the order of some thousands km (Runov et al., 2005a), but in some cases can be only several hundred km (Nakamura et al., 2006). In majority of cases current den-sity profiles were distinctly different from the classical Harris Correspondence to: A. V. Artemyev
shape and were categorized as embedded, bifurcated, or non-symmetric (Runov et al., 2006; Asano et al., 2005; Nakamura et al., 2006; Thompson et al., 2006). Another unexpected feature was abundance of strongly tilted (in YZ GSM plane) sheets (Sergeev et al., 2004; Runov et al., 2005a; Petrukovich et al., 2006).
A significant progress has been achieved in the develop-ment of theoretical sheet models. The simplest model is the 1-D kinetic Harris model (Harris et al., 1962), which is an ex-act solution of Vlasov equation. Recently it was generalized for kappa velocity distribution (Fu and Hau, 2005; Hau and Fu, 2007), ion and electron dominated current sheets (Yoon and Lui, 2004) as well as bifurcated sheets (Camporeale and Lapenta, 2005). Constant plasma drift velocity is common feature of these models, and therefore current density is pro-portional to plasma densityjy(z)∼n(z). (The GSM frame
of reference is used hereafter.) This defines the general struc-ture of Harris-type sheets but found to be generally not con-sistent with Cluster observations (Runov et al., 2006).
The influence of nonzero normal component of the mag-netic field, Bz, which is absent in the Harris-type models, but is always present in the magnetotail has been considered to be one of the important reasons of such discrepancy. Bz
might dramatically change the equilibrium state, because it introduces topological changes in particle trajectories (Buch-ner and Zelenyi, 1989). In ge(Buch-neral the conditionBz6=0
re-quires two-dimensionality (∂
∂x6=0, ∂
and Birn (2000) and Birn et al. (2004). Several aspects of these models were compared with the experimental data (Baumjohann et al., 2007). In all models mentioned above an isotropic pressure tensor was considered and the normal magnetic component,Bz6=0, was introduced in the frame of
2-D configuration.
However, there exists another approach to overcome this problem. Rich et al. (1972) assumed that an anisotropy of the pressure tensor is sufficient to obtain a 1-D plasma equilib-rium withBz6=0. Several other models considering pressure
anisotropy have been proposed, for example, the triply split current model, obtained numerically by Bykov et al. (2008), the model by Zelenyi et al. (2000, 2006) (see below), and the model of bifurcated sheet, taking into account popula-tion of non-adiabatic particles (Sitnov et al., 2003). The last model has been compared with experimental bifurcated cur-rent sheet (Sitnov et al., 2006).
The subject of our interest are models, describing thin magnetotail current sheet with characteristic scale of the or-der of ion Larmor radius (Runov et al., 2005; Nakamura et al., 2006), which has been observed by Cluster. Note that the models with isotropic pressure tensor are essentially not applicable for these thin current sheets, because their cur-rent density profiles have no sufficiently sharp (and high) maximum. In contrary, the models with anisotropic pressure might more adequately describe fine structure of thin cur-rent sheets depending on the peculiarities of particle distri-bution functions and nonadiabatic particle dynamics. There-fore for comparison with Cluster observations we have cho-sen the model of anisotropic current sheet, based on quasi-adiabatic ion dynamics in the curved magnetic field (Zelenyi et al., 2000). It has further modifications, taking into account asymmetric plasma sources (Malova et al., 2007), electron currents in a fluid approach (Zelenyi et al., 2004a, b), trapped plasma component (Zelenyi et al., 2002), heavy and light ions (Zelenyi et al., 2006) etc. This model is in a good accor-dance with the particle-in-cell simulations (Mingalev et al., 2007). Several existing model variants provide us a tool to describe and to explain quite a wide variety of the observed structures.
We, however, did not try to compare the observations with the other existing models, e.g. Schindler and Birn (2002) and Birn et al. (2004). Although, the other models of thin current sheets could explain the experimental observation as well.
Validation of the models with observational data is not a straightforward task. For example existing datasets (see Sect. 3) contain a certain preselection of relatively thin sheets (rapid current sheet flapping events) with the scales of the order of the spacecraft separation. The thicker and thinner sheets are not resolved well enough for quantitative analy-sis. Interpretation of the observed sheet characteristics (and hence, applicability of specific models) may vary depending on the actual magnetic field geometry, local plasma proper-ties and level of magnetospheric activity. A number of events (in particular, with bifurcated profiles) observed during very
active periods were explained in the frame of X-line current sheets (Thompson et al., 2006). Another relatively numer-ous subclass of strongly tilted sheets was associated with the specific plasma sheet deformation – differential vertical mo-tion of neighboring flux tubes (slippage) (Petrukovich et al., 2006, 20081).
In this paper we check the applicability of the Zelenyi et al. (2000) model to a specific subclass of Cluster current sheet observations – thin horizontal single-peaked sheets. The theory operates with the stationary case and Maxwellian ion energy (but not angle) distribution, while in reality the plasma structure is much more complicated, and therefore the full coincidence with experiment might be unattainable. The goal of this investigation is to show principal consistency between the model and observations, based on the statistics of events mostly taken from the previously assembled data sets. The detailed fitting may be left to future individual case studies. In the following we briefly describe the applied mod-els, the data selection approach, and comparison of 22 cur-rent sheet crossing events.
2 The thin anisotropic current sheet model
We use several modifications of the thin anisotropic current sheet model by Zelenyi et al. (2000). The current is carried by quasi-adiabatic ions moving in strongly curved magnetic fieldB={Bx,0, Bz}. The normal componentBzis constant,
while the profile of tangential magnetic field Bx is deter-mined self-consistently. The earlier version of this model considered only transient ions (Buchner and Zelenyi, 1989; Zelenyi et al., 2000) (Fig. 1). Ion dynamics is defined by two major parameters:bn=BzB0(this parameter should be relatively small for integrability of ion trajectories),Bx=B0 at the edge of a sheet, and the flow anisotropy parameter
ε=vTvD(vT – ion thermal velocity andvD– flow velocity
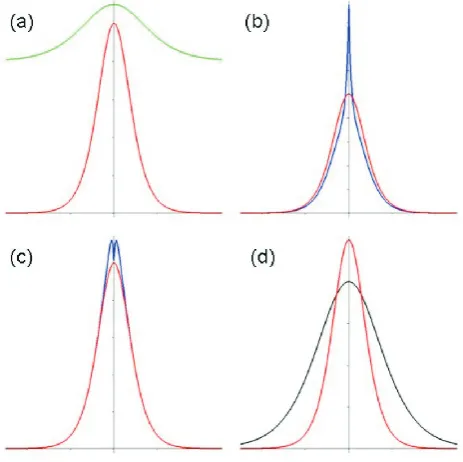
along magnetic field at the edge). Contrary to the Harris-like sheet the current density in the anisotropic model has a narrow peak in the center, while the plasma density does not vanish at the edges (Fig. 2a). Therefore the spatial scales of plasma density and current density are principally different (the current sheet is embedded into the plasma sheet). Cur-rent sheet thickness predicted by this early model was of the order of an ion Larmor radius (order of thousand km).
For electron motion a drift approximation is used, so that electron current density is a sum of cross-field particle mo-tion and curvature drifts (Zelenyi et al., 2004a, b). Elec-trons with an anisotropic pressurepe,I I6=pe,⊥create a sharp maximum of current density (of the order of hundred km thick) in the center of a sheet (Fig. 2b) due to local, but very strong curvature drift. The degree of electron anisotropy (pe,I I−pe,⊥)is determined self-consistently and depends on 1Petrukovich, A. A., Baumjohann, W., Nakamura, R., and
Fig. 1. Transient and trapped ions in the model of thin anisotropic
current sheet.
electron-ion temperature ratio and average value of electron pitch-angle (Zelenyi et al., 2004b). In a case of isotropic elec-tron pressurepe,I I=pe,⊥electron currents are much smaller
j⊥,ej⊥,i, resulting in a slight bifurcation of the current
density profile (Fig. 2c). In the current version of the model the ratio of ion–to– electron temperature at the edges is in the range 3–5.
A number of the model modifications, taking into account different ion populations and trapped plasma, allow to cre-ate thicker sheets (Fig. 2d). The trapped plasma (i.e. protons with a long life time inside a sheet) does not carry any cur-rent, but locally redistributes the current density (Zelenyi et al., 2002). In the current model the proportion of trapped to transient plasma is set to 15. Addition of oxygen ions (Zelenyi et al., 2006) increases the sheet scale due to larger Larmor radius of heavier ions. Finally, we introduced two Maxwellian ion populations (the colder and the hotter) to simulate plasma distribution with extended power law energy tail. Presence of ions with higher energy and with larger Lar-mor radius also results in the sheet thickening.
3 Selection of experimental data and the approach to comparison
Observational data for comparison with the theory were mostly taken from several published investigations of fast current sheet crossings (Runov et al., 2005a, 2006; Naka-mura et al., 2006). Event identifications, proper coordi-nate frames of reference and main sheet parameters were adopted from those datasets, but magnetic field and current
Fig. 2. Sketches of a typical model sheet. (a) Current density
(red) and plasma density (green) profiles. (b) Current density in the single-component model (only transient ions) (red) and current density in the model with anisotropic electrons (blue). (c) Current density in the single-component model (only transient ions) (red) and current density in the model with isotropic electrons (blue).
(d) Current density in the single-component model (only transient
ions) and thicker profile (black) due to oxygen ions, trapped plasma or double-temperature ions.
density profiles were reprocessed with the use of public CAA archive. Cluster 4 CODIF ion moments were used.
The 2001 dataset is the automatically selected collection of all fast (within 5 min) current sheet crossings (flapping events) with Bx change larger than 15 nT, which occurred during July–October 2001 (Runov et al., 2005a, 2006). The 2004 dataset is a similar collection for the respective year. Descriptions of data processing techniques can be found in other publications (Runov et al., 2005a, b, 2006; Petrukovich et al., 2006).
During the seasons of 2001 and 2004 Cluster spacecraft separation was about 1000–2000 km, suitable to resolve the ion-scale current sheet details. However it was too large to resolve electron-scale current peaks, which are an essen-tial part of some models (the central narrow maximum in Fig. 2b). Observations with the spacecraft separation of 200– 300 km were performed only during the 2003 season. The full list of fast crossings for 2003 (similar to that for 2001 and 2004) is not yet available and we picked up several events after a review of published investigations (Nakamura et al., 2006) and original data.
[image:3.595.51.288.64.286.2]Fig. 3. The model dependence between embedding (BextB0
mag-netic field ratio) and parameterε(see text for details).
taken only: (1) Almost horizontal current sheets with the normal vertical component Nz>0.8 (in GSM coordinates,
Nz is projection of normal vector to 0Z axis). (2) Sheets with more or less complete (with both wings of a sheet de-tected) and center-peaked current density profiles (with vi-sual inspection). (3) Relatively small magnetic field com-ponents Bn (along the normal) andBm (along the current) Bn, |Bm|<0.3B0, whereB0is the magnetic field outside the thin embedded current sheet (see below). The final set con-tains 22 events.
The embedded sheet should be described by two ba-sic magnetic field values: B0 at the edge of the mod-eling box (edge of the current sheet) and the total (lobe equivalent) magnetic field Bext2 =2µ0 npTp+neTez=0. For the experimental data we used the standard form
Bext2 =2µ0 1.17npTp
z=0 and empirically associated B0 with the magnetic field along the maximal variance direc-tion (Bl=BL)at the edge of the observed flapping event. It
can be also understood as the maximum magnetic field in the nearest vicinity of the crossing.
In order to adapt the model to finite spatial resolu-tion of the Cluster tetrahedron, theoretical current den-sity profiles were smoothed by the sliding window, cor-responding to spacecraft separation (for 2001 and 2004 – 1000 km; for 2003 – 300 km). For experimental sheet the effective coordinate along the normal was introduced as
z=
t2
R
t1 ∂Bl
∂t h
∂Bl ∂n
i−1
dt−z (t0), where t0 is a moment of time whenBl=0 (Runov et al., 2006). The thickness scaleLwas
defined as the ratioBext/jy(max).
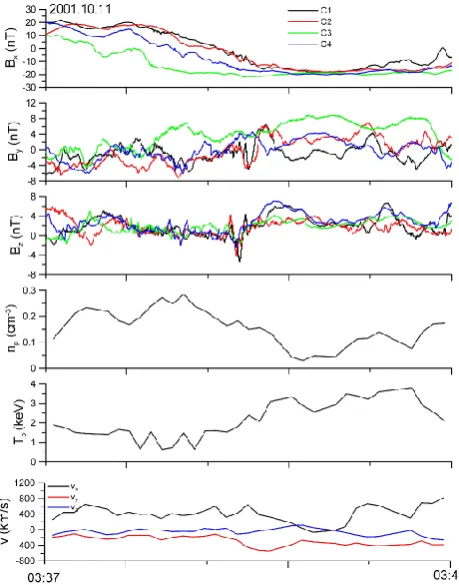
Fig. 4. Magnetic field components, proton density, temperature,
velocity for the case 11 October 2001 (#5). Standard Cluster colors are used.
The comparison procedure was based on parametersB0,
Bn,Bext,np,Tp,jmax,L. We tried to find the suitable model (parameters) by minimizing the following functionR (M):
R2(M)=1−Bext(M).Bext 2
+1−B0(M).B0 2
+
1−Bn(M) .
Bn 2
+
1−jmax(M) .
jmax 2
+ 1−L(M)L2+1−n(M)p .
np
2
+1−Tp(M) .
Tp 2
(1)
Model parameters are with the superscript(M), experimen-tal parameters – without superscripts. The fit was considered successful if differences between all, except may be one, pa-rameters were within 30%. However the priority was given to better coincidence of the maximum current density (the value of function1−jmax(M)
. jmax
2
is set not more 0.05). The model uses dimensionlessB0, Tp,Bz, εas free
pa-rameters, whileBext, np, L andjmax are determined self-consistently. The major model parameterεis not easy to de-termine from experimental data directly, however the model
Bext
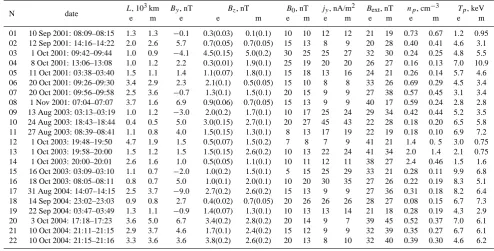
[image:4.595.312.542.63.356.2]Table 1. Parameters of experimental (e) and model (m) sheets.
N date L, 10
3km B
y, nT Bz, nT B0, nT jy, nA/m2 Bext, nT np, cm−3 Tp, keV
e m e e m e m e m e m e m e m
01 10 Sep 2001: 08:09–08:15 1.3 1.3 −0.1 0.3(0.03) 0.1(0.1) 10 10 12 12 21 19 0.73 0.67 1.2 0.95 02 12 Sep 2001: 14:16–14:22 2.0 2.6 5.7 0.7(0.05) 0.7(0.05) 15 13 8 9 20 28 0.40 0.41 4.6 3.1 03 1 Oct 2001: 09:42–09:44 1.0 0.9 −4.1 4.5(0.15) 5.0(0.2) 30 25 25 27 32 30 0.24 0.25 4.8 5.5 04 8 Oct 2001: 13:06–13:08 1.0 1.2 2.2 0.3(0.01) 1.9(0.1) 25 19 20 20 26 27 0.16 0.13 7.0 10.9 05 11 Oct 2001: 03:38–03:40 1.5 1.1 1.4 1.1(0.07) 1.8(0.1) 15 18 13 16 24 21 0.26 0.14 5.7 4.6 06 20 Oct 2001: 09:26–09:30 3.4 2.9 2.3 2.1(0.1) 0.5(0.05) 15 10 8 8 33 26 0.69 0.29 4.5 3.4 07 20 Oct 2001: 09:56–09:58 2.5 3.6 −0.7 1.3(0.1) 1.5(0.1) 20 15 9 9 27 38 0.57 0.45 3.1 3.4 08 1 Nov 2001: 07:04–07:07 3.7 1.6 6.9 0.9(0.06) 0.7(0.05) 15 13 9 9 40 17 0.59 0.24 2.8 2.8 09 13 Aug 2003: 03:13–03:19 1.0 1.2 −3.0 2.0(0.2) 1.7(0.1) 10 17 25 24 29 34 0.42 0.44 5.2 3.5 10 24 Aug 2003: 18:43–18:44 0.4 0.5 5.0 3.0(0.15) 2.7(0.1) 20 27 45 43 22 28 0.18 0.20 6.5 5.8 11 27 Aug 2003: 08:39–08:41 1.1 0.8 4.0 1.5(0.15) 1.3(0.1) 8 13 17 19 22 19 0.18 0.10 6.9 7.2 12 1 Oct 2003: 19:48–19:50 4.7 1.9 1.5 0.5(0.07) 1.5(0.2) 7 8 7 9 41 21 1.4 0. 5 3.0 0.75 13 1 Oct 2003: 19:58–20:00 1.5 1.2 1.5 1.5(0.15) 2.6(0.2) 10 13 22 24 41 34 2.0 1.4 2.1 0.75 14 1 Oct 2003: 20:00–20:01 2.6 1.6 1.0 0.5(0.05) 1.1(0.1) 10 11 12 11 38 27 2.4 0.46 1.5 1.6 15 16 Oct 2003: 03:09–03:10 1.1 0.7 −2.0 1.0(0.2) 1.5(0.1) 5 15 25 29 33 21 0.28 0.11 9.9 6.8 16 18 Oct 2003: 08:05–08:11 0.8 0.7 5.0 1.0(0.1) 2.0(0.1) 10 20 30 35 27 26 0.22 0.19 8.3 5.1 17 31 Aug 2004: 14:07–14:15 2.5 3.7 −9.0 2.7(0.2) 2.6(0.2) 15 13 9 9 27 36 0.31 0.18 8.2 6.4 18 14 Sep 2004: 23:02–23:03 0.9 0.8 2.7 0.4(0.02) 0.7(0.05) 20 26 26 26 28 27 0.08 0.15 6.7 7.3 19 22 Sep 2004: 03:47–03:49 1.3 1.1 −0.9 1.4(0.07) 1.3(0.1) 10 13 13 14 21 18 0.28 0.19 4.3 2.9 20 3 Oct 2004: 17:18–17:23 3.6 5.0 6.7 3.4(0.2) 2.8(0.2) 20 14 9 7 39 45 0.52 0.37 7.0 6.1 21 10 Oct 2004: 21:11–21:15 2.9 3.7 4.6 1.7(0.1) 2.4(0.2) 15 12 9 9 32 39 0.35 0.27 6.7 6.1 22 10 Oct 2004: 21:15–21:16 3.3 3.6 3.6 3.8(0.2) 2.6(0.2) 20 13 8 10 32 40 0.39 0.30 4.6 6.2
4 Comparison of model and observational data
Three characteristic examples of our comparison are pre-sented in Figs. 4–9. Magnetic field and plasma data for the first crossing at 11 October 2001 are shown in Fig. 4. Fig-ure 5 contains current density profiles, plotted with respect to the spatial coordinate along the normal and local magnetic field. Parameters of the sheet (according to Sect. 3), are in Table 1 (event #5). The value of magnetic fieldB0 at the edge of the sheet was taken at 03:37 UT. The model version, selected for this case, includes also anisotropic electrons and 15% of oxygen ions (the latter value is taken from accord-ing to the CODIF data). The model profile has somewhat flattened maximum, which appears due to averaging of the narrow electron peak (see Sect. 3).
The optimal model has almost all parameters (current den-sity, ion temperature,Bext,B0,Bz/B0)within 30% of experi-mental values. The only exception is the ion density (discrep-ancy is about 45%). The amplitude and scale of the current density peak are rather similar, but the experimental profile is less ordered and is slightly shifted off the center (i.e. from the position of zero magnetic field). There is also some dif-ference at the edges, which might appear due to weak back-ground currents in the real plasma sheet.
To investigate current density peaks at electron scales we address the 18 October 2003 case (Figs. 6, 7 and Table 1, #16). The model includes anisotropic electrons and 20% of oxygen ions. It should be noted that while the Cluster sep-aration in 2003 was optimal to see the electron scale peaks
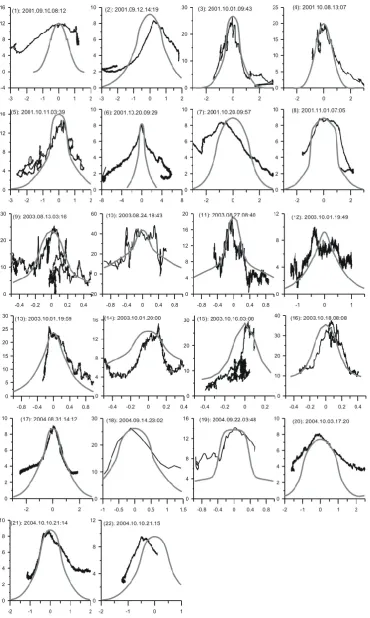
Fig. 5. Comparison of experimental (black) and model (grey)
cur-rent density profiles w.r.t. coordinate along the normal and magnetic field componentBl. Case 11 October 2001 (#5).
(large current density∼20−40 nAm2), it was too small to resolve the regular ion-scale sheet current profile, similar to that in the Example 1 (∼10 nAm2). Therefore in Fig. 7 only the central electron peak of the sheet is actually shown. As a consequence of that, there is large difference inB0(measured
B0refers to the edge of the electron sheet, while the model
[image:5.595.311.547.374.495.2]Fig. 6. Magnetic field components, proton density, temperature,
velocity for the case 18 October 2003 (#16).
Fig. 7. Comparison of experimental (black) and model (grey)
cur-rent density profiles w.r.t. coordinate along the normal and magnetic field componentBl. Case 18 October 2003 (#16).
The final example of 10 October 2004 was compared with the model having two ion populations (vT(1)
. v(T2)=3,
[image:6.595.310.547.64.228.2]ni(2).ni(1)=5.5) and electrons with anisotropic pressure (Figs. 8, 9 and Table 1, #21). In comparison with the first example, addition of the hotter ions helped to describe the thicker sheet with the lower current density maximum. The electron current was averaged out in accordance with the spacecraft separation. In this case the difference between
Fig. 8. Magnetic field components for the case 10 October 2004
(#21).
Fig. 9. Comparison of experimental (black) and model (grey)
cur-rent density profiles w.r.t. coordinate along the normal and magnetic field componentBl. Case 10 October 2004 (#21).
experimental data and theory macro parameters does not ex-ceed 30%, exceptbn=0.1 in the event andbn=0.2 in theory,
which may be affected also by the selection ofB0.
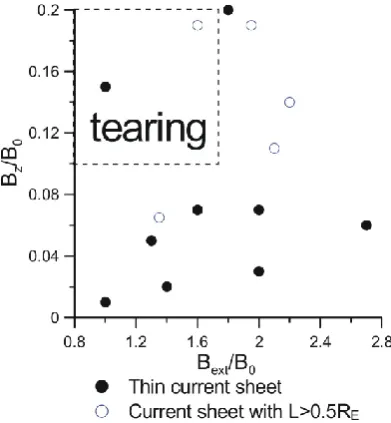
[image:6.595.310.548.278.399.2] [image:6.595.51.287.415.538.2]Fig. 11. Parametric map of the model instability region and
experi-mental points from 2001 and 2004.
Experimental profiles are generally rather irregular and non-symmetric. The scope of differences between experi-mental and model profiles varies. In several cases the profile shapes are very similar (e.g. ##8, 16, 17), while for some oth-ers there is correspondence only in maximum current densi-ties, while current wings are rather different (##1, 6). Plasma and magnetic field parameters always vary a lot within 30– 50%.
5 Stability of the model sheet and experimental data
The tearing instability is one of popular candidates to trigger magnetic reconnection and substorm onsets in the magneto-tail current sheet (Schindler, 1974). Earlier it was shown that Harris-type models are stable for tearing perturbation (Pellat et al., 1991) due to electron compressibility effect. However, the thin anisotropic sheet is tearing unstable in some regions of the parameter space (ε=vT/vD andbn=Bz/B0)with the typical growth time of the order of one-two minutes (Zelenyi et al. 2008). Taking into account dependence of the parame-terεfrom the embedding ratio (Fig. 2), we present the map of experimental points (Fig. 11), and only two of them fall into the instability domain. Here only 14 crossings from 2001 and 2004 years were taken, since durations of all 2003 events are much shorter than the estimated tearing mode growth rate. It is reasonable to assume that we most probably observe the sheet in a quasi steady state near equilibrium and its param-eters should belong to the stability domain of the parame-ter space. Only relatively rare tearing unstable sheets could be observed because the time of tearing growth is equal to time of current sheet crossing. Consequently one could
con-clude that experimental data are not in a contradiction with the model from the point of view of tearing stability.
6 Discussion
According to examples presented above, the model is capa-ble to reproduce the shape and maximum value of current density, including both ion and electron contributions as well as embedding. While the initial model with only one sort of transient ions, produces relatively thin sheet (intense cur-rent), one can make a sheet thicker by adding trapped ions or ions with larger Larmor radius. Only one out of 22 cross-ings can be described using the initial model. This result is in agreement with the previous work (Cully et al., 2006). There it was found that forced thin current sheet (our initial model) could not be used for fitting Cluster observations. It is important that not observable but crucial model parameter
εcould be successfully approximated by the degree of the sheet embedding, which can be determined empirically.
However, in many cases there exist substantial quantitative (of the order of 30–50%) discrepancies between model and observed plasma parameters. They can be due to a number of reasons: (1) Experimental parameters are not always well defined. Ion density and temperature can vary a lot during the crossing (e.g. Fig. 4, where temperature is changing by a factor of two). Electron temperature is not readily available and is not taken into account in this investigation. In partic-ular, some discrepancies can be caused by the unaccounted input from energetic ions with energy >36 keV (Runov et al., 2006). The boundary of embedded sheetB0has no for-mal rule of selection and is determined with visual inspection only. (2) Non-stationarity and deviations from a planar one-dimensional structure may also contribute to observed dif-ferences. (3) The model in its current form also has certain limits of flexibility. The choice of ion to electron temper-ature ratio is presently limited to 3–5, while the proportion of trapped to transient plasma – to 15. The model exten-sions with trapped, oxygen and two-temperature plasma are currently realized only with anisotropic electron component. Non-maxwellian plasma can be approximated only as a com-bination of two maxwellian distributions.
Therefore we consider that the model successfully de-scribes the observed sheets in principle and has the poten-tial to explain specific cases in more details, if sufficient amount of experimental data and adequate modifications of the model would be available. A useful byproduct of this in-vestigation is possibility to check the sheet stability versus tearing perturbations. Only two of 14 cases fell in the in-stability domain. Statistical significance of this result is not very high, but one can conclude on principal consistency of observations and model predictions in this aspect.
and relatively thin (crossed within 5 min) current sheets, ex-tensive survey of which was performed in the other papers and which are relatively consistent with the existing versions of our thin current sheet model.
Another important subset of observations are strongly tilted sheets, which often have dominant shear (i.e. electric current aligned) magnetic field component (Petrukovich et al., 2006). This feature is not included in the model at this stage. Bifurcations often observed in satellite experiments (Runov et al., 2006) were in some cases attributed to dy-namic configurations (Runov et al., 2003; Thompson et al., 2006). Different mechanisms of bifurcation such as trapped plasma (Zelenyi et al., 2002), influence of anisotropy (Sitnov et al., 2003) and specific velocity distributions (Camporeale and Lapenta, 2005) were suggested by theorists, but this is-sue is left for the future publications.
Often observed certain asymmetry (of the left and right wings) of experimental sheets in the frame of our model can be due to variability of ion sources (Malova et al., 2007), but significant deformations, including the shift of electric cur-rent maximum away from the zero magnetic field curcur-rently can not explained by any existing model. Empirically in some cases it can be accounted for by dynamic modifications, breaking the supposition of planar current sheet (Petrukovich et al., 20081).
Finally, much lower current densities of the order of 1 nA/m2 are often observed during more quiescent condi-tions. It appears that to explain such thick sheets the model needs to take into account effects of gradient drifts and there-fore include gradients in x-direction.
7 Conclusions
We performed the comparison of experimental statistics of fast current sheet crossings by Cluster spacecraft with the model of thin anisotropic current sheet. The model gener-ally well describes non-Harris profiles and embedded max-ima of current density while its stability criteria are consis-tent with the observations. Therefore one might presume that the model correctly captures basic physical effects important for the current sheet formation in the magnetotail and can be used for further analysis. The progress can be made adding new physical factors such as that related with magnetic field shear. For a more detailed comparison information on actual ion and electron distribution functions should be obtained and implemented to the theoretical model.
Acknowledgements. This work was supported in part by the RF
Presidential Program for State Support of Leading Scientific Schools (project no. NSh-472.2008.2), the Russian Foundation for Basic Research (project nos. 08-02-00407, 06-02-72561, 05-06-90631).
Topical Editor I. A. Daglis thanks D. Delcourt and another anonymous referee for their help in evaluating this paper.
References
Asano, Y., Nakamura, R., Baumjohann, W., Runov, A., Voros, Z., Volwerk, M., Zhang, T. L., Balogh, A., Klecker, B., and Reme, H.: How typical are atypical current sheets?, Geophys. Res. Lett., 32(3), L03108, doi:10.1029/2004GL021834, 2005.
Baumjohann, W., Roux, A., Le, Contel, O., Nakamura, R., Birn, J., Hoshino, M., Lui, A. T. Y., Owen, C. J., Sauvaud, J.-A., Vaivads, A., Fontaine, D., and Runov, A.: Dynamics of thin current sheets: Cluster observations, Ann. Geophys., 25, 1365–1389, 2007, http://www.ann-geophys.net/25/1365/2007/.
Birn, J. and Schindler, K.: Self-consistent theory of three-dimensional convection in the geomagnetic tail, J. Geophys. Res., 88, 6969–698, 1983.
Birn, J. and Schindler, K.: Thin current sheets in the magnetotail and the loss of equilibrium, J. Geophys. Res., 107(A7), 1117, doi:10.1029/2001JA000291, 2002.
Birn, J., Schindler, K., and Hesse, M.: Thin electron current sheets and their relation to auroral potentials, J. Geophys. Res., 109(A2), A02217, doi:10.1029/2003JA010303, 2004.
Buechner, J. and Zelenyi, L. M.: Regular and chaotic charged par-ticle motion in magnetotaillike field reversals 1. Basic theory of trapped motion, J. Geophys. Res., 94(A9), 11 812–11 842, 1989. Camporeale, E. and Lapenta, G.: Model of bifurcated current sheets in the Earth’s magnetotail: Equilibrium and stability, J. Geophys. Res., 110, A07206, doi:10.1029/2004JA010779, 2005.
Cully, C. M., Ergun, R. E., Lucek, E., Eriksson, A., Baker, D. N., and Mouikis, C.: Forced current sheets in a flapping magnetotail, Int. Conf. Substorms, 8, 43–48, 2006.
Harris, E. G.: On a plasma sheet separating regions of oppositely directed magnetic field, Nuovo Cimento, 23, 115–121, 1962. Hau, L.-N. and Fu, W.-Z.: Mathematical and physical aspects
of Kappa velocity distribution, Phys. Plasma, 14, 110702, doi:10.1063/1.2779283, 2007.
Hau, L.-N. and Fu, W.-Z.: Vlasov–Maxwell equilibrium solutions for Harris sheet magnetic field with Kappa velocity distribution, Phys. Plasma, 12, 070701, doi:10.1063/1.1941047, 2005. Kan, J. R.: On the structure of the magnetotail current sheet, J.
Geophys. Res., 78, 3773–3781, 1973.
Lemb´ege, B. and Pellat, R.: Stability of a thick two-dimensional quasineutral sheet, Phys. Fluids, 25, 1995–2004, 1982.
Malova, H. V., Zelenyi, L. M., Popov, V. Y., Delcourt, D. C., Petrukovich, A. A., and Runov, A. V.: Asymmetric thin current sheets in the Earth’s magnetotail, J. Geophys. Res., 34, L16108, doi:10.1029/2007GL030011, 2007.
Manankova, A. V.: Two-dimensional current-carrying plasma sheet in the near-Earth geomagnetic tail region: a quasi-stationary evo-lution, Ann. Geophys., 21, 2259–2269, 2003,
http://www.ann-geophys.net/21/2259/2003/.
Nakamura, R., Baumjohann, W., Asano, Y., Runov, A., Balogh, A., Owen, C. J., Fazakerley, A. N., Fujimoto, M., Klecker, B., and Reme, H.: Dynamics of thin current sheets associated with magnetotail reconnection, J. Geophys. Res., 111(A11), A11206, doi:10.1029/2006JA011706, 2006.
Pellat, R., Coroniti, F. V., and Pritchett, P. L.: Does ion tearing exist?, Geophys. Res. Lett., 18, 143–146, 1991.
http://www.ann-geophys.net/24/1695/2006/.
Petrukovich, A. A., Baumjohann, W., Nakamura, R., Runov, A., Balogh, A., and Reme, H.: Thinning and stretching of the plasma sheet, J. Geophys. Res., 112(A10), A10213, doi:10.1029/2007JA012349, 2007.
Rich, F. J., Vasyliunas, V. M., and Wolf, R. A.: On the Balance of Stresses in the Plasma Sheet, J. Geophys. Res., 77(25), 4670– 4676, 1972.
Runov, A., Nakamura, R., Baumjohann, W., Zhang, T. L., Volw-erk, M., Eichelberger, H.-U., and Balogh, A.: Cluster observa-tion of a bifurcated current sheet, Geophys. Res. Lett., 30, 1036, doi:10.1029/2002GL016136, 2003.
Runov, A., Sergeev, V. A., Baumjohann, W., Nakamura, R., Ap-atenkov, S., Asano, Y., Volwerk, M., Voros, Z., Zhang, T. L., Petrukovich, A., Balogh, A., Sauvaud, J.-A., Klecker, B., and Reme, H.: Electric current and magnetic field geometry in flap-ping magnetotail current sheets, Ann. Geophys., 23, 1391–1403, 2005a,
http://www.ann-geophys.net/23/1391/2005/.
Runov, A., Sergeev, V. A., Nakamura, R., Baumjohann, W., Ap-atekov, S., Asano, Y., Takada, T., Volwerk, M., Voros, Z., Zhang, T. L., Sauvaud, J.-A., Reme, H., and Balogh, A.: Local struc-ture of the magnetotail current sheet: 2001 Cluster observations, Ann. Geophys., 24, 247–262, 2006,
http://www.ann-geophys.net/24/247/2006/.
Runov, A., Sergeev, V. A., Nakamura, R., Baumjohann, W., Zhang, T. L., Asano, Y., Volwerk, M., Voros, Z., Balogh, A., and Reme, H.: Reconstruction of the magnetotail current sheet structure us-ing multi-point Cluster measurements, Planet. Space Sci., 53(1– 3), 237–243, 2005b.
Schindler, K.: A Self-Consistent Theory of the Tail of the Mag-netosphere, Earth’s Magnetospheric Processes, Proceedings of a Symposium, edited by: McCormac, B. M., 32, 200–206, 1972. Schindler, K.: A Theory of the Substorm Mechanism, J. Geophys.
Res., 79(19), 2803–2810, 1974.
Schindler, K. and Birn, J.: Model of two-dimensional embed-ded thin current sheets from Vlasov theory, J. Geophys. Res., 107(A8), 1193, doi:10.1029/2001JA000304, 2002.
Sergeev, V., Runov, A., Baumjohann, W., Nakamura, R., Zhang, T. L., Balogh, A., Louarnd, P., Sauvaud, J.-A., and Reme, H.: Ori-entation and propagation of current sheet oscillations, Geophys. Res. Lett., 31(5), L05807, doi:10.1029/2003GL019346, 2004.
Sitnov, M. I., Guzdar, P. N., and Swisdak, M.: A model of the bifurcated current sheet, Geophys. Res. Lett., 30(13), 1712, doi:10.1029/2003GL017218, 2003.
Sitnov, M. I., Swisdak, M., Guzdar, P. N., and Runov, A.: Structure and dynamics of a new class of thin current sheets, J. Geophys. Res., 111, A08204, doi:10.1029/2005JA011517, 2006.
Thompson, S. M., Kivelson, M. G., El-Alaoui, M., Balogh, A., R`eme, H., and Kistler, L. M.: Bifurcated current sheets: Statis-tics from Cluster magnetometer measurements, J. Geophys. Res., 111, A03212, doi:10.1029/2005JA011009, 2006.
Yoon, P. H. and Lui, A. T. Y.: Model of ion- or electron-dominated current sheet, J. Geophys. Res., 109(A11), A11213, doi:10.1029/2004JA010555, 2004.
Zelenyi, L. M., Sitnov, M. I., Malova, H. V., and Sharma, A. S.: Thin and superthin ion current sheets. Quasi-adiabatic and nona-diabatic models, Nonlin. Processes Geophys., 7, 127–139, 2000, http://www.nonlin-processes-geophys.net/7/127/2000/.
Zelenyi, L. M., Delcourt, D. C., Malova, H. V., and Sharma, A. S.: “Aging” of the magnetotail thin current sheets, Geophys. Res. Lett., 29(12), 1608, doi:10.1029/2001GL013789, 2002. Zelenyi, L. M., Malova, H. V.,Popov, V. Yu., Delcourt, D. C., and
Sharma, A. S.: Evolution of ion distribution functions during the “aging” process of thin current sheets, Adv. Space Res., 31(5), 1207–1214, 2003.
Zelenyi, L. M., Malova, H. V., Popov, V. Yu., Delcourt, D. C., and Sharma, A. S.: Role of electrostatic effects in thin current sheets. NATO science series, Multiscale processes in the Earth’s magne-tosphere: from Interball to Cluster, edited by: Sauvaud, J.-A. and Nemeˇcek, ˇZ., Kluwer Academic Publishers, pp. 275–288, 2004a. Zelenyi, L. M., Malova, H. V., Popov, V. Yu., Delcourt, D., and Sharma, A. S.: Nonlinear equilibrium structure of thin currents sheets: influence of electron pressure anisotropy, Nonlin. Pro-cesses Geophys., 11, 579–587, 2004b,
http://www.nonlin-processes-geophys.net/11/579/2004/. Zelenyi, L. M., Malova, H. V., Popov, V. Y., Delcourt, D. C.,
Ganushkina, N. Y., and Sharma, A. S.: “Matreshka” model of multilayered current sheet, Geophys. Res. Lett., 33(5), L05105, doi:10.1029/2005GL025117, 2006.