R E S E A R C H A R T I C L E
Open Access
Trial Sequential Analysis in systematic
reviews with meta-analysis
Jørn Wetterslev
1,2*, Janus Christian Jakobsen
1,2,3,4and Christian Gluud
1,4Abstract
Background:Most meta-analyses in systematic reviews, including Cochrane ones, do not have sufficient statistical power to detect or refute even large intervention effects. This is why a meta-analysis ought to be regarded as an interim analysis on its way towards a required information size. The results of the meta-analyses should relate the total number of randomised participants to the estimated required meta-analytic information size accounting for statistical diversity. When the number of participants and the corresponding number of trials in a meta-analysis are insufficient, the use of the traditional 95% confidence interval or the 5% statistical significance threshold will lead to too many false positive conclusions (type I errors) and too many false negative conclusions (type II errors).
Methods:We developed a methodology for interpreting meta-analysis results, using generally accepted, valid evidence on how to adjust thresholds for significance in randomised clinical trials when the required sample size has not been reached.
Results:The Lan-DeMets trial sequential monitoring boundaries in Trial Sequential Analysis offer adjusted confidence intervals and restricted thresholds for statistical significance when the diversity-adjusted required information size and the corresponding number of required trials for the meta-analysis have not been reached. Trial Sequential Analysis provides a frequentistic approach to control both type I and type II errors. We define the required information size and the corresponding number of required trials in a meta-analysis and the diversity (D2) measure of heterogeneity. We explain the reasons for using Trial Sequential Analysis of meta-analysis when the actual information size fails to reach the required information size. We present examples drawn from traditional meta-analyses using unadjusted naïve 95% confidence intervals and 5% thresholds for statistical significance. Spurious conclusions in systematic reviews with traditional meta-analyses can be reduced using Trial Sequential Analysis. Several empirical studies have demonstrated that the Trial Sequential Analysis provides better control of type I errors and of type II errors than the traditional naïve meta-analysis.
Conclusions:Trial Sequential Analysis represents analysis of meta-analytic data, with transparent assumptions, and better control of type I and type II errors than the traditional meta-analysis using naïve unadjusted confidence intervals.
Keywords:Meta-analysis, Random-effects model, Fixed-effect model, Interim analysis, Group sequential analysis, Trial sequential analysis, Heterogeneity, Diversity, Sample size, Information size
* Correspondence:[email protected]
1Copenhagen Trial Unit, Centre for Clinial Intervention Research, Dpt. 7812,
Rigshospitalet, Copenhagen University Hospital, Blegdamsvej 9, DK-2100 Copenhagen, Denmark
2Centre for Research in Intensive Care, Rigshospitalet, Copenhagen University
Hospital, Blegdamsvej 9, DK-2100 Copenhagen, Denmark Full list of author information is available at the end of the article
Background
Most meta-analyses include too few randomised partici-pants, to obtain sufficient statistical power that allow re-liable assessment of even large anticipated intervention effects [1]. The credibility of statistical significant meta-analyses with too few participants is poor, and interven-tion effects are often spuriously overestimated (type I errors) or spuriously underestimated (type II errors) [2]. Meta-analyses of, e.g., cardiovascular, anaesthesiologic, and neonatal interventions have many false positive and false negative results, due to low statistical power in a meta-analysis when the required number of randomised participants or trials have not been reached [3–6]. Trial Sequential Analysis (TSA) of a meta-analysis may amend these problems [4, 7]. In this article, we aim to describe the origin, history, adaptation, and criticism of TSA.
Using TSA, we can handle a meta-analysis of several randomised clinical trials in an analogous manner to in-terim analysis of a single randomised clinical trial. If the accrued cumulative information fails to achieve the re-quired number of randomised participants in order to detect or reject a specific assumed effect, the uncertainty of the estimate of the intervention effect will increase. The uncertainty will decrease the higher the fraction of the required information size the meta-analysis obtain. To statistically solve the problem with uncertainty, we expand the confidence interval, i.e., adjusting the thresh-old for statistical significance when the required infor-mation size has not been reached. The farther from the required number of randomised participants, the wider the confidence interval and the lower the statistical sig-nificance level needs to be in order to reliably assess the uncertainty of the point estimate.
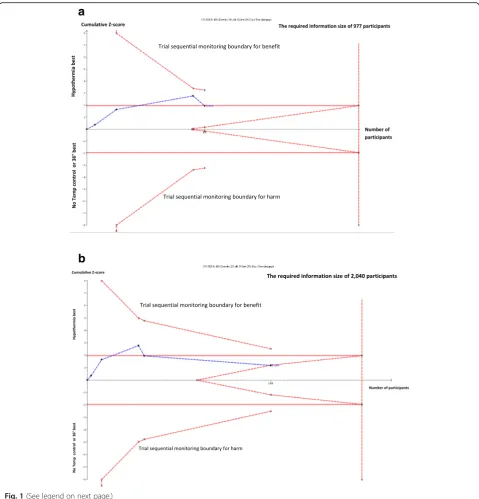
In TSA of a meta-analysis, we include the trials in chronological order and we handle the analysis of these trials as an interim analysis relative to the required num-ber of randomised participants. TSA calculates the re-quired number of participants, based on our predefined anticipated intervention effect, i.e., our alternative hy-pothesis [7–9]. The result of a trial sequential meta-analysis is displayed on a TSA diagram (e.g., Fig. 1a and b) with a TSA-adjusted confidence interval and an ad-justed level of statistical significance, i.e, a lower thresh-old for statistical significance compared to the usual nominal of 0.05, if the required information size has not been reached [10].
In the above-mentioned adjustments, we take into consideration if the required number of randomised par-ticipants and corresponding trials, to show or reject a specific intervention effect, were reached or not. The re-quired information size is defined as the number of par-ticipants and events necessary to detect or reject an a priori assumed intervention effect in a meta-analysis [11]. The required information size is not a single
sample size, but a summation of sample sizes from a given number of included trials. Therefore, the calcula-tion is performed considering the variability (heterogen-eity variance) between the estimates of the intervention effects of the included trials.
In TSA, the sample size, required for a single rando-mised clinical trial to be conclusive for a specific inter-vention effect, is adjusted upward by an appropriate measure of the statistical heterogeneity in the meta-analysis in order to become the required information size. This is equivalent to using the variance in the random-effects model to calculate the required informa-tion size (the model variance based calculainforma-tion of the re-quired information size). In the TSA, we hereafter adjust the confidence interval of the point estimate and the threshold for statistical significance relative to the frtion of the required informafrtion size which has been ac-crued in the actual meta-analysis [11].
First, we will present a motivating example of a meta-analysis on hypothermia versus no hypothermia in co-matose patients having survived cardiac arrest. Second, we present an updated meta-analysis with the results of a new trial, and we describe how this update has chan-ged the conclusion of the preceding traditional meta-analysis. We also show how the use of TSA would appropriately have reduced the risk of a wrong conclu-sion in the first meta-analysis failing to achieve the re-quired information size. Third, we shortly describe the historical development of sequential analyses in a single trial with interim analyses and in a cumulative meta-analysis of several trials. We explain how sequential meta-analysis can be performed with TSA [12]. Finally, we discuss the criticism that has been raised about TSA and we briefly describe the possibility for Bayesian analysis as an alternative to both traditional naïve meta-analysis and TSA of a meta-meta-analysis.
A motivating example: how the Target Temperature Management-Trial changed the conclusion of the meta-analysis of trials with cooling of patients after out of hospital cardiac arrest
surprising to see how little the TSA, conducted after each new trial has been interim-analysed, differs from the last TSA on groups of trials (e.g., TSA only up-dated every second year).
Figure 1 shows the result of a TSA of meta-analysis of four trials comparing a target temperature of 33°–34 °C versus no cooling, conducted before the initiation of the Target Temperature Management (TTM) Trial (Fig. 1a) [16–18]. The TSA shows that the four trials did not even reach half of the required information size to confirm or reject a 17% relative risk reduction which was the inter-vention effect indicated in a coninter-ventional meta-analysis of the trials [16]. The conventional confidence interval for the relative risk ratio of all-cause mortality in a trad-itional meta-analysis is 0.70 to 1.00 (P= 0.05), suggesting a reduction of mortality. The confidence interval and the P-value would not have been sufficient to claim a conclusive interim analysis stopping for benefit in a sin-gle randomised trial if analysed with Lan-DeMets’group sequential monitoring boundaries [19]. For demonstrat-ing a 17% relative risk reduction, the TSA-adjusted con-fidence interval of the relative risk is 0.63 to 1.12. This confidence interval shows that i) a target temperature of 33°–34 °C versus no cooling can either decrease or in-crease mortality, and ii) that definitive evidence has not yet been reached. The cumulative Z-curve in the figure does not pass through the trial sequential monitoring boundary for benefit; only the conventional and naïve P
= 0.05 (Z = 1.96) level for a beneficial effect has been reached. Therefore, there is not sufficient information to document the effect, or there may not be a beneficial ef-fect at all. Nevertheless, based on this evidence, inter-national guidelines had recommended for ten years that the temperature of comatose cardiac arrest patients
should be targeted to 33°–34 °C, calling the intervention »mild therapeutic hypothermia« [20]. No further rando-mised clinical trials of induced hypothermia versus no temperature control (or normothermia) in comatose car-diac arrest patients after resuscitation and admittance to intensive care units were conducted during this 10-year period. This may indicate that a P-value of 0.05 in the conventional meta-analysis was used as an unofficial »stopping boundary« for further trials within this same period.
In the TTM Trial, we compared the effect of cooling to target temperature 33 °C versus 36 °C on mortality of cardiac arrest patients [17, 18]. The updated TSA in-cluding the TTM Trial showed no statistically significant effect at the conventional level, as the Z-curve returned to the area with P> 0.05 (|Z| < 1.96) (Fig. 1b). Figure 1b shows that the cumulative Z-curve touches the futility-boundaries in the TSA diagram (see section‘False Nega-tive Meta-analyses’ below). Therefore, the updated TSA indicates that a 17% relative risk reduction, or an even greater reduction, most likely can be rejected, although the pre-estimated required information size of 2040 pa-tients has not yet been reached. It is not likely that a meta-analysis will ever show a 17% statistical significant relative risk reduction of mortality, even though the con-tinued conduct of trials until a cumulated number of pa-tients, corresponding to the required meta-analytic information size of 2040 patients, was reached (Fig. 1b). The conclusion is that hypothermia to 33°–34 °C does not seem to have a clinical important effect on mortality compared with no cooling or targeted normothermia (36 °C), as the 17% relative risk reduction only corre-sponds to a median of 3 weeks’longer survival [17, 18]. Moreover, the original conventional meta-analysis before (See figure on previous page.)
inclusion of the TTM Trial had a false positive result; the null hypothesis was falsely rejected. Whether the avoidance of fever is actually beneficial compared with no cooling at all, remains to be tested, as the TTM trial used cooling in both the intervention (target 33 °C) and the control group (target 36 °C).
Interim-analyses during a randomised clinical trial with an accumulating number of participants
If a trial is stopped after an interim-analysis because of aP
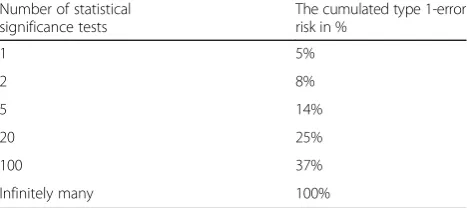
< 0.05 or the trial is continued if P≥0.05, the real risk of committing a type I error will increase to more than 0.05 with the number of interim-analyses. Introducing an interim-analysis half-way in a randomised clinical trial, using a stoppingP-value equal to 0.05 in both the half-way analysis and the final analysis, will increase the real max-imal type I error risk to 8% [21, 22] (Table 1). If the proced-ure of interim analysis is performed as four interim analyses and one final analysis, with a constant level of stat-istical significance of 5%, the real type I error risk will be 14% [21]. A simulation study using repetitive testing on an accumulating number of participants in a single trial, has shown that the P-value will inevitably become less than 0.05, despite the true intervention effect being zero [23].
A Bonferroni adjustment of the level of statistical signifi-cance, being 5% divided with the number of tests on accu-mulating data, assumes that all tests are conducted on independent data. As the tests on the accumulating trial population are not statistically independent, the Bonferroni-adjusted levels of statistical significance are most often too conservative [24]. The trial participants in an early sequential analysis are also included in the subse-quent later sesubse-quential analyses. Therefore, there is an in-creasing overlap of trial participants included in the latest sequential analysis compared to participants included in the previous sequential analyses. The closer we come to the
a prioricalculated sample size, the Bonferroni adjustment becomes more and more unjustified (too conservative).
Historical development of sequential analyses in a single trial with interim analyses
Methods to avoid an increased risk of a type I error due to repetitive testing on an increasing number of observa-tions was described by Abraham Wald in 1945 in Con-tributions to the theory of statistical estimation and testing hypotheses [25]. Wald proposed »the sequential probability ratio test« in which the sequential testing continues until a definitive wanted or unwanted effect can be proved [26, 27]. According to this procedure, the trial continues as long as the results of the sequential tests fall within the so-called ‘zone of indifference’ amidst the two alternative hypotheses. This procedure, used as a quality assurance measure of production dur-ing the Second World War, has never achieved wide im-plementation in randomised clinical trials; possibly because the procedure is bound to continue infinitely as long as the true intervention effect lies between the two alternative hypotheses. Consequently, a decision to stop the trial may never become possible [28].
After the Second World War, Peter Armitage sug-gested more restrictive levels of statistical significance than 5% to stop a trial before the a priori calculated sample size was reached [21]. This procedure was ap-plied in a number of interim analyses of large trials [29]. Furthermore, Stuart Pocock proposed a procedure in which the overall risk of type I error is limited to 5% by setting the statistical significance level to 0.05 divided by
k, using k-1 interim analyses and a final analysis [22].
This procedure is identical to the Bonferroni procedure for interim analyses and a final analysis of a single trial [30]. Researchers might find it peculiar to only declare statistical significance if P< (0.05/k), despite the esti-mated sample size has been reached and the required criterion for statistical independence was not fulfilled.
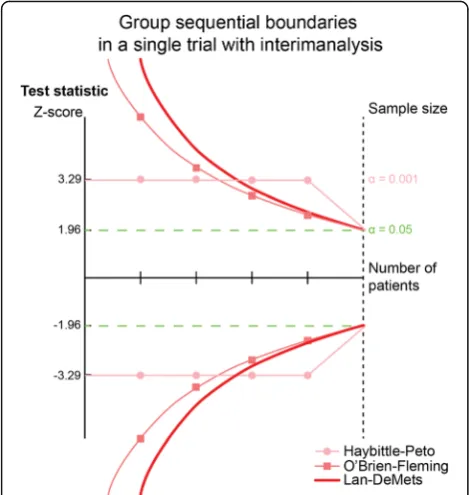
In 1977, Richard Peto suggested the use of a maximal type I error risk (α-spending) in each of four interim analyses of 0.001 (1 promille) and 0.05 in the final ana-lysis. As this would produce a summary additional type I error risk of 0.004 to the final 0.05, the total type I error risk would maximally be 5.4% [31] (Fig. 2). However, by a modest increase of the a priori estimated sample size, the summary maximal used type I error risk would re-main within the usual 5%. As shown above, the rationale of statistical independence required for this procedure still lacks underlying reason as to why the trial partici-pants in an early sequential analysis are also included in the subsequent sequential analysis.
In 1979, Peter O’Brien and Thomas Fleming proposed the group sequential design of trials with interim analyses, using exponential decreasing levels of statistical significance with the increasing number of patients in the sequentially analysed groups (Fig. 2) [32]. The recommenda-tions of the International Conference on Harmonization– Table 1Showing the level of cumulated type 1-error risk, if a
threshold of 5% is applied constantly at each sequential significance testing, on an accumulating number of trial participants
Number of statistical significance tests
The cumulated type 1-error risk in %
1 5%
2 8%
5 14%
20 25%
100 37%
Infinitely many 100%
Good Clinical Practice, the U.S.A. Food and Drug Admin-istration, and the European Medicines Agency on the design and analysis of randomised trials with interim ana-lyses are mainly based on works from 1980s, primarily prepared by Gordon Lan, Kuyung Man Kim, and David DeMets (Fig. 2) [18, 33, 34]. Their works allow proper se-quential testing at any time during the trial period, with-out unduly increasing the overall risk of a preset nominal type I error risk [34–36].
Methods
Avoiding the increased risk of random errors in randomised clinical trials with interim analyses
It is and should be mandatory to perform interim ana-lyses in large randomised clinical trials addressing patient-centred outcomes. Even though the preplanned sample size has not been reached, thousands of patients might already have been randomised in a trial. Before we allow the trial to continue, there is a need to secure that no valid evidence showing superiority of one of the com-pared interventions exists. If one of the interventions (could also be placebo) with a sufficiently small uncer-tainty is superior to the other one in an interim analysis, it may be unethical to continue the trial. The explan-ation for this is that the superiority can be so large that it cannot be reversed even though we continue to
randomise patients until the total, originally preplanned sample size is obtained. If the trial is continued despite the superiority of the intervention in one of the inter-vention groups, the patients in the other group will be exposed to an inferior (harmful) intervention and the trial must be stopped [37]. The use of interim analyses in a single randomised trial has to be planned at the de-sign stage of the trial and protocolised upfront as group sequential analyses in the charter for interim analyses [33]. For the conduct of group sequential analyses, a sample size is calculated already at the design stage, based on the anticipation of a minimal important and realistic intervention effect of the primary outcome of the trial [36, 38] (see Appendix).
The sample size calculation considers the level of statis-tical significance at which we want to test a dichotomous or a continuous outcome when the full sample size has been reached. It is when the pre-calculated sample size has been reached, and only then, a two-sided P-value of less than 0.05, corresponding to a test-statistic Z-value of ±1.96, can be accepted as the statistical significance level whenαhas been set to 5% in the sample size calculation.
Interim analyses, with the potential to stop a rando-mised trial before the estimated (or fixed) sample size has been reached due to a positive, negative, or lack of the addressed effect, can be conducted for dichotomous and continuous outcomes by calculating the cumulative Zi-value at the i-th analysis (see Appendix). The calcu-lated Zi-value is then recalcu-lated to the more restrictive level of statistical significance, the critical Z-value being the discrete group sequential boundary according to the ac-tual accrued number of participants.
There is international consensus that the increase of type I error risk with sequential testing, including the risk of overestimating the intervention effect or underestimat-ing the variance, at an interim analysis, should be out-weighed by more restrictive levels of statistical significance before the a priori estimated (fixed) sample size has been reached [29, 31–37]. This is why‘monitoring boundaries’, with significance levels much smaller than a nominal P-value of 0.05 (corresponding to much larger |Z|-values than ±1.96) are applied as criteria to stop a trial before achieving the estimated sample size [33].
Numerical integration is used to calculate the monitoring boundaries, being the critical levels of statistical significance for the Zi-values (andP-values) of the interim analyses [39]. Most often, the O’Brien-Fleming’s α-spending–function is applied and converted to sequential boundaries (critical values) for the Zi-values called Lan-DeMets’ sequential monitoring boundaries (Fig. 2) [18, 19]. The α-spending function allows only a small part of the total nominal type I error risk to be used initially in the sequential analyses, and with a modest increase of the estimated final (fixed) sample size, there is a full 5% type I error risk available for the final
analysis when thea prioriestimated sample size is reached. Lan-DeMets’sequential boundaries allow testing whenever you want during the trial [34, 35]. If we plan, e.g., a half-way analysis in a randomised trial, we can monitor theP -value at this time point according to Lan-DeMets’ moni-toring boundaries and suggest that the trial is stopped if the
P-value is less than 0.003 which corresponds to a 99.7% confidence interval excluding 1.00 for a relative risk or 0.00 for a mean difference [34–36]. Therefore, sequential ana-lyses become a theoretical decision tool to decide whether a trial should be stopped before the estimated (fixed) sample size is achieved, considering the sparse data and the repetitive testing during the trial [37].
Avoiding the increased risk of random errors in
cumulative meta-analyses with sparse data and multiple meta-analytic up-dates
The majority of meta-analyses include less than the re-quired number of randomised participants and trials in order to become conclusive [1, 3, 5, 7]. There are two reasons for this. First, most randomised trials are under-powered [1, 3, 5, 7]. Second, the estimation of the required information size in a random-effects meta-analysis ought to incorporate the heterogeneity variance (between trial variance) [1, 7, 11]. Only 22% of the meta-analyses in The Cochrane Library have 80% power to conclude whether there is an intervention effect of 30% or not when the usual maximal risks of type I error (α) of 5% and type II error (β) of 20% are applied [1]. This lack of power is primarily caused by small trials and a considerable heterogeneity variance between the esti-mates of the intervention effect in the included trials [1]. Meta-analyses can be conducted with a fixed-effect model or a random-effects-model [40, 41]. In the fixed-effect model, we assume one true underlying fixed-effect in all the included trials. In the random-effects model, we as-sume that the true underlying effects vary from trial to trial according to a normal or log normal distribution. Often, the fixed-effect assumption is unrealistic as the possible underlying effect may depend on, e.g., doses of a pharmacological intervention, duration of the interven-tions, timing of the outcome assessment, and differences between the trial populations. These differences between the included trials are called clinical heterogeneity. Due to these factors and possibly random variation, the in-cluded effect estimates often show considerable variation defined as statistical heterogeneity and measured as large inconsistency (I2
) [42] and large diversity (D2) [11]. Con-siderable statistical heterogeneity leads to increased uncertainty, expressed as a wider confidence interval of the intervention effect when the meta-analytic estimate is calculated in a random-effects model. Early meta-analyses conducted before the required information size and the corresponding number of trials are achieved [43], often
wrongly show unrealistic large intervention effects as well as statistical significance which cannot be reproduced when the amount of required information is adequately considered [44, 45]. The reliability in early meta-analyses is lower compared to their updated counterparts years later [2]; the estimated intervention effects, when further trials are included in the meta-analysis update, become considerably lower than previously estimated [2].
A large simulation study of random-effects meta-analyses shows that there is a considerable risk of overestimating the intervention effect when the required information size has not been reached [6]. These results were based on the as-sumption that the‘true’intervention effect was zero while the frequencies of events in the control groups and the het-erogeneity variance were assumed similar to those in large cardiologic meta-analyses [6]. It has been shown empirically that approximately 25% of cardiologic meta-analyses are in-conclusive because of lack of power [3]. Turner and col-leagues showed that the trials and the meta-analyses of Cochrane systematic reviews have limited power [1]. In Cochrane meta-analyses, each total number of analysed participants provide only 22% of the meta-analyses with an 80% power to detect or refute a 30% relative risk reduction (which is a large intervention effect) [1] (Fig. 3). Recently, Imberger and colleaques confirmed these results in meta-analyses of anaesthesiological interventions [46]. Accord-ingly, four out of five meta-analyses did not have the statis-tical power to address even substantial intervention effects. The number of meta-analyses with sufficient power to address smaller and clinically more plausible intervention effects are, undoubtedly, even smaller.
trials have been reached and beyond, the risk is kept below 5%. The trial sequential monitoring boundaries generated this way make it possible to test if significance is reached and to adjust the confidence intervals every time new trials are added to the meta-analysis. The latter is a prerequisite for using sequential boundaries in cumulative meta-analyses of trials with varying sample sizes [10, 12].
Besides applying the observed estimate of statistical heterogeneity—the observed statistical diversity (D2
) [11, 41] in the most recently conducted meta-analysis—it may be reasonable to apply an expected heterogeneity in
the calculation of the required information size, especially when the observed heterogeneity is zero [48]. As it is un-likely that diversity will stay zero when larger trials are added, an expected heterogeneity may be used in a sensi-tivity analysis (e.g., a diversity of 25% or the upper confi-dence interval of the I2 (provided by the TSA program)) when the required information size is calculated [48, 49]. It may also be wise in a post hoc calculation of the re-quired information size to apply the least likely interven-tion effect, i.e., the confidence limit of the summary estimate in the meta-analysis confidence interval closest to the null effect. The latter is a conservative approach fa-cilitating the evaluation of whether a meta-analysis may show an effect of the least likely magnitude in a TSA. If a TSA with such an approach shows a statistical significant intervention effect, judged by the TSA-adjusted confi-dence interval, there is a very high probability that the intervention has an effect, provided that the included trials are at low risk of bias. In contrast, there will only be very low evidence of effect if the TSA-adjusted confidence interval does not exclude the null effect for an interven-tion effect of a magnitude indicated by the point estimate.
Results
False positive meta-analyses
It is necessary to assume or address a specific magnitude of the intervention effect, different from zero, in order to calculate the sample size in a single trial. Therefore, when a sample size is estimated, we relate not only to the null hypothesis but also to a specific alternative hypothesis. The alternative hypothesis is the assumption or the antici-pation of a specific magnitude of the intervention effect different from zero. Most often random-effects meta-analysis will be the preferred appropriate method to esti-mate the precision weighted average effect as it does not ignore the statistical heterogeneity variance. If statistical heterogeneity is anticipated, the information size in the conclusive meta-analysis ought to be an upward adjusted sample size of a corresponding adequately powered single trial. The upward adjustment is done with the variance ex-pansion shifting from a‘fixed-effect’model to a‘ random-effects’model, see Appendix [11].
The described example from cooling of patients after out of hospital cardiac arrest is far from being unique (Fig. 1). Among meta-analyses of interventions for neo-natal patients, there were approximately 25% to 30% false positive results [5, 50]. In 2009, we showed empir-ically that the use of Lan-DeMets’trial sequential moni-toring boundaries eliminated 25% of the false positive traditional interim-meta-analyses. This analysis included 33 final meta-analyses with sufficient information size to detect or reject a 15% relative risk reduction [44]. In 2013, we showed that 17% of cardiovascular meta-analyses withP< 0.05 were most likely false positive [3].
Fig. 3Showing trial sequential monitoring boundaries for benefit and harm in a cumulative meta-analysis. TheZ-value is the test statistic and |Z| = 1.96 corresponds toP= 0.05; the higherZ-values, the lower the P-values.aShows how an early statistical significance no longer is present in a cumulative meta-analysis when the required information size has been reached.bShows how an early lack of statistical signifi-cance emerges later when the requiered information size is achieved.
In 2015, we showed that less than 12% of meta-analyses of anaesthesiological interventions had 80% power to show a 20% relative risk reduction [46].
There may be other important reasons for a traditional meta-analysis to yield a false positive result than only the increased risk of random errors. A risk of systematic error (bias) in the included trials is a frequent cause of overesti-mation of benefit and underestioveresti-mation of harm– sequen-tial meta-analyses do not in any way solve problems with bias [51–58]. Therefore, it is recommended that every sin-gle trial included in a systematic review with meta-analysis be evaluated for risks of bias. This evaluation should encompass the following domains: generation of the allo-cation sequence, alloallo-cation concealment, blinding of patients and caregivers, blinding of outcome assessment, report on attrition during the trial, report on outcomes, and industry funding. Other types of bias may also need to be considered [51–58].
False negative meta-analyses
Lack of a statistical significant intervention effect in a traditional meta-analysis is not necessarily evidence of no effect of the intervention. »Absence of evidence is not evidence of absence of effect« [59]. Nevertheless, se-quential meta-analyses with the TSA software may show that the meta-analysis has sufficient statistical power to reject an intervention effect of a specific magnitude even though the estimated required information size has not yet been reached (Fig. 4).
This can be done by calculating the non-superior and non-inferior trial sequential monitoring boundaries, the socalled‘futility boundaries’. Futility boundaries indicate when the assumed effect could be considered unachiev-able. Futility-boundaries are calculated using a power function analogous to the α-spending function for constructing superiority- and inferiority-boundaries with application of numerical integration [36]. The example with cooling of comatose patients after cardiac arrest shows a situation where the assumed intervention effect of 17% relative risk reduction can be rejected because the Z-curve crosses the futility-boundary (Fig. 1b). However, this is not always what happens. We found that in 25 of 56 (45%) published cardiovascular systematic reviews in The Cochrane Library, the actual accrued information size failed to reach what was required to refute a 25% relative risk reduction [3]. Only 12 of these reviews (48%) were recognised as inconclusive by the authors. Of the 33 meta-analyses not showing statistical significance, only 12 (36%) were truly negative in the sense that they were able to reject a 25% relative risk reduction [3]. This illustrates that the statistical power is also low in many cardiovascu-lar meta-analyses, and false conclusions are imminent. Within other medical specialities, the problems are likely to be even bigger as trials and meta-analyses usually
include less patients. Nevertheless, sequential meta-analyses with calculated futility-boundaries may, in some instances, contribute to adequately declare thea priori an-ticipated intervention effect to be unachievable, though the required information size was not reached [10].
Analogous to the false positive analyses, a meta-analysis may result in a false negative result due to bias. Bias is a frequent cause for underestimation of harmful intervention effects [51–57], and therefore, the prelimin-ary defined bias risk domains should also be evaluated for all included trials when it comes to serious and non-serious adverse events [51–58].
Discussion
We have explained and shown how the use of TSA may assist the meta-analyst in controlling risks of type I and type II errors when conducting meta-analyses. The use of TSA has now increasingly been advocated by authors, both inside and outside The Cochrane Collaboration [47, 60, 61]. However, the use of TSA is not easy, may be misused, and has been critisised [62].
If TSA is designed and conducted after data were col-lected, there is a danger that the analysis becomes data driven and that it may not be sufficiently stringent to ad-dress a predefined alternative hypothesis [63–65]. How-ever, using data-driven hypotheses and analyses is a critique that could potentially be directed against all meta-analyses. This is why, for each TSA, the anticipated intervention effect, the anticipated between trial hetero-geneity, and the proportion of the outcome in the con-trol group, should be part of a peer reviewed protocol, published prior to the conduct of the systematic review and the TSA [49, 64, 65]. These considerations should also impact the choice of the meta-analytic model, e.g., whether to give most credibility to the fixed-effect or the random-effects model and how to calculate the required information size [11, 65].
TSA has been criticised for transferring a method from a decision theoretical universe in a single rando-mised clinical trial into a universe where the result does not directly impact the subsequent decisions [63–66]. The postulate seems to be that no matter that a TSA shows benefit, harm, or lack of a relevant effect, it will not impact any part of the already finalised trials, and possibly, not decisions to stop or continue ongoing tri-als, or to initiate trials. This point of view seems to un-duly emphasise the difference between the consequences of an interim-analysis in a single trial and the conse-quences of a sequential meta-analysis of several trials. First, the systematic review is placed at the top of the generally recognised hierarchy of evidence, meaning that the systematic review is considered the most likely reli-able source of evidence, implicating whether an inter-vention should be implemented in clinical practice or further trials should be launched [52, 53]. Interventions are often recommended in clinical guidelines and imple-mented in clinical practice when a meta-analysis shows statistical significance on the traditional naïve level (P< 0.05) [16, 18, 67–69]. Furthermore, the chance that a meta-analysis is updated in The Cochrane Library is ap-parently 57% higher when P≥0.05 than when P< 0.05 [4, 45]. This indicates that meta-analyses with P< 0.05 contribute to the decision to stop doing further trials or to decide if meta-analyses should be updated or not.
Critics of sequential meta-analysis have stressed that the method emphasises too heavily the result of the stat-istical significance test instead of the 95% confidence interval [70]. However, the fundamental problem is not whether the result is presented as aP-value or as a con-fidence interval, but it is foremost because a (1-α)% con-fidence interval is based upon the choice of the maximally allowed type I error risk (α). If we use naïve unadjusted confidence intervals when the required infor-mation size is still not reached, we will be led to make hasty and false declarations of statistical significant
effects, likely to be refuted if further trials are added. With TSA we adjust the confidence interval for the in-complete meta-analytic information size and for multiple testing [4]. It has been claimed that a traditional 95% confidence interval is sufficient to evaluate whether the intervention works or not [70], but the traditional 95% confidence interval exclusively relates to the null hy-pothesis and not to a relevant alternative hyhy-pothesis [68, 71]. Thereby, the supporters of the traditional confi-dence interval forget that the rejection of the null hy-pothesis (the conventional 95% confidence interval excluding the null effect), does not in itself lead to the acceptance of a relevant alternative hypothesis [71]. Pre-mature rejection of the null hypothesis, in the case of sparse data, may be dismissed if these data become suffi-cient to conclude on a specific alternative intervention effect that is different from the null hypothesis.
A traditional unadjusted 95% confidence interval ex-cluding the null effect and accepting an effect indicated by, e.g., the point estimate, is sufficient as a criterion for statistical significance only when the required informa-tion size has been reached. If the number of randomised participants in the meta-analysed trials is less than the required, the confidence interval needs to be adjusted [34, 36]. By exclusively applying a 95% confidence inter-val in a meta-analysis, one does not automatically account for the lack of required power in the meta-analysis to conclude on an effect size indicated by, e.g., the point estimate [71]. Therefore, in relation to a rele-vant and realistic alternative hypothesis, the traditional unadjusted confidence interval will represent a too nar-row confidence interval which by chance does not in-clude the null effect, and accordingly, the observed effect of the intervention may be misleading [71, 72]. The credibility of the traditional confidence interval re-lies on the fact that the required information size for a specific effect has been achieved, and thereby, the ability to conclude on an alternative hypothesis [59, 63–65].
the variance encountered in the random-effects meta-analysis is arising from ‘play of chance’ [46, 47].
Elena Kulinskaya and John Wood [43] argued, in their important article from 2013, that when estimating the information size in random-effects model meta-analyses, it is too simplistic to just increase the required informa-tion size with the variance increase, going from a fixed-effect to a random-fixed-effects model. Kulinskaya and Wood [43] persuasively showed that the necessary number of future trials to be included should be given with a lower limit (i.e., minimal number), regardless of the sample sizes of the trials, before the power of the random-effects model meta-analysis becomes sufficient to detect or reject a prespecified clinically relevant intervention ef-fect. Kulinskaya and Wood also showed that increasing the number of future trials in a random-effects model meta-analysis might decrease the required information size estimated for additional future trials to render suffi-cient power of the random-effects meta-analysis [43]. We welcome the proposals for modifying the plan on number of subsequently included trials and their sample size. These considerations are in line with the findings of Joanna in’t Hout et al. [74], Alexander Sutton et al. [73], Jeffrey Valentine et al. [75], and Michael Borenstein et al. [76]. However, we would still argue that the difference between the required information size and the accrued information, may contribute importantly to the estima-tion of the necessary sample size in future trials, espe-cially if coupled with the considerations proposed by Kulinskaya and Wood [43]. If we use the weighted esti-mate of the variance in previous trials as being the best estimate of the variance for the future trials, we may need 50% (Appendix) more trials than the minimal number required to cover the information gap of the re-quired minus the acre-quired information size (RIS-AIS) (Appendix). Following an example given by Kulinskaya and Wood [43], we will be able to cover the information gap suggested by RIS-AIS with 12 trials instead of the minimal required number of eight trials. As outlined by Kulinskaya and Wood, we would be able to further de-crease the total number of future randomised patients by increasing the number of future planned trials even more. However, this will be at the expense of dramatic-ally decreasing the power of each new trial to detect the difference, indicated so far by the point estimate of the meta-analysis (or even the minimal important differ-ence). Certainly, we could choose to increase the num-ber of future trials with only one or two. However, the corresponding information size will still be huge. The minimal required number of trials calculated as the first integer greater than c⋅τ2
(wherecis a figure relating to the information already gained and τ2 is the between trial variance, Appendix), and the corresponding meta-analytic information size, may be optimal because it
provides each of the new, equally sized, trials with the same power as the ‘planned’ random-effects meta-analysis aimed to detect or reject a similar intervention effect. However, for most interventions, these huge trials will be unrealistically large to conduct. Alternatively, in-creasing the number of trials corresponding to a re-quired extra information size ofRIS-AISwill still provide such trials with a power of 80% to detect or reject an intervention effect of 2.5 times the effect indicated in the meta-analysis. Increasing the number of trials even further than the number corresponding to RIS-AIS will decrease the power of these trials with approximately 10% per additional trial (or increase the detectable alter-native to three times or more the effect indicated in the meta-analysis). Such trials will subsequently be substan-tially underpowered to detect or reject even much larger intervention effects than the realistic difference, or even the minimal important difference. This will obviously destroy the integrity of such small future trials and they will generally, and rightfully so, be disregarded as heavily influenced by random error (‘play of chance’). Therefore, theRISand thereby theRIS-AIS seem to be a fair trade-off between the number of required additional rando-mised participants and the number of required additional trials. In two examples given by Kulinskaya and Wood, the number of additional randomised partici-pants is reduced from 4700 to 720 and from 11,200,000 to 300,000 when using RIS-AIS at the expense of four more trials than the minimal number of trials required. However, we agree, that a reasonable strategy for resolv-ing the question of the presence or absence of a specific intervention effect with an adequately powered random-effects model may include a first trial with a sample size equal to the sample size indicated by formula 1 in the Appendix. This is a sample size corresponding to the minimal number of required trials. Such a trial may very well be substantially larger than the total acquired infor-mation size in the meta-analysis conducted before the trial. When the result from such a trial becomes avail-able, the updated cumulative meta-analysis using the a priorianticipated intervention effect and a new estimate of the between trial variance may be used in a fixed-effect or a random-fixed-effects model to evaluate how far we will be from a conclusion of whether the intervention ef-fect exists or not. The fixed-efef-fect model may then turn out to be the most appropriate model to evaluate the pooled intervention effect when one or a few trials heav-ily dominate the entire accumulated evidence [77].
If diversity and the proportion of events in the control group change substantially, the magnitude of the re-quired information size and the corresponding number of required future trials may change accordingly. This is the phenomenon of the ‘moving target’ which critics hold against TSA. However, a moving target seems bet-ter than having no target at all. Recently, we docu-mented that in prospective application of TSA in very large cumulative meta-analyses, TSA prevented false positive conclusions in 13 out of 14 meta-analyses when
RISwas not reached [45].
Trial Sequential Analysis: a position between frequentist and Bayesian thinking
TSA of meta-analysis like the sequential analysis of a single randomised trial, originates from frequentist sta-tistics [29]. The frequentist way of thinking was initially based on testing of the null hypothesis. This applies to both theP-value and its relation to an a priori accepted maximal type I error risk (α) and the possibility of in-cluding a null effect in the corresponding (1-α)% confi-dence interval [29]. The anticipation of an intervention effect of a specific magnitude, the alternative hypothesis, and subsequently the calculation of a required informa-tion size enabling the conclusion whether such an effect could be accepted or rejected, is, however, intimately re-lated to the Bayesian prior.
TSA contains an element of Bayesian thinking by re-lating the result of a meta-analysis to thea priori point estimate of the intervention effect addressed in the ana-lysis [77]. Bayes’factor (BF) for a trial result is the ratio between the probability that the trial data originates under the null hypothesis, and the probability that the trial data originates under the alternative hypothesis or even several alternative hypotheses [72, 78, 79]. The pos-terior odds ratio for the estimate of the intervention ef-fect after a new trial is added is calculated given the prior odds ratio for the intervention effect before the trial as: posterior odds ratio = BF x prior odds ratio [79]. In a Bayesian analysis, the prior takes form of an antici-pated probability distribution of one or more possible al-ternative hypotheses or intervention effects which multiplied with the likelihood of the trial, results in a posterior distribution [79].
A methodological position between the frequentist and the Bayesian thinking can be perceived both in se-quential interim-analyses of a single trial and in TSA of several trials [29]. Both have a decisive anticipation of a realistic intervention effect, although a full Bayesian ana-lysis should incorporate multiple prior distributions with different anticipated distributions of intervention effects: e.g., a sceptical, a realistic, and an optimistic prior [79]. The TSA prioritise one or a few specific alternative hy-potheses, specified by point estimates of the anticipated
effect in the calculation of the required information size just as in the sample size estimation of a single trial [11]. The incentive to use sequential analyses arise because the true effect is not known and the observed interven-tion effect may be larger than the effect addressed in the sample size estimation of a single trial as well as in the estimation of the required information size for a meta-analysis of several trials. The need to discover an early, but greater effect than the one anticipated in the sample or information size calculation, or to discard it, thereby originates. If the intervention effect, in relation to its variance, happens to be much larger during the trial or the cumulative meta-analysis, this will be discovered through the breakthrough of the sequential boundary. However, this may also be problematic as too small sam-ple sizes (in relation to the true effect), as mentioned, in-crease the risk of overestimation of the intervention effect or the risk of underestimation of the variance. In other words, due to a factitious too small sample size, we may erroneously confirm an unrealistic large antici-pated intervention effect due to the play of chance.
There seems to be an ancestry between the sceptical prior in a Bayesian analysis and the use of a realistic intervention effect in a sequential analysis when the sample size in a single trial or the information size in a meta-analysis should be calculated [77, 78]. The smaller the effect, the greater the demand for quantity of infor-mation, and the sequential statistical significance bound-aries become more restrictive. In other words, it becomes more difficult to declare an intervention effect-ive or ineffecteffect-ive, in case the required information size is not achieved.
a realistic effect is not achieved. In general, it is easier to reject the null hypothesis than to reject a small, but realis-tic and still important, alternative hypothesis [64]. The null hypothesis can never be proven, and in practice, this means that it can never be completely discarded, as this would require an infinitely large number of observations.
The reason for early spurious significant findings may be quite simple, although not self-evident. Even adequate randomisation in a small trial lacks ability to ensure the balance between all the involved, known or unknown, prognostic factors in the intervention groups [81]. When we find a statistically significant intervention effect in a small trial or in a small meta-analysis, it is often due to insufficient balance of im-portant prognostic factors, known or unknown, between the intervention groups. Therefore, it is not necessarily intervention effects that we observe, but rather an uneven distribution of important prognostic factors between groups. In addition to the described risks of random error, the overall risk of bias which includes the risk of publication bias makes it under-standable why published trials and meta-analyses often result in unreliable estimates of intervention effects [2, 83].
The power of frequentist inference in a single trial and in a meta-analysis of several trials lies in two basic assumptions. First, the only decisive difference between the intervention groups during the trial is the difference between the interventions. We con-clude that ‘despite everything else’, the measured dif-ference in the outcome is due to different properties of the interventions because everything else seems equal in the groups. In a small trial and a small meta-analysis, the assumption, that all other risk fac-tors are equally distributed in the two intervention groups, may not be fulfilled as described above, even though adequate bias control has been exercised. Sec-ond, the power of frequentist inference depends on the correctness of applying the ‘reverse law of impli-cation’ from mathematical logic (see Appendix): that a sufficiently small P-value, calculated as the probability that we got a specific trial result when the null hy-pothesis is in fact true, leads us to discard the null hypothesis itself. This assumption, which never totally excludes the possibility that the result of a trial may agree with or be a result of the null hypothesis, de-mands a specific a priori chosen threshold for statis-tical significance. That is, a sufficiently small P-value leads us to regard the trial result as virtually impos-sible under the null hypothesis, and, therefore, we re-gard the opposite to be true and discard the null hypothesis. This automatically raises the question: how small a P-value should be before we can apply the ‘reverse law of implication’. Or alternatively
expressed, does a P-value less than an a priori chosen threshold of statistical significance reject the null hypoth-esis? Ronald A. Fisher, already in 1956, warned against using a statistical significance level of 5% in all situations [84]. Nevertheless, ever since, it seems to have broadly been implemented as a criterion for conclusion in medical research [83], and this is likely wrong [85].
Sequential interim-analyses in a single trial and TSA of meta-analyses of several trials deal systematically and rationally with the misunderstood application of a con-stant level of statistical significance (P< 0.05), unrelated to the accrued fraction of the pre-calculated required (fixed) sample or information size and number of trials.
Conclusions
Most systematic reviews with meta-analyses, including Cochrane systematic reviews, do not have sufficient stat-istical power to detect or reject even large intervention effects. Meta-analyses are updated continuously, and, therefore, ought to be regarded as interim-analyses on the way towards a required information size. The evalu-ation of meta-analyses ought to relate the total number of randomised participants to the required meta-analytic information size and the corresponding number of re-quired trials considering statistical diversity. When the number of participants in a meta-analysis is less than the required, based on a realistic and minimally import-ant intervention effect, the constimport-ant application of a traditional naïve 95% confidence interval or a naïve 5% statistical significance threshold will lead to too many false positive and false negative conclusions. The Lan-DeMets’sequential monitoring boundaries in TSA offer adjusted, expanded confidence intervals and adjusted, restrictive thresholds for statistical significance when the diversity-adjusted required information size and the re-quired number of trials for the meta-analysis has not been reached. A Bayesian meta-analysis, using prior dis-tributions for both the intervention effect and the statis-tical heterogeneity, may even be more reliable for deciding whether an intervention effect is present or not. However, the Bayesian meta-analysis also poses dif-ficulties with interpretation. Until easy-to-use software programs for full Bayesian meta-analysis become access-ible, TSA represents a better assumption-transparent analysis than the use of traditional meta-analysis with unadjusted confidence intervals and unadjusted thresh-olds for statistical significance.
Appendix
Sample size in a single randomised trial Dichotomous outcome
SS¼4⋅ðZα=2þZβÞ2⋅
v
θ2; with v¼P⋅ð1−PÞ og P
¼ ðPEþPCÞ=2
In this formula, PE and PC are the frequencies of the outcome in the experimental group and the control group,
ϴis the intervention effect that the trial wants to address withμ= PC–PE,αandβare the maximally allowed type I and type II error risks, andν is the variance of the out-come difference between the two groups.
The test statisticZiat thei-th interim analysis for the dichotomous outcome measure:
Zi ffiffiffiffiffiffiffiffiffiffiffiffiffiffiffiffiffiffiffiffiffiffiffiffiffiffiffiffi¼PEi−PCi V ar PEið −PCiÞ p
with PEi−PCi being the estimate of the intervention ef-fect at the i-th interim analysis, andVar(PEi−PCi) is the variance of the estimate [36].
Continuous outcome
If the anticipated difference between the means in the control group and the experimental group is assumed to be X1–X2 with the standard deviation SD, α and β being the type I and type II error risks, the SS is calculated as [38]:
SS¼4⋅ðZ1−α=2þZβÞ2⋅ð
X1X2Þ2
SD2
The cumulative Zi-value at thei-th interim analysis is calculated as:
Zi¼
X1X2
SDðX1X2Þ
X1i– X2i being the estimate of the intervention effect at the i-th interim analysis, andSD(X1i –X2i) its standard deviation [36].
The required information size in a meta-analysis
The required information size (RIS) in a meta-analysis of a dichotomous outcome can be calculated as (see the definition ofμandνabove) [11]:
RIS¼ 1
1−D24 Z1−α=2þZβ
2
v θ2
Therefore, RIS emerges as the sample size estimated for a single trial with corresponding power to detect or reject an anticipated intervention effect μ, multi-plied with a factor adjusting for the final expected or the present diversity (D2) in the meta-analysis. PC can be estimated as the pooled unweighted propor-tion of outcomes in the control groups in the in-cluded trials [11, 39–41].
Alternatively, but with equal result, the RIS for a random-effects model can be calculated as:
RIS¼4 Z1−α=2þZβ
2
Vrandom θ2
Where νrandom is the variance in the random-effects model. This is the model variance based calculation of
RIS.
When the required information size has been esti-mated, the meta-analysis can be analysed in relation to the trial sequential monitoring boundaries, constructed as per Lan-DeMets’ critical monitoring boundaries, analogous to the sequential analysis of a single rando-mised trial [17, 42]. Similar to the Zi-value for the i-th cumulative meta-analysis, we use here the ratio between the logarithm of the Mantel-Haenszels weighted relative risik (RRiMH) and its standard error SE[ln(RRiMH)] in a random-effects model, e.g., as suggested by DerSimonian and Laird [44, 45]:
Zi¼ Ln RRiMHð Þ SE Ln RRiMH½ ð Þ
The required information size and the number of required extra trials in a meta-analysis
As per Elena Kulinskaya and John Wood [43], using the same mathematical notation, the sample size of futureK'
equally sized trials with equally sized (ni) intervention and control groups is:
2ni¼ 4σ2
K0 c −τ2
; ð1Þ
whereσ2is the variance in these future trials andτ2the between trial variance in the firstKtrials, andcis a con-stant when the results from previous trials in the random-effects meta-analysis are known being:
c¼ Z1−α=2þZ1−β
=θ
2
−V−R K1ð Þ;
VR−(1K) is the reciprocal of the variance in the random-effects model of the pooled estimate from the firstK tri-als which is equal to SDR−(2K)in a meta-analysis of a con-tinuous outcome. In the examples, given by Kulinskaya and Wood, σ2is determined by the simple unweighted average of the within trial variances in the first K trials [43]. However, as it may be more appropriate to use an estimate of the variance in the future trials which is the weighted average of the pooled squared standard devia-tions from the fixed-effect model, SDF2(K), of the first K trials for continuous outcomes, we propose:
σ2¼SD2
F Kð Þ¼
N⋅SE2F Kð Þ
whereNis the total number of participants in the meta-analysis of the first K trials and SEF(K)2 is the squared pooled standard error in the fixed-effect model. If N’ is the sum of sample sizes from the equally sizedK'future trials, the formula (1) for the sample size in future trials can be rewritten to:
N0
K0¼ 4⋅σ2
K0 c −τ2
¼ 4⋅σ2⋅c
K0−c⋅τ2 and thereby N
0
¼4⋅σ2⋅c 1−c⋅τ2 K0
;
from which it is evident that K’ has to be an integer greater than c⋅τ2 (the minimum required number of extra trials) and that N’ converges to 4 ·σ2⋅c when K’ approaches the infinite as:
Lim K0→∞
4⋅σ2⋅c
1−c⋅τ2 K0 0 @
1
A¼4⋅σ2⋅c¼4⋅SD2FðKÞ⋅c;
meaning thatN’can never be less than 4 ·σ2·c, despite the number of future trials being carried out. Because the random-effects model variance of the firstKtrials is always greater than the fixed-effect model variance of theKfirst trials, we have:
SD2R Kð Þ≥SD2F Kð Þ
4⋅SD2R Kð Þ⋅c>4⋅SD2F Kð Þ⋅c;
and as:c= ([Z1−α/2+Z1−β]/θ)2− SDR(K)−2 , we get
4⋅SDR Kð Þ2⋅ Z1−α=2þZ1−β=θ2−SD−R K2ð Þ
n o
>4⋅SD2
F Kð Þ⋅c¼4σ2⋅c ð2Þ
IfRISis defined as the required information size for a meta-analysis to have as many participants as an equally powered trial to address a hypothesis of the same inter-vention effect. with the random-effects model variance experienced [11] so far, we will have:
RIS¼ 4⋅SD2R Kð Þ⋅Z1−α=2þZ1−β=θ2;
4⋅SD2R Kð Þ⋅ Z1−α=2þZ1−β
=θ
2
−SD−R K2ð Þ
n o
¼4⋅SD2R Kð Þ⋅Z1−α=2þZ1−β=θ2−4 ¼RIS‐4;
and thereby the equation (2) can be rewritten as:
RIS>RIS−4>4⋅SDF K2ð Þ⋅c¼4σ2⋅c;
which shows that RIS is always greater than the mini-mum required extra participants in the final meta-analysis. If VR(K)−1 =SDR(K)−2 is small (close to zero when abundant information has already been collected), the statement thatRIS> 4 ·σ2·cis merely the trivial that the
required information size will be greater than the sample size in one future trial with an anticipated variance ofσ2.
Two scenarios now cover all possible situations:
A) If:RIS−AIS> 4 SDF2(K) c, then we will be able to calculate the corresponding required number (K’RIS-AIS) of future trials to cover the information gap indicated by theRIS-AISparticipants according to formula (1), having:
K’RIS−AIS¼
c⋅τ2
1− 4⋅σ2⋅c RIS−AIS
ð Þ
B) IfRIS−AIS≤4 SDF2(K) c, then the situation is that the extra required information size is less than what is required in one extra trial. The question of whether there is an intervention effect greater or equal toθmay be answered ifRIShas been achieved in the minimal number of required trials.
Moreover, if for example:
RIS−AIS>3⋅4⋅σ2⋅c
withRIS−AIS= 3⋅4⋅σ2⋅cin the formula for K’RIS−AIS, then this leads to:
K’12⋅σ2⋅c¼ c⋅τ2
1− 4⋅σ2⋅c
3⋅4⋅σ2⋅c
and we have:
K’RIS−AIS¼ 3⋅c⋅τ2
2 ¼1:5⋅c⋅τ
2
meaning that the extra number of required trials, K’
RIS−AIS, for the random-effects meta-analysis to be adequately powered using RIS-AIS, would be 50% higher than the minimal required number of trials. In contrast, the minimal required number of trials, c⋅τ2, demands a very large total information size.
The law of reverse implication in mathematical logic
The statistical concepts used in this article
The null hypothesis (H0) is the hypothesis that the mean or the occurence of a certain outcome is precisely the same in the groups compared.
The alternative hypothesis (HA) is the assumed magni-tude of the difference between the means or the occur-ence of a certain outcome in the groups compared.
The P-value is the probability (P) that a specific data-set (D), or something even more extreme, would appear if the null hypothesis is true, that is: P=P(D|H0) which shold be read as: theP-value is equal to the probability of getting the dataset, given the null hypothesis is true.
TheP-value is intuitively difficult to understand and is often wrongly interpreted. In Bayesian statistic, one can obtain results much easier to understand, and the clin-ical significance of a result from a trial or a meta-analysis may, therefore, be easier to achieve. One can present, e.g., the »reverse« probability, being how large is the probability that the null hypothesis is true given a specific dataset (D) from a trial or a meta-analysis:
P(H0|D). Furthermore, how large is the probability that an alternative hypothesis is true given a specific dataset from a trial or a meta-analysis can be expressed as the
‘alternative’P-value:P(HA|D).
Bayes factor (BF) is the ratio between the P-value and the alternativeP-value:BF=P(D|H0)/P(D|HA).
Due to Bayes theorem, we have:
PðH0DÞ ¼PðDH0Þ⋅PðH0Þ=PðDÞ:
A cumulative meta-analysis is a meta-analysis where the result data from the last conducted trial are added to the result data from all the previous trials and tested on the accumulated number of participants.
The Z-value is the general name for the test statistics, e.g., the t-value in a student’s t-test or aχ2-test statistic in aχ2-test or the Mantel-Haenszels test statistic. When the theoretical distribution of the test statistic is known, theZ-value can be converted into aP-value.
A cumulative Zi-value is the test statistic calculated after addition of the data from thei-th trial.
Abbreviations
ϴ:Intervention effect;α: Maximally allowed type 1 error;AIS: Acquired information size in a meta-analysis;β: Maximally allowed type 2 error; BF: Bayes factor;D2: Statistical diversity (D-square);H0: Null hypothesis; HA: Alternative hypothesis;I2: Statistical inconsistency (I-square);Ln: Natural logarithm;P(D|H0): Probability of getting dataset if the null hypothesis is true; RIS: Required information size in a meta-analysis;RR: Relative risk;
SD: Standard deviation;SE: Standard error;SS: Sample size; TSA: Trial sequential analysis; TTM Trial: Target Temperature Management Trial; Zi: Cumulative zi-statistics
Acknowledgements
We thank Ema Erkocevic Petersen, M.Sci. Biomedical Engineering and Informatics, Data Manager at Copenhagen Trial Unit for the excellent art work on figures in this article. We thank Dimitrinka Nikolova, M.A. in English Philology, Co-ordinating Editor of The Cochrane Hepato-Biliary Group, for thorough reading and correcting the language of the article text.
Funding
The work on this article has exclusively been funded by the Copenhagen Trial Unit with no other funding involved.
Availability of data and materials
TSA software and Manual are available at http://www.ctu.dk/tsa/for free. Data for the motivating example are available from (16–18).
Authors’contribution
JW, JCJ, and CG conceived the idea for this manuscript. JW wrote the first draft of the manuscript. JCJ and CG critically revised the manuscript. All authors read and approved the final version of the manuscript.
Competing interest
None of the authors have financial interests related to this article. JCJ does not have any other known competing interests. JW and CG are members of the task force to develop theory and software for Trial Sequential Analysis at the Copenhagen Trial Unit.
Consent for publication
Not applicable since no individual patient data are presented.
Ethics approval and consent to participate
Not applicable.
Author details
1Copenhagen Trial Unit, Centre for Clinial Intervention Research, Dpt. 7812,
Rigshospitalet, Copenhagen University Hospital, Blegdamsvej 9, DK-2100 Copenhagen, Denmark.2Centre for Research in Intensive Care, Rigshospitalet, Copenhagen University Hospital, Blegdamsvej 9, DK-2100 Copenhagen, Denmark.3Department of Cardiology, Holbæk Hospital, DK-4300 Holbæk,
Denmark.4The Cochrane Hepato-Biliary Group, Copenhagen Trial Unit,
Centre for Clinial Intervention Research, Dpt. 7812, Rigshospitalet, Copenhagen University Hospital, Blegdamsvej 9, DK-2100 Copenhagen, Denmark.
Received: 2 May 2016 Accepted: 22 February 2017
References
1. Turner RM, Bird SM, Higgins JP. The impact of study size on metaanalyses: examination of underpowered studies in Cochrane reviews. PLoS One. 2013; 8:e59202.
2. Pereira TV, Ioannidis JP. Statistically significant metaanalyses of clinical trials have modest credibility and inflated effects. J Clin Epidemiol. 2011;64:1060–9.
3. AlBalawi Z, McAlister FA, Thorlund K, Wong M, Wetterslev J. Random error in cardiovascular meta-analyses: how common are false positive and false negative results? Int J Cardiol. 2013;168:1102–7.
4. Imberger G. Multiplicity and sparse data in systematic reviews of anaesthesiological interventions: a cause of increased risk of random error and lack of reliability of conclusions? Ph.D. Thesis. Copenhagen: Copenhagen University, Faculty of Health and Medical Sciences; 2014. 5. Brok J, Thorlund K, Wetterslev J, Gluud C. Apparently conclusive metaanalyses
may be inconclusive—trial sequential analysis adjustment of random error risk due to repetitive testing of accumulating data in apparently conclusive neonatal metaanalyses. Int J Epidemiol. 2009;38:287–98.
6. Thorlund K, Imberger G, Walsh M, Chu R, Gluud C, Wetterslev J, Guyatt G, Devereaux PJ, Thabane L. The number of patients and events required to limit the risk of overestimation of intervention effects in meta-analysis—a simulation study. PLoS One. 2011;6:e25491.
7. Wetterslev J, Thorlund K, Brok J, Gluud C. Trial sequential analysis may establish when firm evidence is reached in cumulative meta-analysis. J Clin Epidemiol. 2008;61:64–75.
8. Pogue J, Yusuf S. Cumulating evidence from randomised trials: utilizing sequential monitoring boundaries for cumulative meta-analysis. Control Clin Trials. 1997;18:580–93.
9. Pogue J, Yusuf S. Overcoming the limitations of current meta-analysis of randomised controlled trials. Lancet. 1998;351:47–52.