65
Chapter 5: Farmer-Oriented Assessment of Soil Quality using Field, Laboratory,
and VNIR Spectroscopy Methods
, Abawi . S . G , Moebius . N . B , Gugino . K . B , Schindelbeck . R . R , Idowu . J . O , Ball . I . J , van Es . M . H
D.W. Wolfe, and J.E. Thies ed . cornell @ 1 hmv : email ABSTRACT
Soil quality and health are terms describing similar concepts, but the latter appeals to farmers and
crop consultants as part of a holistic approach to soil management. We therefore regard soil health
as the integration of the physical, biological and chemical aspects of soils. This paper describes a
process for the selection of soil quality/health indicators that are being offered as part of the new
Cornell Soil Health Test. Over 1500 samples were collected from controlled research and
experiments and commercial farms and analyzed for 41 potential soil quality indicators. Physical
and biological indicators were evaluated based on sensitivity to management, relevance to
functional soil processes, ease and cost of sampling, and cost of analysis, and four indicators were
selected for each. Eleven chemical indicators were selected as they constitute the standard soil
test. Soil health test reports were developed to allow for overall assessment, as well as the
identification of specific soil constraints. The new soil health test is being offered on a for-fee basis
starting in 2007. In addition, visible near infrared reflectance spectroscopy was evaluated as a tool
for rapid soil health assessment, presumably at lower cost. The methodology appears to show
66
was developed for integrative assessment of the physical, biological, and chemical aspects of soils,
thereby facilitating better soil management.
Introduction
Soil Quality and Health
Soil quality includes an inherent and a dynamic component (Carter, 2002; Larson and
Pierce, 1991). The former is an expression of the soil forming factors (Brady and Weil, 2002), often
documented by soil surveys (NRCS, 1993). Dynamic soil quality, on the other hand, generally refers
to the condition of soil that is changeable in a short period of time by human impact, including
agricultural management practices (Carter, 2002; Karlen et al., 1997; Magdoff and van Es, 2000;
Mausbach and Seybold, 1998; Wienhold et al., 2004).
Biological and chemical processes, such as root growth, organic matter turnover,
macrofauna activity, bacterial and fungal proliferation, and cation charge density on the exchange
complex influence pore size distribution, density and stability of soil structure (Amezketa, 1999). In
turn, the physical structure of a soil plays an integral role in controlling chemical and biological
processes (Dexter, 2004). A high proportion of stable aggregates in an agricultural soil is desirable,
especially in fine- and medium-textured soils, as they sustain a range of pore sizes and promote
aeration, water infiltration, and drainage (Kemper and Rosenau, 1986), as well as better soil
workability, seed bed quality (Topp et al., 1997), and easy root penetration (Czyz, 2004).
Agricultural management practices such as tillage, traffic patterns, crop rotation practices, cover
crops and organic matter additions strongly influence the components of soil quality and thus crop
performance (Doran and Parkin, 1994; Francis and Kemp, 1990).
With farmer audiences, the term “soil health” is often preferred over soil quality as it
connotes a holistic approach to soil management, including the integration of physical, biological
and chemical processes (Idowu et al., 2007). In the past, an overemphasis on chemical soil
67
introduction of inorganic fertilizers soil fertility management mostly involved a two-stage process
where organic nutrient sources were added to the soil, followed by mineralization through soil
biological processes, and inorganic nutrients were subsequently available to the crops. Magdoff
and van Es (2000) argue that with inorganic fertilizers the nutrition of plants has been short-cut and
the limited organic sources do not adequately sustain important biological processes and the
associated physical benefits (e.g., aggregation). A new emphasis on soil health through the
linkages between the chemical, biological and physical processes therefore provides a useful
framework to discuss soil management in the age of diverse cropping systems with tools such as
organic and inorganic fertilizers, reduced tillage, cover cropping, new rotations, etc.
Soil Quality Assessment
Traditional soil testing, which is equivalent to the assessment of soil chemical quality for
crop nutrition, has provided farmers and consultants around the world with relevant information for
fertilizer and lime management. In the more holistic soil health paradigm, new inexpensive soil
tests are needed to provide an integrative assessment of the triad of soil quality domains (physical,
biological and chemical). Such a soil test would need to involve soil quality indicators that represent
soil processes relevant to soil functions, and also provide information that is useful for practical soil
management. In this context, soil health is best assessed through soil properties that are sensitive
to changes in management (Brejda et al., 2000a; Doran and Parkin, 1996; Larson and Pierce,
1991).
Sojka and Upchurch (1999) argued that the optimization of processes may require different
interpretations of soil quality indicators for the different soil functions. Our approach gets around
that issue by focusing on the soil processes that are relevant to the single function of crop
production. Additionally, we place emphasis on the valuable information that is acquired from
measurement of the soil quality indicators, rather than an interpretation within a narrowly-defined
68
and consultants in that it identifies soil constraints and aids the selection of management solutions
(Idowu et al., 2007). The interpretation of the test results thus requires professional judgment and
placement into the context of the cropping system and farm characteristics. For example, soil
health test results from a dairy farm require different interpretation and management approaches
than for a viticulture operation. The former generally wants to maximize forage production and
enjoys the availability of organic nutrient sources. The latter farm often wants to focus on
optimizing wine quality, which requires suboptimal growing conditions and some nutrient and water
stress during the early growing season (White, 2003; van Leeuwen et al., 2004). In this respect,
soil health testing must be similar to human health assessment where the results of tests (blood,
NRI, etc.) are interpreted by medical experts within the broader context of a patients’ medical
history, lifestyle and financial situation.
Cornell Soil Health Test Development
General Approach
The Cornell Soil Health Initiative included the development of a new three-faceted soil
health test for the following reasons:
• Education: Farm-specific soil quality information facilitates discussion.
• Targeting management practices: Identified soil constraints can be addressed, while no
investments are needed in unsubstantiated problems.
• Quantifying soil degradation or aggradation from management: Farmers, consultants, and
applied researchers can evaluate the soil quality benefits of new management practices (e.g.,
conversion to no-tillage). Governments can link green payments to soil quality improvements.
• Soil inventory assessment: Evaluation of the dynamic soil quality in addition to the traditional
69
• Land valuation: Effective quantification of soil quality allows for better assessment of the
monetary value of land for purchasing and rental transactions, thereby facilitating monetary
rewards for good land management.
The development of the soil health test involved a triage of potential soil quality indicators and
streamlining of methodologies (Fig. 2). Forty-one potential soil health indicators were evaluated
(Table 1). The suitability of the soil properties as quality indicators was evaluated through samples
from (i) long-term research experiments related to tillage, rotation and cover cropping studies that
allowed for assessment of soil response under controlled conditions, and (ii) commercial farms that
provided real-world perspective under the range of soil management conditions in New York State.
The latter included samples from grain, dairy, vegetable, and fruit operations, and a wide range of
soil types. In total, over 1500 samples were included in the evaluation, although not all 41
properties were measured on all. For the controlled experiments, soil samples were collected four
times over the course of the 2004 growing season to evaluate within-season variability.
For all management units, two undisturbed soil core samples were collected from the 5 to
66-mm depth using stainless steel rings (61 66-mm height, 72 66-mm ID, 1.5 66-mm wall thickness). Disturbed
samples were collected from the 5 to 150 mm depth using trowels. All samples were stored at 2oC
until analysis.
A detailed description of the specific methodologies used for all 41 potential indicators is beyond
the scope of this paper. Analysis of the chemical indicators was based on the standard soil fertility
test offered by the Cornell Nutrient Analysis Laboratory. The physical tests were based on standard
methodology (Moebius, et al., 2007), except for wet aggregate stability which involved the
application of simulated rainfall of known energy (Ogden et al., 1997) to aggregates on sieves (van
Es et al., 2007). The biological test also mostly involved established methods. The decomposition
rate was based on loss of filter paper volume after 3-week soil incubation. The active Carbon test
70
assessment involved a bioassay method where snap bean seed were planted in the sampled soil
material and root damage was rated based on root morphological features (Gugino et al., 2007).
Indicator selection
The 11 soil chemical indicators were automatically adopted in the comprehensive soil health test as
it involves a well-established set of procedures that are widely offered at reasonable cost. The
general criteria used for physical and biological indicator selection into the test included (as
described by Moebius et al., 2007):
Sensitivity to management, i.e., frequency of significant treatment effects in the controlled
experiments and directional consistency of these effects.
Precision of measurement method, i.e, CV values associated with residual errors.
Relevance to functional soil processes such as aeration, water infiltration/transmission, water
retention, root proliferation, nitrogen mineralization, development of root diseases, etc.
Ease and cost of sampling
Cost of analysis.
Qualitative ratings for sensitivity to sampling error and ability to represent four soil functional
processes were assigned using relationships established in the literature (Andrews et al., 2004;
Larson and Pierce, 1991; Luxmoore, 1981) and experience from this study. Quantitative data were
obtained from data analyses (e.g. consistency of treatment effects and reproducibility) and sample
processing (e.g. cost of labor, equipment and supplies). Many of the soil physical properties were
rejected as suitable indicators due to the requirement for undisturbed samples, or due to high
variability. Many soil biological indicators were rejected due to the high cost of analysis, often
71
Selected Test Indicators
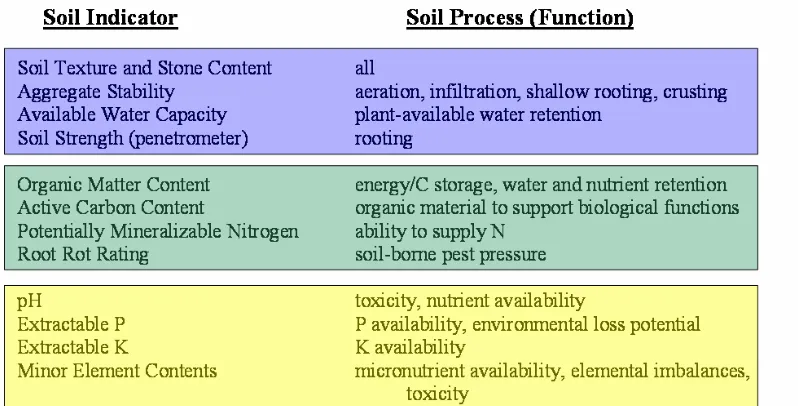
Fig. 3 shows the selected physical, biological and chemical indicators for the soil health test. The
test requires penetrometer data as the only measurements made in the field. The remaining
indicators are based on a composited disturbed sample, which we recommend are obtained from 2
locations nested within five sites in a field or section. Although it is widely regarded as essential, we
did not select bulk density as an indicator, because we found it imprecise and correlated with other
physical indicators (thereby redundant). Moreover, the use of ring samplers proved to be a serious
obstacle with practitioners, and additionally added to unreliable results.
The properties can be considered as indicators of different soil processes (Fig. 3). The soil
health test thereby evaluates the soil’s ability to accommodate most of the relevant processes
relevant to crop production and soil hydrology. Soil texture is an integrative property and is also
used to interpret test results. Root health assessment is an integrative biological measurement
related to overall pressure from soil-borne disease organisms. The minor elements of the chemical
analysis were grouped to prevent an overemphasis on chemical quality characteristics.
The Cornell Soil Health Test is being offered as a for-fee service starting in 2007 at a price
of US $45 per sample (including the standard chemical test), and at subsidized rates ($20) for New
York farmers. Samples will only be received during the early spring, prior to tillage (15 April to 1
June), because some indicators were shown to have significant within-season variability (Moebius
et al., 2007), and the tillage practice is a confounding influence for soil physical and biological
indicators. Also, sampling is then facilitated by soil water conditions near field capacity, and
biological assessments benefit from the more uniform conditions following overwintering.
Data Interpretation and Scoring Curves
Effective use of soil health test results requires the development of an interpretive framework for the
72
scoring functions were developed for all soil indicators (except texture) to rate test results. Different
scoring functions were developed for the three main textural classes, sand, silt, and clay, hence the
necessity to determine soil texture during the testing procedure (which is done by the rapid and
inexpensive “feel method”).
The scoring functions were defined in the simple linear-plateau framework, as no
justification existed for curvilinear functions. Three types of scoring functions were considered (Fig.
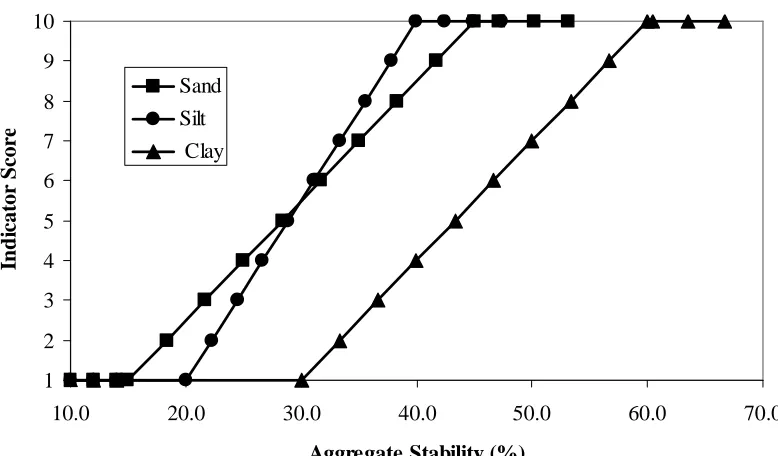
4), “more is better”, “less is better”, and “optimum”. The scoring curves for aggregate stability (Fig.
5) is an example of the “more is better” relationship. A low score of 1 is assigned to results of less
than 15, 20 and 30% for sand, silt and clay soils, respectively. Respective aggregate stability
values of greater than 40, 45 and 60% are scored as 10, and intermediate values are linearly
interpreted. The critical cutoff values for the highest and lowest curves were developed based on
the frequency distribution of data generated from the indicators selection process. The 25th and 75th
percentile of the distribution curve were generally taken as the extreme values for the linear model
where scores increase from 1 to 10. i.e., test results with values less than the 25th percentile were
given scores of 1, and greater than the 75th percentile were given scores of 10. This approach was
evaluated relative to literature reports and in some cases minor modifications were made. Scoring
curves for all indicators are discussed in Gugino et al. (2007).
Soil Health Test Report
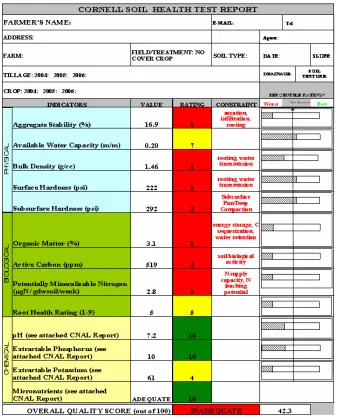
The soil health test report has been designed to facilitate integrative assessment on the one
hand, and targeted identification of soil constraints on the other. This is accomplished through the
combined use of quantitative results and color coding (Fig. 6). The physical, biological and
chemical indicators are grouped by blue, green, and yellow colors, respectively. For each indicator,
the measured value is reported as well as the associated score (using a scoring function). The
latter is interpreted with colors in that scores of less than three receive a red code, scores greater
73
overview of the test report. If results are coded red, the associated soil constraints are additionally
listed (Fig. 6). Finally, the percentile rating is shown for each indicator, based on the sample’s
ranking in the data base. An overall soil health score is provided at the bottom of the report, which
is standardized to 100. It is noted that the interpretation of the test results are generalized for most
dryland field, vegetable and fruit crop production systems, but may require alternative interpretation
in some cases. Hence, we recommend that the reports are interpreted by professional consultants
and include consideration of farm and crop-specific information.
Soil management recommendations were developed to address specific soil management
constraints. Both short-term and long-terms approaches were identified, but their discussion is
beyond the scope of this paper. A training manual (Gugino et al., 2007) was developed which
discusses soil health concepts, the basic approaches to soil health assessment (including sampling
methods, and field and laboratory assessment protocols), the reporting and interpretation of the
results, and the suggested management approaches. The manual can be accessed and
downloaded from the Cornell Soil Health web site at http://soilhealth.cals.cornell.edu.
Use of Reflectance Spectroscopy for Rapid Assessment
Although the cost of the Cornell Soil Health Test is quite reasonable, a more inexpensive
assessment approach is desirable. We evaluated the use of Visible- Near Infrared Reflectance
Spectroscopy (VNIRRS) for more rapid and less expensive assessment of the soil quality
indicators.
Potential of Methodology
In VNIRRS, soil reflectance characteristics are determined over the entire visible
(350-700nm) and near infrared (700-2500nm) region with the use of a spectroradiometer. In these
wavelength regions overtones of unique absorption features can be measured due to stretching and
bending vibrations in molecular bonds such as C-C, C-H, N-H and O-H (Dalal and Henry, 1986).
74
measured soil properties. More than thirty soil variables were predicted simultaneously with
variable level of success by Chang et al.(2001), and they reported successful predictions (r2> 0.80)
for total organic carbon and nitrogen (g kg-1), gravimetric soil moisture content, 1.5 Mpa soil water at
wilting point (kg kg-1), exchangeable calcium, CEC (cmolc kg-1), silt and sand (%). Brown et
al.(2005) used over 4100 surface and subsurface soils across the United States, Africa and Asia to
evaluate the accuracy of VNIR empirical models for global soil characterization and reported strong
predictability for kaolinite content, montmorillonite content, clay content, CEC, SOC, inorganic C,
and extractable Fe. The prediction of soil constituents that do not absorb within the VNIR range is
often possible through their correlations with spectrally active constituents (Ben- Dor and Banin,
1995), but this can create a false sense of predictability and should not be extrapolated beyond the
data set.
Methodology
Three hundred eighty seven soil samples from a wide range of soils and management
practices in New York State were scanned using a FieldSpec Pro hyperspectral sensor (Analytical
Spectral Devices, Inc., Boulder, Colorado) and the absolute reflectance of samples was recorded
from 350 to 2500 nm at 1-nm resolution, yielding a total 2150 data points per spectrum. Air dried
soil samples were put into optical quality petri dishes with 4 cm diameter and illuminated with a
tungsten quartz halogen lamp. Reflectance was recorded through the glass bottom of each dish
with a constant angle and 4 cm distance from the light source. Five consecutive readings were
averaged, then the sample was rotated 90o and five additional readings were collected to avoid
possible spectral differences originating from particle size variations within soil samples. The unit
was regularly calibrated using standards (Spectralon, Soil and Kaolinite).
Reflectance data were translated from binary to ASCII using ViewspecPro (Analytical
Spectral Devices, Inc., Boulder, CO, 80301) and readings were averaged. Five types of spectral
data were used in the analysis: (i) raw reflectance(untransformed), (ii) first-derivative
75
and (iv) moving averages of 5 and 11 reflectance observations, and (v) absorbance transformation
(1/reflectance) using Unscrambler v 8.05 software (CAMO Process, Oslo, Norway).
Calibrations between VNIRRS data and soil parameters were performed using both Partial
Least Square regression (PLS) and Multivariate Adaptive Regression Splines (MARS) analysis (the
latter not reported here). PLS regression is often applied to spectral data. Unlike multiple linear
regression, it can handle data with strong co-linearity in independent variables, which can be more
numerous than the observations. PLS regression was also performed using Unscrambler software.
The measured indicators are listed in Table 2 and include a wider range of properties than
those eventually selected for the soil health test. The data sets for each indicator were separated
into two-third and one-third of the data. The former was used for calibration and the latter for
independent validation. The independent validation approach generally provides a more realistic
estimate of the predictability of the regression procedure, but also results in lower correlation
statistics.
VNIRRS results
The use of raw reflectance data generally provided the best validated prediction accuracy
(Table 2 for the case of active C). First-derivative processing apparently is not needed, presumably
because a consistent light source is used. The use of moving averages, often promoted to reduce
data noise, did not improve predictability either.
Preliminary results indicate that some soil indicators are well predicted, while others are not
(Table 3). Organic matter and active C showed high predictability (r>0.89), which can be expected
based on the fact that VNIRRS directly assesses many of the molecular bonds that make up soil
organic matter. Some soil physical (hardness) and biological properties (potentially mineralizable
N) had poor prediction results, presumably due to limited involvement or effects of the molecular
bonds. Several other properties showed reasonable predictability, but in some cases presumably
76
exchangeable acidity is also well predicted, which may be expected based on its relation to organic
matter content and mineralogy.
Conclusion
Soil health management requires an integrated approach that recognizes the physical, biological
and chemical aspects and processes in soils. The development of an integrated soil health test was
seen as a research priority to allow farmers to make better management decision, especially those
other than basic fertilizer management. From a total of 41 potential indicators, a set of
measurements were selected to represent an integrative assessment of soil health, which is now
being offered on a for-fee basis. It is anticipated that some of the indicators may in the future be
assessed through VNIRRS, but it is unlikely that this methodology will completely replace laboratory
and field measurements.
Acknowledgements
We acknowledge support from the USDA Northeast Sustainable Agriculture Research and
Education Program (USDA 2003-3860-12985), the Northern New York Agricultural Development
Program, and USDA-Hatch funds .
References
Amezketa, E. 1999. Soil aggregate stability: A review. Journal of Sustainable Agriculture 14:83-151.
Andrews, S.S., and C.R. Carroll. 2001. Designing a soil quality assessment tool for sustainable
agroecosystem management. Ecological Applications 11:1573-1585.
Andrews, S.S., D.L. Karlen, and C.A. Cambardella. 2004. The soil management assessment
framework: A quantitative soil quality evaluation method. Soil Science Society of America
77
Ben-Dor, E., Banin, A., 1995. Near infrared analysis as a rapid method to simultaneously evaluate
several soil properties. Soil Sci.Soc. Am. J. 59, 364- 372.
Brady, N.C., and R.R. Weil. 2002. The Nature and Properties of Soils. 13 ed. Pearson Eduction,
Inc., Upper Saddle River, NJ.
Brejda, J.J., T.B. Moorman, D.L. Karlen, and T.H. Dao. 2000. Identification of regional soil quality
factors and indicators: I. Central and southern high plains. Soil Science Society of America
Journal 64:2115-2124.
Brown, D.J., Shepherd, K.D., Walsh, M.G., Mays, M.D., Reinsch, T.G., 2005. Global soil
characterization with VNIR diffuse reflectance spectroscopy. Geoderma. Vol. 132. Issue. 2-3.
p.273-290.
Carter, M.R. 2002. Soil quality for sustainable land management: Organic matter and aggregation
interactions that maintain soil functions. Agronomy Journal 94:38-47.
Chang C. W., Laird, D.A, Mausbach, M.J., Maurice, J., Hurburgh, J.R., (2001). Near-Infrared
reflectance spectroscopy –principal components regression analyses of soil properties. Soil
Science Society of America Journal 65, 480-490.
Czyz, E.A. 2004. Effects of traffic on soil aeration, bulk density and growth of spring barley. Soil and
Tillage Research 79:153-166.
Dalal, R.C, Henry, R.J., 1986. Simultaneous determination of moisture, organic carbon, and total
nitrogen by near infrared reflectance spectrophotometry. Soil Science Society of America
Journal 50, 120-123.
Dexter, A.R. 2004. Soil physical quality - Preface. Soil and Tillage Research 79:129-130.
Doran, J.W., and T.B. Parkin. 1994. Defining and assessing soil quality, In J. W. Doran, et al., eds.
Defining Soil Quality for a Sustainable Environment., Vol. 35. Soil Science Society of America,
78
Francis, G.S., and R.A. Kemp. 1990. Morphological and hydraulic-properties of a silt loam soil in
New-Zealand as affected by cropping history. Soil Use and Management 6:145-151.
Gugino, B.K., Idowu, O.J., Schindelbeck, R.R., van Es, H.M., Wolfe, D.W., Thies, J.E. and Abawi,
G.S. 2007. Cornell Soil Health Assessment Training Manual, Edition 1.1., Cornell University,
Geneva, NY.
Idowu, O.J. H. van Es, R. Schindelbeck, G. Abawi; D. Wolfe; J. Thies; B. Gugino; B. Moebius; and
D. Clune. 2007. The new Cornell Soil Health Test: Protocols and interpretation. What’s
Cropping Up? 17, 2.
Karlen, D.L., M.J. Mausbach, J.W. Doran, R.G. Cline, R.F. Harris, and G.E. Schuman. 1997. Soil
quality: A concept, definition, and framework for evaluation. Soil Science Society of America
Journal 61:4-10.
Kemper, W.D., and R.C. Rosenau. 1986. Aggregate stability and size distribution, p. 425-442, In A.
Klute, et al., eds. Methods of Soil Analysis Part I - Physical and Mineralogical Methods, 2nd ed.
American Society of Agronomy, Inc., Madison, WI.
Larson, W.E., and F.J. Pierce. 1991. Conservation and enhancement of soil quality, pp. 175-203
Evaluation for sustainable land management in the developing world, Conference, IBSRAM
Proc.,12th, Vol. 2. Int. Board for Soil Res. and Manage., Jatujak Thailand, Bangkok, Thailand.
Luxmoore, R.J. 1981. Micro-, meso-, and macroporosity of soil. Soil Science Society of America
Journal 45:671.
Magdoff, F., and H. van Es. 2000. Building Soils for Better Crops Sustainable Agriculture Network,
Burlington, VT.
Mausbach, M.J., and C.A. Seybold. 1998. Assessment of soil quality, p. 33-43, In R. Lal, ed. Soil
79
Moebius, B.N., H.M. van Es, R.R. Schindelbeck, O.J. Idowu, J.E. Thies, D. J. Clune. 2007.
Evaluation of Laboratory-Measured Soil Physical Properties as Indicators of Soil Quality. Soil
Science (in review).
NRCS, S.S.D.S. 1993. Soil Survey Manual.
Ogden, C.B., H.M. van Es, and R.R. Schindelbeck. 1997. Miniature rain simulator for field
measurement of soil infiltration. Soil Science Society of America Journal 61:1041-1043.
Sojka, R.E., and D.R. Upchurch. 1999. Reservations regarding the soil quality concept. Soil
Science Society of America Journal 63:1039-1054.
Topp, G.C., W.D. Reynolds, F.J. Cook, J.M. Kirby, and M.R. Carter. 1997. Physical attributes of soil
quality, p. 21-58, In E. G. G. a. M. R. Carter, ed. Soil Quality for Crop Production and
Ecosystem Health, Vol. 25. Elsevier, New York.
Van Leeuwen, van Es, H.M., R.R. Schindelbeck, A. Melkonian, B.N. Moebius, and O.J. Idowu.
2006. Assessment of soil aggregate stability using small rainfall simulators. Department of Crop
and Soil Sciences Research Series 06-01, Cornell University, Ithaca, NY.
Wienhold, B.J., S.S. Andrews, and D.L. Karlen. 2004. Soil quality: A review of the science and
80 TABLES AND FIGURES
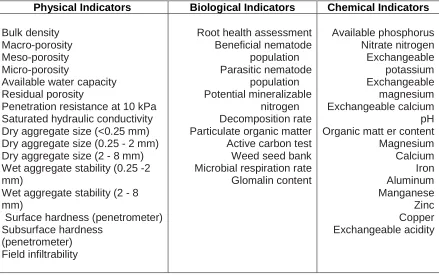
Table 1. Forty-one soil health indicators evaluated for the Cornell Soil Health Test.
Physical Indicators Biological Indicators Chemical Indicators
Bulk density Macro-porosity
Meso-porosity Micro-porosity
Available water capacity Residual porosity
Penetration resistance at 10 kPa Saturated hydraulic conductivity Dry aggregate size (<0.25 mm) Dry aggregate size (0.25 - 2 mm) Dry aggregate size (2 - 8 mm) Wet aggregate stability (0.25 -2 mm)
Wet aggregate stability (2 - 8 mm)
Surface hardness (penetrometer) Subsurface hardness
(penetrometer) Field infiltrability
81
Table 2. Comparison of the five VNIRRS data processing methods for the assessment of active carbon.
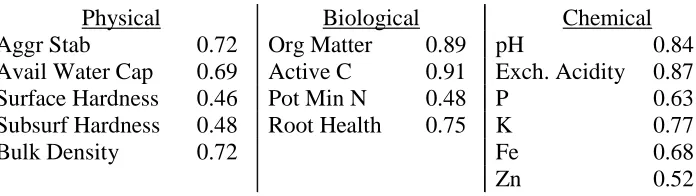
Table 3. Independent validation results (r-values) of VNIRRS assessment of physical, biological and chemical soil quality indicators.
Physical Biological Chemical
Aggr Stab 0.72 Org Matter 0.89 pH 0.84
Avail Water Cap 0.69 Active C 0.91 Exch. Acidity 0.87
Surface Hardness 0.46 Pot Min N 0.48 P 0.63
Subsurf Hardness 0.48 Root Health 0.75 K 0.77
Bulk Density 0.72 Fe 0.68
Zn 0.52
Transformation Calibration R Prediction R RMSEP
Raw Reflectance 0.937688 0.909083 97.1329
Moving Average (11) 0.913118 0.895234 98.97735
Moving Average (5) 0.90656 0.887433 102.3762
Absorbance 0.876416 0.834978 122.5278
[image:17.595.82.430.465.563.2]82
Fig. 1: Conceptual view of soil health, connoting the integration of chemical, biological and physical processes.
Chemical
Physical
Biological
Chemical
Physical
Biological
83
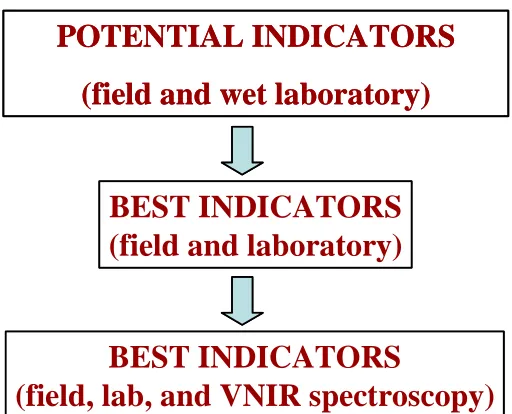
Fig. 2. Approach to the refinement and streamlining of soil quality indicators
POTENTIAL INDICATORS
(field and wet laboratory)
BEST INDICATORS
(field and laboratory)
BEST INDICATORS
(field, lab, and VNIR spectroscopy)
POTENTIAL INDICATORS
(field and wet laboratory)
BEST INDICATORS
(field and laboratory)
BEST INDICATORS
84
Fig. 3. Soil quality indicators included in the Cornell Soil Health Test, and associated processes.
Fig. 4. Models of scoring curves used for the interpretation of measured values of soil quality indicators.
1 10
1 10
1 10
Optimum
[image:20.595.93.517.587.716.2]85
Fig. 5. Scoring curves used for interpretation of aggregate stability data for sand, silt, and clay soils.
1 2 3 4 5 6 7 8 9 10
10.0 20.0 30.0 40.0 50.0 60.0 70.0
Aggregate Stability (%)
In
d
ic
a
to
r
S
co
re
Sand Silt
86
[image:22.595.98.435.148.567.2]