Biogeosciences, 10, 1323–1336, 2013 www.biogeosciences.net/10/1323/2013/ doi:10.5194/bg-10-1323-2013
© Author(s) 2013. CC Attribution 3.0 License.
EGU Journal Logos (RGB)
Advances in
Geosciences
Open Access
Natural Hazards
and Earth System
Sciences
Open AccessAnnales
Geophysicae
Open AccessNonlinear Processes
in Geophysics
Open AccessAtmospheric
Chemistry
and Physics
Open AccessAtmospheric
Chemistry
and Physics
Open Access DiscussionsAtmospheric
Measurement
Techniques
Open AccessAtmospheric
Measurement
Techniques
Open Access DiscussionsBiogeosciences
Open Access Open Access
Biogeosciences
Discussions
Climate
of the Past
Open Access Open Access
Climate
of the Past
Discussions
Earth System
Dynamics
Open Access Open Access
Earth System
Dynamics
DiscussionsGeoscientific
Instrumentation
Methods and
Data Systems
Open Access
Geoscientific
Instrumentation
Methods and
Data Systems
Open Access DiscussionsGeoscientific
Model Development
Open Access Open Access
Geoscientific
Model Development
DiscussionsHydrology and
Earth System
Sciences
Open AccessHydrology and
Earth System
Sciences
Open Access DiscussionsOcean Science
Open Access Open Access
Ocean Science
Discussions
Solid Earth
Open Access Open Access
Solid Earth
Discussions
The Cryosphere
Open Access Open Access
The Cryosphere
DiscussionsNatural Hazards
and Earth System
Sciences
Open Access
Discussions
Modeling the impact of soil aggregate size on selenium
immobilization
M. F. Kausch and C. E. Pallud
Department of Environmental Science, Policy, and Management, University of California, Berkeley, USA
Correspondence to: C. E. Pallud ([email protected])
Received: 4 July 2012 – Published in Biogeosciences Discuss.: 6 September 2012 Revised: 9 February 2013 – Accepted: 11 February 2013 – Published: 1 March 2013
Abstract. Soil aggregates are mm- to cm-sized microporous
structures separated by macropores. Whereas fast advective transport prevails in macropores, advection is inhibited by the low permeability of intra-aggregate micropores. This can lead to mass transfer limitations and the formation of ag-gregate scale concentration gradients affecting the distribu-tion and transport of redox sensitive elements. Selenium (Se) mobilized through irrigation of seleniferous soils has emerged as a major aquatic contaminant. In the absence of oxygen, the bioavailable oxyanions selenate, Se(VI), and se-lenite, Se(IV), can be microbially reduced to solid, elemen-tal Se, Se(0), and anoxic microzones within soil aggregates are thought to promote this process in otherwise well-aerated soils.
To evaluate the impact of soil aggregate size on selenium retention, we developed a dynamic 2-D reactive transport model of selenium cycling in a single idealized aggregate surrounded by a macropore. The model was developed based on flow-through-reactor experiments involving artificial soil aggregates (diameter: 2.5 cm) made of sand and contain-ing Enterobacter cloacae SLD1a-1 that reduces Se(VI) via Se(IV) to Se(0). Aggregates were surrounded by a constant flow providing Se(VI) and pyruvate under oxic or anoxic conditions. In the model, reactions were implemented with double-Monod rate equations coupled to the transport of pyruvate, O2, and Se species. The spatial and temporal
dy-namics of the model were validated with data from experi-ments, and predictive simulations were performed covering aggregate sizes 1–2.5 cm in diameter.
Simulations predict that selenium retention scales with ag-gregate size. Depending on O2, Se(VI), and pyruvate
concen-trations, selenium retention was 4–23 times higher in 2.5 cm aggregates compared to 1 cm aggregates. Under oxic
condi-tions, aggregate size and pyruvate concentrations were found to have a positive synergistic effect on selenium retention. Promoting soil aggregation on seleniferous agricultural soils, through organic matter amendments and conservation tillage, may thus help decrease the impacts of selenium contami-nated drainage water on downstream aquatic ecosystems.
1 Introduction
understanding of selenium transport and retention in surface soils will improve the management of seleniferous soils to diminish the risk of contamination for downstream ecosys-tems.
The transport and biogeochemical behavior of selenium depend greatly on its chemical speciation. Selenium occurs naturally in four oxidation states – Se(-II), Se(0), Se(IV) and Se(VI). The primary oxidation states associated with irrigation-induced contamination, Se(VI) and Se(IV), occur as the bioavailable oxyanions selenate (SeO2−4 )and selen-ite (SeO2−3 ) (Dungan and Frankenberger, 1999). Elemen-tal selenium (Se(0)) is solid and immobile, whereas Se(-II) occurs in soluble and bioavailable organo-selenides or in gaseous methylated forms (Hamilton, 2004; Stolz and Orem-land, 1999). Transformations between these various species are kinetically hindered and thus the speciation of selenium is poorly predicted by thermodynamic models (Luoma and Presser, 2009). Redox reactions are catalyzed primarily by microorganisms, the transformation of Se(VI) to Se(IV) and Se(0) for example, is driven predominantly by microbial dis-similatory reduction (Stolz and Oremland, 1999). This reduc-tion reacreduc-tion yielding solid Se(0) is an important attenuareduc-tion pathway for selenium in surface environments (Darcheville et al., 2008; Dungan and Frankenberger, 1999; Strawn et al., 2002; Oremland et al., 1991; Steinberg and Oremland, 1990). The known microorganisms capable of selenium reduction are scattered across a very diverse set of prokaryotic taxa (in-cluding Crenarchaeota (Domain: Archaea), low- and high-GC gram-positive bacteria, β-, γ-, and ε-Proteobacteria) (Stolz et al., 2006). We chose Enterobacter cloacae SLD1a-1 as the benchmark organism for the reactive transport model presented in this paper. Since its original isola-tion from seleniferous agricultural drainage water, this γ -Proteobacterium has received a particularly large amount of research attention (Losi and Frankenberger, 1998). E.
cloa-cae SLD1a-1 is known to grow both aerobically and
anaer-obically using a variety of electron donors, including pyru-vate (Losi and Frankenberger, 1997b). It can reduce sele-nate via selenite to solid elemental Se (Losi and Franken-berger, 1997a) and its membrane-bound selenate reductase has been identified (Watts et al., 2003) and purified (Ridley et al., 2006). Furthermore, it has been used as a model organism in several studies investigating the molecular genetics of se-lenium reduction (Ma et al., 2007, 2009; Yee and Kobayashi, 2008; Yee et al., 2007) and has been considered as a can-didate for bioremediation schemes (Losi and Frankenberger, 1998). E. cloacae SLD1a-1 can carry out selenium reduc-tion under oxic condireduc-tions, though at rates that are an order of magnitude lower than under anoxic conditions (Losi and Frankenberger, 1997b). This inhibition is in accordance with thermodynamic expectations, since at neutral pH reduction of selenate to selenite is not energetically favored above a pE of 7.5, placing it generally between nitrate and manganese oxide on the redox ladder (Sposito et al., 1991).
Unsurpris-ingly, oxygen inhibition of microbial selenium reduction has also been observed in environmental samples (Oremland et al., 1989). Selenium reduction rates are thus sensitive to lo-cal redox potential.
Redox conditions in soils are known to display a large amount of spatial heterogeneity, owing to the heterogeneous size and distribution of pore spaces in a soil’s physical struc-ture (Arah and Vinten, 1995; Sexstone et al., 1985). A com-mon approach to model this spatial heterogeneity in mecha-nistic biogeochemical models has been to represent the soil matrix as a series of spherical microporous structures or ag-gregates (Arah and Vinten, 1995). Soil agag-gregates are mm-to cm-sized structural units of mineral particles bound by roots, fungal hyphae, and organic matter that naturally occur in most soils (Brady and Weil, 2002). Whereas a variety of different shapes exist in nature, granular spherical aggregates (granular structure) are particularly common in surface soils (A horizons) (Brady and Weil, 2002). Aggregates represent well-defined natural systems in which to study the impact of mm- to cm-scale spatial heterogeneity on biogeochemical reactions (Tokunaga et al., 2003).
aggregate, which may imply a general role of aggregate size in selenium reduction and retention (Kausch et al., 2012).
In this study we formally tested this hypothesis by con-structing a mechanistic mathematical model of the coupled transport and transformations of selenium species inside an aggregate containing selenium-reducing bacteria (E.
cloa-cae) and in the surrounding solution. The objectives were to
evaluate the theoretical impact of variations in aggregate size on selenium retention within a comprehensive mechanistic framework and to assess implications for the management of seleniferous soils that can be a source of water contam-ination. Furthermore, we wanted to disentangle the roles of heterogeneity in reaction rates and chemical fluxes in pro-ducing the experimentally observed concentration gradients and resolve the production and distribution of elemental se-lenium in aggregates (which could not be directly measured in experiments). To this end we reproduced our experimen-tal results (Kausch et al., 2012) to validate the model, and then simulated selenate and selenite reduction in aggregates ranging from 1–2.5 cm in diameter.
2 Materials and methods
2.1 Overview of experimental data used
In developing and validating our reactive transport model we used data obtained from flow-through experiments involv-ing novel artificial soil aggregates made of sand and con-taining Enterobacter cloacae SLD1a-1 (Kausch et al., 2012). The experiments were carried out under a set of eight differ-ent chemical conditions (0.4 or 0.8 mM selenate and 0.3 or 1.2 mM pyruvate in the input solution under oxic and anoxic conditions). We used data on bacterial cell densities and con-centrations of reduced selenium within three concentric sec-tions of the aggregates, as well as data on temporal evolution of selenite and flow tracer (bromide) concentrations in the re-actor outflow. The flow tracer data were used to establish that the physical flow model was representative of experimental flow and transport. The data on solution and solid-phase sele-nium concentrations were used to parameterize the global ex-pressions for chemical reaction rates and later to assess that the reactive transport model represented the experimentally observed spatial and temporal dynamics of the system under the full set of chemical conditions. The data on cell density were used to constrain cell density in the reactive transport model by checking whether it varied between concentric sec-tions of the aggregates and between the beginning and end of experiments.
2.2 Aggregate construction
Spherical (2.5 cm diameter) aggregates were constructed in the laboratory using the protocol developed by Pal-lud et al. (2010b). Aggregates were composed of pure quartz sand (IOTA 4 pure quartz powder, grain size of
150–250 µm, Unimin Corporation) homogenously inocu-lated with a suspension of E. cloacae to a density of approxi-mately 108cells g−1dry aggregate mass. Right after the sand was inoculated with E. cloacae, it was mixed with hydrogel agarose to promote particle aggregation (150 g of 0.5 wt % agarose, 30 mL of bacterial suspension and 300 g of sand) and then molded into aggregates using a spherical press. The average pore diameter and porosity of aggregates thus constructed are 39 µm and 0.58, respectively (Pallud et al., 2010b). No carbon source or selenium was present in the ag-gregates at the time of synthesis. Pure quartz sand was chosen since adsorption of selenium oxyanions is negligible under the experimental conditions, thus allowing the investigation of transport mechanisms independent of sorption.
2.3 Flow-through experiments
Flow-through systems consisted of individual artificial soil aggregates placed on hollow plastic stands, which supported them in a stable position without inhibiting flow, at the cen-ter of a polycarbonate reactor cell (5.1 cm diamecen-ter, length 3.7 cm). A constant flow rate of 1.0±0.1 mL h−1 was im-posed at the lower boundary of the reactors using a peristaltic pump and effluent samples were collected in 8 h increments for 192 h. The input solution was a sterile, artificial ground-water medium (prepared in 10 mM PIPES and containing the following (in mg L−1): NaCl, 30; NH4Cl, 0.95; KCl, 5;
MgSO4, 50; KH2PO4, 0.950 and 1 mL L−1mineral Wolfe’s
solution with pH adjusted to 7.2), with selenate concentra-tions of either 0.4 or 0.8 mM, and pyruvate concentraconcentra-tions of either 0.3 or 1.2 mM (added from filtered sterile stock tions). Bromide (2 mM, as KBr) was included in inflow solu-tions as an unreactive flow tracer, but not in the solution used to fill the reactors initially. For each experiment the compo-sition of the input solution remained constant throughout.
Anoxic experiments were fully contained within an anaer-obic chamber (Coy Laboratories, Inc., Grass Lake, MI), and the input solutions (single batches of 0.5 L) were made anoxic by sparging with O2-free N2 for 15 min. The
effi-cacy of the chosen sparging procedure and time was as-certained through tests with the redox indicator die re-sazurin (0.5 mg L−1). For oxic experiments, thorough aera-tion was insured by using oxic input soluaera-tions and continu-ously bubbling air into the solution surrounding the aggre-gates throughout the experiment.
At the conclusion of experiments, aggregates were shaved into three concentric sections (core: radius 0–5 mm, mid-section: radius 5–9 mm, and exterior: radius 9–12.5 mm – corresponding to relative volumes of 6.4 %, 30.9 % and 62.7 %, respectively) (Pallud et al., 2010b) for solid-phase Se extractions and analysis as well as enumerations of E.
2.4 Chemical analysis
Selenium extraction from the solid phase was performed with 12 M HNO3 (Kausch et al., 2012) and analysis of
solid extraction and elution samples was performed via hy-dride generation coupled to optical emission spectrometry (PerkinElmer 5300 DV) as previously described by Kausch et al. (2012). While the procedure allows for direct analy-sis of selenite concentrations in liquid samples, the extrac-tion and analysis of solid-phase samples yields a single ex-perimental fraction of reduced selenium including both se-lenite and elemental selenium (Kausch et al., 2012). Out-flow samples were analyzed for selenite and total selenium, with selenate concentrations computed as the difference be-tween the two measurements. Selenate outflow concentra-tions did not differ significantly from input concentraconcentra-tions and are thus not reported. Additionally, for outflow samples from two oxic and two anoxic experiments each, bromide concentrations were determined on a Dionex ion chromato-graph (ED40 electrochemical detector) with an AS23 col-umn (Thermo Fisher Scientific Inc.) using 4.5 mM Na2CO3,
0.8 mM NaHCO3 eluent. Bromide and selenite standards
were prepared from certified stock (Spex CentriPrep Group L.L.C. and VHG Labs, respectively).
2.5 Bacterial cell counts
Counts of bacteria per gram of sand were obtained prior to and at the conclusion of experiments. Prior to experiments, the sand-agarose-cell mixture from which aggregates were shaped was sampled, whereas at the conclusion of experi-ments separate samples from the exterior and mid-sections of each individual aggregate were used. The volume of sand in core sections was too small to allow bacterial counts for that aggregate section. The 1 g (wet weight) samples were each transferred into 9 mL of sterile saline solution (NaCl, 8 g L−1) and shaken thoroughly. A 10-fold dilution series in sterile NaCl (8 g L−1) was prepared from each aggregate sample solution. Then 100 µL aliquots of appropriate dilu-tions were plated in triplicate on solid medium (30 g L−1 tryptic soy broth, 15 g L−1agar). Plates were incubated for 2–5 days at 25◦C before colony forming units (CFU) were counted.
2.6 Reactive transport model
The transport model and geometry used here are based on previous work modeling iron reduction in artificial aggre-gates (Pallud et al., 2010a). The experimental setup was emulated in a 2-D axi-symmetric reactive transport model (Fig. 2a) describing physical solute transport by advection and molecular diffusion and the effect of kinetically driven redox reactions on mass balance expressions for pyruvate, oxygen, selenate, selenite, and elemental selenium.
The flow and pressure fields were computed using the sta-tionary, incompressible Navier–Stokes equations in the free fluid surrounding the aggregate and the Brinkman equation inside the aggregate (see Appendix A for an explicit account of the governing equations). The aggregate permeability was computed based on grain size and porosity measurements and a uniform flow velocity was imposed at the lower bound-ary of the reactor (inflow), with no-slip conditions at the re-actor walls (Pallud et al., 2010a).
Reactions of selenium species, pyruvate, and (in oxic sim-ulations) oxygen were formulated by taking into account aer-obic respiration and selenium reduction coupled with pyru-vate oxidation by E. cloacae (Losi and Frankenberger, 1998). All reactions were implemented using kinetic rate expressions with a Monod-type dependency on both elec-tron acceptor (i=oxygen, selenate, or selenite) and electron donor (pyruvate) (Rittman and VanBriesen, 1996) as Ri=kiρcells·
pyruvate
Kmipyruvate+pyruvate· [i] Ki
m+[i]
·Ii([oxygen])
, (1)
whereRi is the reaction rate andki the cell-specific rate con-stant for the respective electron acceptor (i),ρcells denotes
the cell density of E. cloacae, andKmipyruvate andKmi are the half-saturation constants for electron donor and acceptor, re-spectively.Ii([oxygen]) is the oxygen concentration depen-dent inhibition term (Van Capellen and Gaillard, 1996) spe-cific for selenate or selenite reduction (Ii([oxygen])=1 for aerobic respiration).Ii([oxygen]) was parameterized by fit-ting the data collected by Losi and Frankenberger (1997b) on the inhibition of selenate and selenite reduction by E. cloacae at various oxygen concentrations (Supplement: Fig. S1).
A cell death term was introduced that led to a linear de-crease in cell density over time (see Appendix A for details) based on our observations that the average cell density mea-sured at the conclusion of anoxic experiments was an order of magnitude lower than the initial cell density (see below). This term was only used in fitting the model to experimental results and not in the predictive simulations. Other than those relating to cell density, model parameters were kept constant among all simulations (i.e., different chemical conditions). For the predictive simulations, the cell density was also held constant at 1×10⁸cells g−1for all chemical conditions. The values of reaction parameters used in the model are listed in Table 1. A detailed description of the model is given in Ap-pendix A.
2.7 Model fitting
Table 1. Reaction rate parameters used in simulations. Cell-specific rate constants were established in a global fit to the experimental data shown here.
Reaction Maximum cell-specific e−-donor half- e−-acceptor half- Oxygen inhibition rate [mmol s−1cell−1] saturation constant [mM] saturation constant [mM] constantc
Aerobic respiration 5×10⁻¹⁷ 0.01a 0.001 n/a
Selenate reduction 1.3×10⁻¹⁶ 0.2 3b 0.026c
Selenite reduction 9×10⁻¹⁸ 0.01a 0.7b 11c
aBased on representative value listed in Principles of Microbe and Cell Cultivation (Pirt, 1975). bValues of selenate and selenite half-saturation constants of E. cloacae obtained by Ma et al. (2007).
[image:5.595.308.546.225.348.2]cOxygen inhibition was modeled based on best-fit to data from Losi and Frankenberger (1997b), with an inverse-Monod relationship for selenate reduction (half-inhibition constant in units of mM) and an exponential inhibition term for selenite reduction (unitless inhibition constant). See Appendix A for details.
Fig. 1. Measured (diamonds) and simulated (solid lines) selenite concentrations in the reactor outflow under oxic (a) and anoxic (b) conditions. Colors correspond to specific combinations of input selenate and pyruvate concentrations (see legend).
selenate reduction, and the oxygen half-saturation constant were adjusted; all other parameters were taken from the liter-ature. Whereas reaction rate parameters were kept constant between chemical scenarios, the initial cell density values were varied between 1–3×10⁸cells g−1. See Appendix A for a discussion of the cell death term.
2.8 Predictive simulations
Predictive simulations were performed by varying the ag-gregate diameter for chemical scenarios equivalent to those run experimentally (0.3 and 1.2 mM pyruvate, with 0.4 and 0.8 mM selenate input solutions under both oxic and anoxic conditions). Each predictive scenario consisted of a set of 9 simulations in which the aggregate diameter varied be-tween 1 cm (which corresponds to the size of core sections in experiments) and 2.5 cm (which corresponds to the full size of experimental aggregates). Results were linearly inter-polated between the 9 simulated diameters. Simulation time (192 h) and kinetic parameters (Table 1) were left unchanged and the cell density was constant at 1×10⁸cells g−1.
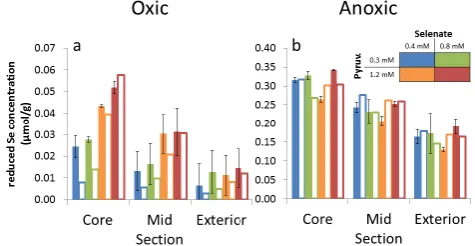
Fig. 2. Measured (solid bars) and simulated (hollow bars) concen-trations of reduced selenium (selenite+elemental Se) in the solid phase of concentric aggregate sections (core, mid-section, exterior) under oxic (a) and anoxic (b) conditions. Error bars correspond to the standard deviation of replicate measurements (N=2 for the core section and 3 otherwise). Colors correspond to specific combi-nations of input selenate and pyruvate concentrations (see legend).
3 Results
3.1 Experimental selenite breakthrough curves
Experimental selenite breakthrough curves from oxic and anoxic experiments are shown in Fig. 1a and b, respectively. It can be seen that under both oxic and anoxic conditions, selenite outflow concentrations reached their highest value between 80 and 150 h. Selenite concentrations in the reac-tor outflow were 6–20 times higher under anoxic than oxic conditions, with peak selenite concentrations of respectively 40–70 µM and 2–12 µM. The initially steeply increasing se-lenite concentrations plateaued as they approached their peak value; however, a clear steady state was not maintained un-der all experimental conditions. Selenite concentrations de-creased after reaching the peak value in the oxic experi-ment with high-pyruvate (1.2 mM) and selenate (0.8 mM) concentrations in the input solution and in all anoxic experi-ments, except the one with low-pyruvate (0.3 mM) and sele-nate (0.4 mM) input concentrations.
[image:5.595.49.284.225.352.2]the outflow under both oxic and anoxic conditions (Fig. 1). Under oxic conditions, peak selenite concentrations approx-imately tripled with an increase of the pyruvate input con-centration from 0.3 mM to 1.2 mM, whereas they approxi-mately doubled with an increase of selenate input concen-trations from 0.4 mM to 0.8 mM (Fig. 1a). In contrast, un-der anoxic conditions peak selenite concentrations increased by a factor of less than 1.5 with both an increase of the pyruvate input concentration from 0.3 mM to 1.2 mM, and an increase of selenate input concentrations from 0.4 mM to 0.8 mM (Fig. 1b).
3.2 Experimental solid-phase distribution of reduced selenium
Reduced selenium, which corresponds to the sum of selen-ite and elemental selenium, was detected in core, mid-, and exterior sections of all aggregates, with positive gradients in reduced selenium concentrations observed from the aggre-gate exterior towards the cores of aggreaggre-gates under all inves-tigated chemical conditions (Fig. 2). These gradients were steeper under oxic than under anoxic conditions. Specifically, the ratio in solid-phase concentrations of reduced selenium between core and exterior sections of aggregates was be-tween 2.2–3.9 and 1.8–2.0 under oxic and anoxic conditions, respectively.
Absolute concentration values of solid-phase re-duced selenium varied between 0.01–0.05 µmol g−1 and 0.16–0.34 µmol g−1 under oxic and anoxic conditions, respectively (Fig. 2). The differences within the oxic and anoxic sets of solid-phase concentrations were not statisti-cally significant (Kausch et al., 2012), but are here presented separately for the purpose of showing the fits of individual model scenarios. For example, under oxic conditions the concentrations of reduced solid-phase selenium appear systematically higher for pyruvate input concentrations of 1.2 mM as compared to pyruvate input concentrations of 0.3 mM, and while this difference in experimental results was not large enough to be statistically significant it was nevertheless reproduced by the simulated results.
3.3 Flow tracer (bromide) breakthrough curves and transport model
Steady-state concentrations of bromide (within 10 % of the 2 mM input concentration) in the outflow from the four re-actors tested were reached between 80 and 120 h (Supple-ment: Fig. S2). This compares well with results from the transport model, which predicts that 90 % of the input con-centration of an unreactive tracer should be reached after 116 h in the outflow. Experimental data points scatter around the simulated curve with a maximum distance of 0.5 mM (Fig. S1).
3.4 E. cloacae cell counts prior to and at termination of
experiments
The density of E. cloacae (average±standard deviation) determined in aggregate material prior to experiments was (1.2±0.5)×108CFU g−1 (N=3). Under anoxic condi-tions, cell densities decreased by an order of magnitude over the course of the experiments. In fact, the average value from replicates from all aggregate sections measured at the experi-ment conclusion was (8±7)×106CFU g−1(N=25). How-ever, under oxic conditions, cell densities remained relatively constant over time with an average cell density from repli-cates of all aggregate sections at the end of experiments of (1.1±0.6)×108CFU g−1 (N=26), one outlier aggregate section excluded. The only exception was the exterior section of the oxic aggregate run with high-pyruvate (1.2 mM) and high-selenate (0.8 mM) input concentrations, where E.
cloa-cae density reached a value of (1.4±0.9)×109CFU g−1at the conclusion of experiments (N=3), which is an order of magnitude higher than the initial value. Aside from this no systematic differences in the cell density based on aggregate section or input solution composition were discerned.
3.5 Model fitting and validation
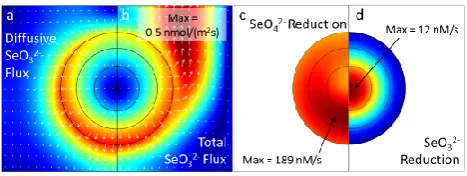
Fig. 3. Modeled concentration fields of pyruvate (a), O2 (b),
se-lenite (c), and Se(0) (d) within the aggregate (circle) and the sur-rounding solution after 192 h simulation time (steady state) in an oxic simulation with 0.3 mM pyruvate and 0.8 mM selenate input concentrations. Cold colors denote the absence of the species (min-imum concentration is zero in all panels), whereas warm colors rep-resent high concentrations, with maximum values as indicated on the panels. DimensionsLandR correspond to the length and ra-dius of experimental reactors (3.7 and 2.55 cm respectively) and the dotted line represents the axis of cylindrical symmetry. The black rings correspond to the boundaries between the exterior, mid-, and core sections that were experimentally sampled. Molarities are ex-pressed with respect to the pore/solution volume. The white arrows represent the flow field.
scenarios. Specifically, the modeled concentration ratio be-tween the simulated core and exterior sections was 1.8 for anoxic conditions, and 2.8–4.9 for oxic conditions, compared to experimental values of 1.8–2.0 and 2.2–3.9.
3.6 Dynamics of concentration fields and reaction rates
The spatial and temporal behavior displayed by chemical species in our reactive transport model differed qualitatively based on whether they were reactants or products of reac-tions, whether they were solids or solutes, and also based on the bulk oxidation conditions. Here we use concentration and reaction rate maps from the oxic simulation with 0.3 mM pyruvate and 0.4 mM selenate as an example to illustrate spa-tial and temporal patterns that were consistent among the dif-ferent chemical scenarios explored. Figure 3 shows the final concentration fields for pyruvate, oxygen, selenate, selenite, and elemental selenium at the termination of this simula-tion. Movies showing the dynamics of pyruvate, oxygen, se-lenate, selenite, and elemental selenium concentration fields (Movies S1–S5) and of reaction rate fields (Movies S6–S7) are included in the Supplement.
Whereas the concentrations of pyruvate, selenate, and se-lenite approached steady state between 64 and 192 h of simu-lation time (Movies S1, S3, S4), those of oxygen reach steady state within 32 h (Movie S2). Concentrations of elemental selenium, on the other hand, kept increasing inside the ag-gregate domain throughout the simulation time (Movie S5). Over the course of simulations, all compounds developed smooth gradients of approximately radial symmetry within the aggregate domain (the symmetry is slightly shifted in the direction of flow). However, whereas concentrations of
re-Fig. 4. Modeled fields of diffusive selenite flux (a), total selenite flux (b), selenate reduction rates (c), and selenite reduction rates (d) within the aggregate (circle) and the surrounding solution af-ter 192 h simulation time (steady state) in an oxic simulation with 0.3 mM pyruvate and 0.8 mM selenate input concentrations. Cold colors denote low values (minimum concentration is zero in all pan-els), whereas warm colors represent high concentrations, with max-imum values as indicated on the panels. The black rings correspond to the boundaries between the exterior, mid-, and core sections that were experimentally sampled. Molarities are expressed with respect to the pore/solution volume. The white arrows in (a) and (b) repre-sent flux vectors.
actants (pyruvate, selenate, and when present, oxygen) de-creased towards the core of the aggregate domain, those of products (selenite and elemental selenium) increased towards the core (Fig. 3). The gradients of selenite, elemental sele-nium and, except in the case of selenate, also of reactants, were steeper under oxic than under anoxic conditions (data not shown). The maximum concentrations of the reactants pyruvate, selenate, and oxygen found in the free fluid sur-rounding the aggregate at steady state correspond to the in-put concentrations (Fig. 3, note: 0.26 mM correspond to at-mospheric equilibrium oxygen concentration).
Diffusive and advective transport, respectively, dominated inside the aggregate and in the surrounding solution. This is illustrated for the case of selenite in Fig. 4. It can be seen that while the diffusive selenite flux was near zero at the core of the aggregate, it increased towards the aggregate exterior and is 0.4 nmol m−2s−1at the interface between the aggre-gate and the surrounding solution (Fig. 4a). In the surround-ing solution the diffusive flux decreased with increassurround-ing dis-tance from the aggregate. This was, however, compensated by an increasing advective flux component downstream of the aggregate, where it lead to a maximal total selenite flux of 0.5 nmol m−2s−1(Fig. 4b).
[image:7.595.52.285.64.153.2]reduction smoothly increased from 0 at the aggregate exte-rior to 12 nM s−1at the core (Fig. 4d).
3.7 Predictive simulations of aggregate size impact on selenium retention
Simulations in which the diameter of the spherical aggre-gate was varied between 1 and 2.5 cm (corresponding to vol-umes of 0.5 cm3and 8.2 cm3, respectively) showed that the aggregate solid-phase concentrations of reduced selenium scale with aggregate size under all chemical conditions in-vestigated (Fig. 5). This effect was more pronounced under oxic conditions than under anoxic conditions. In fact, un-der oxic conditions the average solid-phase concentrations of total reduced selenium were 0.6–1.6 nmol g−1 in aggre-gates of 1 cm diameter and 4–17 nmol g−1in aggregates of
2.5 cm diameter, which corresponds to a difference by a fac-tor of 6–11 between the two size extremes (Fig. 5a–d). On the other hand, under anoxic conditions the average solid-phase concentrations of total reduced selenium were only about 4 times higher in 2.5 cm diameter aggregates than in 1 cm diameter aggregates, with values of 57–140 nmol g−1 and 14–36 nmol g−1, respectively (Fig. 5e–h). Under oxic con-ditions, solid-phase concentrations of elemental selenium in aggregates were particularly sensitive to aggregate size, scal-ing from 0.1–0.2 to 0.8–4.5 nmol g−1 over the investigated size range (factor 8–23). Thus, the fraction of elemental se-lenium in aggregates varied greatly with aggregate size un-der oxic conditions (11–26 % of reduced selenium). In con-trast, under anoxic conditions elemental selenium makes up around 60 % (55–61 %) of reduced selenium in aggregates regardless of aggregate size and input solution concentra-tions.
Under anoxic conditions, the curves describing reduced selenium solid-phase concentrations as a function of aggre-gate size displayed negative curvature throughout the differ-ent reactant concdiffer-entration scenarios investigated (Fig. 5e–h). However, under oxic conditions the curves corresponding to high-pyruvate (1.2 mM) concentration scenarios (Fig. 5c–d) were markedly steeper towards the larger end of the aggre-gate size spectrum (positive curvature) than those for low-pyruvate (0.3 mM) concentration scenarios (negative curva-ture) (Fig. 5a–b).
4 Discussion
4.1 Model validity
The reactive transport model developed in this work repro-duces the general spatial and dynamic behavior observed in experiments across the full spectrum of chemical condi-tions investigated. More specifically, our model reproduces the time to reach quasi-steady state, the impact of aeration conditions and input solution composition on outflow selen-ite concentrations (which are a proxy for experimental
reac-Fig. 5. Results of oxic (a–d) and anoxic (e-h) simulation series eval-uating the amount of reduced selenium per gram of the solid phase as a function of aggregate size for conditions with (a and e) 0.3 mM pyruvate/0.4 mM selenate, (b and f) 0.3 mM pyruvate/0.8 mM se-lenate, (c and g) 1.2 mM pyruvate/0.4 mM sese-lenate, and (d and h) 1.2 mM pyruvate/0.8 mM selenate. The amount of selenite in the solid phase is shown in grey, while the amount of elemental se-lenium in the solid phase is shown in red. Each panel shows the results of 9 simulations carried out at different aggregates sizes; the space between simulations was linearly interpolated.
[image:8.595.309.541.62.391.2]The greatest error source in simulating aggregate experi-ments is the variability in cell densities and microbial activ-ity since they factor into every rate law, are difficult to con-trol experimentally, and their temporal evolution is hard to measure. In fact, the random error in the solid-phase deter-mination of cell density, which was already large at the be-ginning of experiments (standard deviation was 42 % of the average measurement), increased in the measurements con-ducted at the conclusion of experiments. Whereas some of the error in measuring cell densities is likely to have been corrected by using cell density as a fitting parameter in sim-ulations, this does not include potential errors introduced by temporal variations in cell-specific reaction rates that could not be measured or controlled. Additionally, cell densities were modeled as spatially homogenous within aggregates, whereas spatial variation is likely to have occurred, though eclipsed by the large uncertainty range of experimental ob-servations. Based on the data collected for this work with
E. cloacae and previous work with Shewanella putrefaciens
CN-32 (Pallud et al., 2010a, b), we are confident that our procedure of aggregate construction leads to a distribution of cell density that is initially homogenous. However, spa-tial heterogeneity may occur over the course of experiments as cell populations grow or decay differentially in different sections of aggregates. For example, in our work with S.
pu-trefaciens we found a trend at the conclusion of experiments
indicating that cell densities may have been slightly higher (factor 2) at the exterior of aggregates (Pallud et al., 2010b), where elevated concentrations of electron donors may have led to more growth. Similarly, in the data presented here, the elevated CFU count value for the exterior section of the oxic aggregate run with high pyruvate (1.2 mM) and high sele-nate (0.8 mM) provides an indication of preferential growth in certain sections of the aggregate under certain chemical conditions. For example, our model shows that under oxic conditions, concentrations of both pyruvate and oxygen are expected to decrease steeply towards the core of aggregates. Since these are the substrates for aerobic growth, it is plau-sible that E. cloacae may have grown preferentially at the aggregate–solution boundary where concentrations of pyru-vate and oxygen were the highest.
The cell density values (including the cell death term) used in the model are similar to the experimentally ob-tained values from bacterial cell counts (see above). The maximum cell specific rate constants which were the results of our model fitting (13 and 0.9×10⁻¹⁷mmol s−1cell−1 for selenate and selenite reduction respectively) align well with what has previously been published for E. cloacae. Losi and Frankenberger (1997) found that the bacterium re-duces 5 µmol g−1of selenate over 30 min in a medium with 127 µM selenate and 2.8 mM pyruvate. Assuming a bacte-rial cell mass of 10−12g (Davis et al., 1973) and the rate law (Eq. 1) and half-saturation constants (Table 1) given in the methods section, this would amount to a maximum cell specific rate of about 10−17mmol s−1cell−1, which is
within an order of magnitude from our value. Similarly, Ma et al. (2009) found that E. cloacae reduces 1 mM con-centrations of selenate and selenite at rates of 1.6 and 0.17 mmol s−1g−1, respectively, which following the same conversion as above amounts to maximum cell-specific rates of 10 and 1×10⁻¹⁷mmol s−1cell−1, respectively. These values are nearly identical to the ones that resulted from our model fitting (13 and 0.9×10⁻¹⁷mmol s−1cell−1 for sele-nate and selenite reduction, respectively).
In summary, the simulations appear to capture the dy-namics of the model aggregate system well and the kinetic parameters resulting from the model fitting represent the model organism (E. cloacae) in congruence with the liter-ature. Thus, the reactive transport model presented here is a suitable framework for a theoretical exploration of aggregate scale impacts on selenium reduction.
4.2 Controls of aggregate scale gradients in reduced selenium
Previous experimental work showed substantial mm-scale ra-dial intra-aggregate variations in reduced selenium distribu-tion, with concentrations that increase from the advection boundary towards the core of artificial, 2.5 cm diameter ag-gregates (Kausch et al., 2012). With the reactive transport model presented here, we can now provide a mechanistic ex-planation of how this accumulation of reduced selenium at the core of aggregates occurs.
between reduced selenium concentrations in the core and ex-terior aggregate sections was greater under oxic than under anoxic conditions. The effect of differential oxygen inhibi-tion in the exterior of aggregates is however secondary to the effect of diffusive mass transfer limitation in creating the ob-served gradients in reduced selenium. This is evidenced by the similarity in reduced selenium gradients observed under anoxic and oxic conditions. Another effect of oxygen is that by enabling aerobic respiration it increases the limitations imposed by the electron donor (pyruvate). Oxygen can thus indirectly inhibit selenium reduction at the aggregate core by limiting electron donor concentrations if the supply from the surrounding solution is small. In contrast to selenite concen-trations, those of pyruvate decrease with increasing distance from the advective boundary. This explains why higher con-centrations of pyruvate in the input solution lead to much higher reduced selenium concentrations at the core of aggre-gates under oxic conditions, but not under anoxic conditions. The concentrations of solid-phase elemental selenium in-side aggregates mirror those of selenite because selenite is the primary limiting factor in the production of elemental selenium (selenite reduction). The half-saturation constant for selenite in selenite reduction by E. cloacae is 0.7 mM (Ma et al., 2007); thus, at selenite concentrations represen-tative of our experiments (∼0.01 and 0.05 mM for oxic an anoxic conditions, respectively), selenite reduction rates de-pend almost linearly on selenite concentrations (Eq. 1). Con-sequently, the rates of selenite reduction are very heteroge-neous inside aggregates with faster rates at the core where se-lenite accumulates. Once produced, elemental selenium will not move, and is thus not affected by transport, as selenite is. This also explains why elemental selenium concentrations in aggregates respond more strongly than selenite concentra-tions to condiconcentra-tions that promote the production of both forms of reduced selenium (i.e., for example, anoxic condition). Increasing selenite concentrations inside the aggregate will also lead to an increase of diffusive flux out of the aggregate. This negative feedback equilibrates concentrations of selen-ite in aggregates, which is why selenselen-ite distributions reached a steady state in all simulations. This is not the case for ele-mental selenium, which is not affected by diffusive transport and can thus grow boundlessly while selenite reduction oc-curs. The rates of elemental selenium production (selenite reduction) reach a selenite concentration dependent steady state, but the concentrations of elemental selenium keep in-creasing (at a steady rate) for as long as chemical input and microbial activity remain stable.
4.3 Impact of soil aggregate size on selenium retention
The same process that leads to the accumulation of reduced selenium at the core of aggregates causes the retention of re-duced selenium to scale with aggregate size. Specifically, se-lenite (and consequently also elemental selenium) accumu-lates inside aggregates by virtue of diffusive mass transfer
limitations that are more pronounced in larger aggregates. Smaller aggregates have a shorter average diffusion path length to the surrounding advective boundary (selenite sink) than larger aggregates. Consequently, selenite export from smaller aggregates to the surrounding solution is less limited than in the case of larger aggregates, and selenite will accu-mulate to a lesser extend at their cores. The impact of aggre-gate size is enhanced in the presence of oxygen since oxygen inhibition of selenium reduction will be stronger in smaller aggregates (shorter average diffusion path from the surround-ing oxic solution). It is for this reason that, under bulk oxic conditions, the concentrations of reduced solid-phase sele-nium scaled more strongly with aggregate size than under anoxic conditions. Additionally, under oxic conditions, the interaction between electron donor concentrations and ag-gregate size becomes more important. The electron donor is needed both for aerobic respiration, which reduces oxy-gen concentrations in aggregates, and for selenium reduction. Thus, rates of electron donor consumption are faster under oxic conditions, and the electron donor concentrations in-side the aggregate are lower than under anoxic conditions. At the core of aggregates, the electron donor can become limiting for selenium reduction, but less so in aggregates of smaller size where the average diffusion path to the ad-vective boundary (electron donor supply) is shorter than for larger aggregates. As a result there is an interactive effect of electron donor concentrations and aggregate size under con-ditions that are oxic in bulk: the concentrations of reduced selenium retained in the solid-phase will scale more strongly with aggregate size if the supply of electron donor is larger. In summary, all other things equal, the amount of reduced se-lenium retained by a soil is expected to scale with increased aggregate size or electron donor concentrations, and with de-creased aeration. Additionally, there are important interactive effects between these variables since, in the presence of oxy-gen, organic carbon (electron donor) concentrations increase the impact of aggregate size on reduced selenium concentra-tions.
reduction persist, the impact of aggregate size on elemental selenium content will keep increasing over time as the con-centrations of elemental selenium build up. Increased soil ag-gregation may thus lead to a significant increase in long-term selenium retention.
Further studies are needed to establish whether the im-pact of aggregate size on selenium retention described here is significant at the field scale. A single, artificial aggre-gate surrounded by saturated flow cannot capture the full complexity of a structured soil, and relevant processes are likely to have been excluded. For example, selenite diffusing from aggregates may build up in macropores along the dif-fusion path, thereby decreasing the concentration gradient at the aggregate–macropore interface and reducing the impact of aggregate size on intra-aggregate selenite concentrations. Furthermore, the trends here discussed were obtained with selenate supplied in excess, while diffusive limitations in se-lenate supply may reduce selenium reduction in larger aggre-gates under field conditions. On the other hand, the dynamic saturation conditions in a natural surface soil may serve to increase the impact of aggregate size on selenium reduction through steeper redox gradients, as the macropores surround-ing aggregates are expected to be filled with air rather than water for part of the time. The advantage of simplified mod-els in studying complex natural systems is that they allow for the isolation of individual processes that may be inextricable in nature. The results here described point to general reactive transport mechanisms that may lead a soil with a larger mean aggregate size to retain more selenium. This would have im-plications for the management of irrigated seleniferous soils, since the fraction of macro-aggregates (>0.25 mm in diam-eter) in a soil is sensitive to agricultural management on time scales of 2 yr or less (Degens, 1997). Notably, conservation tillage has been found to lead to significant increases in both mean soil aggregate size and organic matter content of sur-face soils (Angers et al., 1993; Carter, 1992). Similarly, the addition of manure can result in a rapid increase of mean ag-gregate size within the first two years of application (Whalen et al., 2003). It is particularly interesting to note that organic carbon input can increase aggregate size since the concomi-tant increase in electron donor availability and aggregate size is expected to synergistically enhance selenium retention ac-cording to our model. The beneficial effects of soil aggre-gation for plant growth have long been established (Dexter, 1988). If there were to be additional external benefits to en-hancing soil structure for seleniferous soils, in the form of reduced selenium exports, conservation tillage and organic amendments may prove to be an attractive management tech-nique in regions prone to irrigation-induced selenium con-tamination. Viewed in this context, our results suggest that field studies investigating the effect of conservation tillage and organic matter applications on selenium retention may be warranted in the search for management strategies to re-duce selenium export.
In conclusion, our reactive transport model suggests that enhanced soil aggregation may increase the fraction of el-emental selenium in aggregates and consequently increase the degree to which selenium is retained. This effect could be useful in the prevention of irrigation-induced selenium contamination. Managing seleniferous agricultural soils in a way that optimizes aggregation (i.e., reduced tillage and or-ganic amendments) may reduce the amount of exported sele-nium and thus alleviate the impact of selesele-nium pollution for aquatic ecosystems downstream of such soils.
Appendix A
Detailed description of reactive transport model
The cylindrical reactor is represented by a rectangle of 3.70 cm height and 2.55 cm width, corresponding to the length and radius of the reactor, respectively, rotated around a central symmetry axis. In the free water surrounding the aggregate, the flow and pressure field is computed according to the stationary, incompressible Navier–Stokes equations: ρ (u· ∇)u= ∇ ·
h
−pI+η∇u+(∇u)T
i
,
and∇ ·u=0 (A1)
whereu is a velocity vector, ρ is density (1 kg L−1), p is
pressure andη is dynamic viscosity (0.001 Pa s), and I the identity matrix. Inside the aggregate,uandpare computed according to the Brinkman equations:
ρ∂u ∂t +
η κu= ∇ ·
h
−pI+η∇u+(∇u)Ti,
and∇ ·u=0 (A2)
where t is time (s) and κ is permeability. Its value was computed based on grain size and porosity, using Kozeny– Carman’s empirical relationship
κ=d2φ3/(80(1−φ)2), (A3) whered is a representative grain diameter andφis porosity (Bear, 1972) (d=200 µm,φ=0.58 as stated in the methods section).
A uniform flow velocity is imposed at inflow side of the reactor; a no-slip condition is applied at the outer reactor wall (u=0); a neutral outflow condition is imposed at that top,
h
−ρI+η∇u+(∇u)Tin=0, (A4) wherenis the normal vector; and axial symmetry is imposed at the reactor center. At the aggregate surface, internal and external pressure and velocities are set to match.
The following reactions are considered: Selenate reduction (RSe(VI)):
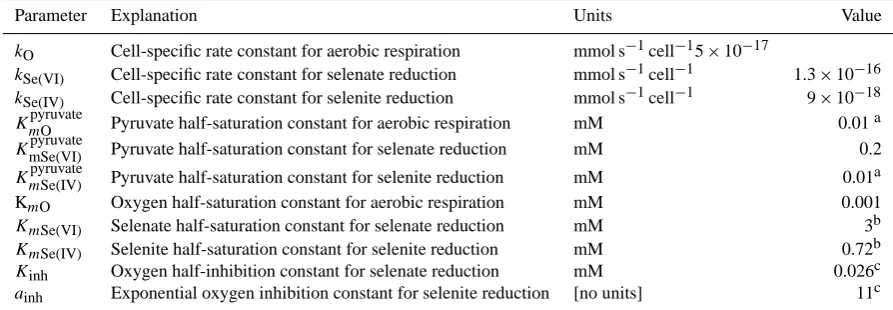
Table A1. Values of reaction rate parameters used in model.
Parameter Explanation Units Value
kO Cell-specific rate constant for aerobic respiration mmol s−1cell−15×10−17
kSe(VI) Cell-specific rate constant for selenate reduction mmol s−1cell−1 1.3×10⁻¹⁶
kSe(IV) Cell-specific rate constant for selenite reduction mmol s−1cell−1 9×10⁻¹⁸
KmpyruvateO Pyruvate half-saturation constant for aerobic respiration mM 0.01a KmSe(VI)pyruvate Pyruvate half-saturation constant for selenate reduction mM 0.2 KmpyruvateSe(IV) Pyruvate half-saturation constant for selenite reduction mM 0.01a
KmO Oxygen half-saturation constant for aerobic respiration mM 0.001
KmSe(VI) Selenate half-saturation constant for selenate reduction mM 3b
KmSe(IV) Selenite half-saturation constant for selenite reduction mM 0.72b
Kinh Oxygen half-inhibition constant for selenate reduction mM 0.026c
ainh Exponential oxygen inhibition constant for selenite reduction [no units] 11c
aBased on representative value listed in Principles of Microbe and Cell Cultivation (Pirt, 1975). bValues of selenate and selenite half-saturation constants obtained for E. cloacae by Ma et al. (2007).
cOxygen inhibition constants obtained by fitting E. cloacae experimental data obtained by Losi and Frankenberger (1997b).
Selenite reduction (RSe(IV)):
2CH3COCOO−+5SeO23−+12H
+
→5Se(0)+6CO2+9H2O;(A6) Aerobic respiration (RO):
2CH3COCOO−+5O2+2H+→6CO2+4H2O. (A7)
Reaction rates are formulated with a Monod-type depen-dency on both electron acceptor and donor (pyruvate) and with a term for oxygen inhibition for selenate and selenite reduction:
RSe(VI)=kSe(VI)ρcells·
[pyruvate]
KmSe(VI)pyruvate+[pyruvate]
· SeO
2−
4 KmSe(VI)+ [SeO24−]
·InhSe(VI)([O2]), (A8)
RSe(IV)=kSe(IV)ρcells·
[pyruvate]
KmSe(IV)pyruvate+[pyruvate]
· SeO
2−
3 KmSe(IV)+ [SeO23−]
·InhSe(IV)([O2]), (A9)
RO=kOρcells·
[pyruvate] KmpyruvateO +[pyruvate]
· [O2] KO
m+ [O2]
. (A10)
ki are cell-specific rate constants for the respective elec-tron acceptor andKmi are the half-saturation constants for the specific reaction (Rittman and VanBriesen, 1996). Ta-ble A1 shows the values used for these parameters in this model. The density of E. cloacae cells, ρcells, was set to
1×10⁸cells g−1in predictive simulations, but expressed as a function of time in fitting experimental data:
ρcells(t )=ρcells(0)·
1−δt >tdα
t−td tf −td
, (A11)
withtf being the end of the simulation (192 h=691 200 s) and δ being 1 if t > td, 0 else. ρcells, α, and td were
used as fitting parameters to achieve modeled breakthrough curves and solid concentrations that closely match the ex-perimentally observed ones.ρcells(0) was varied between 1–
3×10⁸cells g−1, whileαandtdwere varied (between 0.2– 0.7 and between 1–5×10⁵ s respectively) for anoxic sim-ulations and the oxic simulation with 1.2 mM pyruvate and 0.8 mM selenate input solution, and set to 0 otherwise.
Finally, for oxidation of pyruvate with selenate or se-lenite as electron acceptor, an oxygen concentration depen-dent inhibition term, Inhi([oxygen]), was introduced (Van Cappellen and Gaillard, 1996) parameterized by fitting the data on the inhibition of selenate and selenite reduction by
E. cloacae at various oxygen concentrations collected by
Losi and Frankenberger (1997b). Assuming that the oxygen concentration of an aqueous solution in equilibrium with at-mospheric air (20 % oxygen) is 0.26 mM their data are best described by the following:
InhSe(VI)([oxygen])=1−
[oxygen] [oxygen] +Kinh
, (A12)
InhSe(IV)([oxygen])=exp(−ainh· [oxygen]), (A13)
withKinh=0.026 mM anda=10.6 mM−1. These inhibition
models fit Losi and Frankenberger’s (1997b) data with R2 of 0.985 and 0.999 for InhSe(VI) and InhSe(IV), respectively.
These fits are included as Fig. S1 in the Supplement. These reactions are combined with expressions for the transport of dissolved constituents by advection and diffu-sion in an expresdiffu-sion for the conservation of mass:
ε·∂C
2011), which inside the aggregate is corrected for tortuosity:
D=Dmol·
1
1−ln(φ2). (A15)
At the slow flow velocities used, hydrodynamic dispersion is assumed negligible and size exclusion is ignored. εis 1 in the free fluid andφ inside the aggregate. For oxic simu-lations oxygen concentrations were fixed at 0.26 mM (water saturated with atmospheric concentrations) in the free fluid surrounding the aggregate (to represent air flushing) and al-lowed to vary according to the mass conservation expres-sions on the interior of the aggregate. For anoxic simulations, oxygen concentrations were set to zero throughout. The rate terms are assembled using the above rate laws and reaction stoichiometries (Eqs. A5–A10).
Supplementary material related to this article is available online at: http://www.biogeosciences.net/10/ 1323/2013/bg-10-1323-2013-supplement.zip.
Acknowledgements. The authors thank Chandra Richards and Vu Ngo for running the analyses of bromide concentrations in outflow samples, and Walter Mayeda, Eduardo Ruiz, Hoai Ngo, and Peter Ng for help in the laboratory. We thank Sharon Bone, Gavin McNicol, and Steven Hall for commentary during manuscript preparation. Finally, we thank Christof Meile for teaching the first author the art of reactive transport modeling.
Edited by: P. Stoy
References
Angers, D. A., Samson, N., and Legere, A.: Early changes in water-stable agregation induced by rotation and tillage in a soil under barley production, Can. J. Soil Sci., 73, 51–59, 1993.
Arah, J. R. M., and Vinten, A. J. A.: Simplified models of anoxia and denitrification in aggregated and simple-structured soils, Eur. J. Soil Sci., 46, 507–517, doi:10.1111/j.1365-2389.1995.tb01347.x, 1995.
Bear, J.: Dynamics of fluids in porous media, Dover, New York, 1972.
Brady, N. C. and Weil, R. R.: The Nature and Properties of Soils, 13th Edn., Prentice Hall, Upper Saddle River, NJ, 2002. Carter, M. R.: Influence of reduced tillage systems on organic
mat-ter, microbial biomass, macro-aggregate distribution and struc-tural stability of the surface soil in a humid climate, Soil Till. Res., 23, 361–372, 1992.
Darcheville, O., Fevrier, L., Haichar, F. Z., Berge, O., Martin-Garin, A., and and Renault, P.: Aqueous, solid and gaseous partitioning of selenium in an oxic sandy soil under different microbiological states, J. Environ. Radioactiv., 99, 981–992, 2008.
Davis, B., Dulbecco, R., Eisen, H., and Ginsberg, H.: Bacterial Physiology: Microbiology, 2nd Edn., Harper and Row, Mary-land, 1973.
Degens, B. P.: Macro-aggregation of soils by biological bonding and binding mechanisms and the factors affecting these: a review, Aust. J. Soil Res., 35, 431–459, 1997.
Dexter, A. R.: Advances in characterization of soil structure, Soil Till. Res., 11, 199–238, 1988.
Dungan, R. S. and Frankenberger, W. T., Jr.: Microbial transforma-tions of selenium and the bioremediation of seleniferous environ-ments, Bioremediation Journal, 3, 171–188, 1999.
Hamilton, S. J.: Review of selenium toxicity in the aquatic food chain, Sci. Total Environ., 326, 1–31, doi:10.1016/j.scitotenv.2004.01.019, 2004.
Haynes, W. M.: Crc handbook of chemistry & physics (internet ver-sion), [Online] CRC Press/Taylor & Francis Group, Boca Raton, 2011.
Kaurichev, I. S. and Tararina, L. F.: Oxidation-reduction conditions within and outside aggregates of grey forest soil, Pochvovedenie, 10, 39–42, 1972.
Kausch, M., Ng, P., Ha, J., and Pallud, C.: Soil-Aggregate-Scale Heterogeneity in Microbial Selenium Reduction, Vadose Zone J., doi:10.2136/vzj2011.0101, 2012.
Lemly, A. D.: Aquatic selenium pollution is a global environmental safety issue, Ecotox. Environ. Safe., 59, 44–56, 2004.
Lenz, M. and Lens, P. N. L.: The essential toxin: The changing per-ception of selenium in environmental sciences, Sci. Total Envi-ron., 407, 3620–3633, 2009.
Losi, M. E. and Frankenberger, W. T.: Reduction of selenium oxyanions by Enterobacter cloacae SLD1a-1: Isolation and growth of the bacterium and its expulsion of selenium particles, Appl. Environ. Microb., 63, 3079–3084, 1997a.
Losi, M. E. and Frankenberger, W. T.: Reduction of selenium oxyanions by Enterobacter cloacae strain SLD1a-1: Reduction of selenate to selenite, Environ. Toxicol. Chem., 16, 1851–1858, 1997b.
Losi, M. E. and Frankenberger, W. T.: Reduction of selenium oxyanions by Enterobacter cloacae strain SLD1a-1, in: Environ-mental Chemistry of Selenium, edited by: Frankenberger, W. T. and Engberg, R. A., Marcel Dekker, New York, 515–544, 1998. Luoma, S. N. and Presser, T. S.: Emerging Opportunities in
Man-agement of Selenium Contamination, Environ. Sci. Technol., 43, 8483–8487, 2009.
Ma, J., Kobayashi, D. Y., and Yee, N.: Chemical kinetic and molecu-lar genetic study of selenium oxyanion reduction by Enterobacter cloacae SLD1a-1, Environ. Sci. Technol., 41, 7795–7801, 2007. Ma, J. C., Kobayashi, D. Y., and Yee, N.: Role of menaquinone biosynthesis genes in selenate reduction by Enterobacter cloa-cae SLD1a-1 and Escherichia coli K12, Environ. Microbiol., 11, 149–158, 2009.
Masue-Slowey, Y., Kocar, B. D., Jofr´e, S. A. B., Mayer, K. U., and Fendorf, S.: Transport implications resulting from internal redis-tribution of arsenic and iron within constructed soil aggregates, Environ. Sci. Technol., 45, 582–588, 2011.
Oremland, R. S., Steinberg, N. A., Presser, T. S., and Miller, L. G.: Insitu bacterial selenate reduction in the agricultural drainage systems of Western Nevada, Appl. Environ. Microb., 57, 615– 617, 1991.
Pallud, C., Kausch, M., Fendorf, S., and Meile, C.: Spatial patterns and modeling of reductive ferrihydrite transformation observed in artificial soil aggregates, Environ. Sci. Technol., 44, 74–79, 2010a.
Pallud, C., Masue-Slowey, Y., and Fendorf, S.: Aggregate-scale spatial heterogeneity in reductive transformation of ferrihydrite resulting from coupled biogeochemical and physical processes, Geochim. Cosmochim. Ac., 74, 2811–2825, 2010b.
Pirt, S. J.: Principles of Microbe and Cell Cultivation, John Wiley & Sons, NYC, 1975.
Presser, T. S.: “The Kesterson effect”, Environ. Manage., 18, 437– 454, 1994.
Ridley, H., Watts, C. A., Richardson, D. J., and Butler, C. S.: Res-olution of distinct membrane-bound enzymes from Enterobac-ter cloacae SLD1a-1 that are responsible for selective reduction of nitrate and selenate oxyanions, Appl. Environ. Microb., 72, 5173–5180, doi:10.1128/aem.00568-06, 2006.
Rittman, B. E. and VanBriesen, J. M.: Microbial processes in re-active modeling, in: Rere-active transport in porous media, edited by: Lichtner, P. C., Steefel, C. I., and Oelkers, E. H., Rev. Min-eral., 34, Mineralogical Society of America, Washington, D.C., 311–332, 1996.
Seiler, R. L., Skorupa, J. P., and Peltz, L. A.: Areas susceptible to irrigation-induced selenium contamination of water and biota in the western United States US Department of the Interior, 36, 1999.
Sexstone, A. J., Revsbech, N. P., Parkin, T. B., and Tiedje, J. M.: Direct measurement of oxygen profiles and denitrification rates in soil aggregates, Soil Sci. Soc. Am. J., 49, 645–651, 1985. Sposito, G., Yang, A., and Mackzum, A.: Selenate reduction in an
alluvial soil, Soil. Sci. Soc. Am. J., 55, 1597–1602, 1991. Steinberg, N. A. and Oremland, R. S.: Dissimilatory selenate
reduc-tion potentials in a diversity of sediment types, Appl. Environ. Microb., 56, 3550–3557, 1990.
Stolz, J. F. and Oremland, R. S.: Bacterial respiration of arsenic and selenium, FEMS Microbiol. Rev., 23, 615–627, 1999.
Stolz, J. F., Basu, P., and Oremland, R. S.: Microbial transformation of elements: the case of arsenic and selenium, Int. Microbiol., 5, 201–207, doi:10.1007/s10123-002-0091-y, 2002.
Stolz, J. F., Basu, P., Santini, J. M., and Oremland, R. S.: Arsenic and selenium in microbial metabolism, Annu. Rev. Microbiol., 60, 107–130, 2006.
Strawn, D., Doner, H., Zavarin, M., and McHugo, S.: Microscale investigation into the geochemistry of arsenic, selenium, and iron in soil developed in pyritic shale materials, Geoderma, 108, 237– 257, 2002.
Tokunaga, T. K., Sutton, S. R., and Bajt, S.: Mapping of selenium concentration in soil aggregates with synchrotron X-ray fluores-cence microprobe, Soil Sci., 158, 421–434, 1994.
Tokunaga, T. K., Wan, J., Hazen, T. C., Schwartz, E., Firestone, M. K., Sutton, S. R., Newville, M., Olson, K. R., Lanzirotti, A., and Rao, W.: Distribution of chromium contamination and microbial activity in soil aggregates, J. Environ. Qual., 32, 541–549, 2003. Van Cappellen, P. and Gaillard, J.-F.: Biogeochemical dynamics in Aquatic Sediments, in: Reactive transport in porous media, edited by: Lichtner, P. C., Steefel, C. I., and Oelkers, E. H., Min-eralogical Society of America, Washington, D.C., 1996. Watts, C. A., Ridley, H., Condie, K. L., Leaver, J. T.,
Richard-son, D. J., and Butler, C. S.: Selenate reduction by Enterobac-ter cloacae SLD1a-1 is catalysed by a molybdenum-dependent bound enzyme that is distinct from the membrane-bound nitrate reductase, FEMS Microbiol. Lett., 228, 273–279, doi:10.1016/s0378-1097(03)00782-1, 2003.
Whalen, J. K., Hu, Q. C., and Liu, A. G.: Compost applications increase water-stable aggregates in conventional and no-tillage systems, Soil Sci. Soc. Am. J., 67, 1842–1847, 2003.
WHO: Chapter 6 – Selenium World Health Organization, Geneva, 105–122, 1996.
Yee, N. and Kobayashi, D. Y.: Molecular genetics of selenate reduc-tion by Enterobacter cloacae SLD1a-1, Adv. Appl. Microbiol., 64, 107–123, 2008.