Eukaryon
Eukaryon
Volume 5
Celebrating Darwin's 100th Anniversary
Article 40
4-8-2009
The Role of Ca²
⁺
and K
⁺
in the Regulatory Volume Decrease
The Role of Ca² and K in the Regulatory Volume Decrease
Mechanism of Alligator mississippiensis Erythrocytes
Mechanism of Alligator mississippiensis Erythrocytes
Shruti Pore
Lake Forest College
Follow this and additional works at:
https://publications.lakeforest.edu/eukaryon
Disclaimer:
Eukaryon is published by students at Lake Forest College, who are solely responsible for its
content. The views expressed in Eukaryon do not necessarily reflect those of the College.
Articles published within Eukaryon should not be cited in bibliographies. Material contained
herein should be treated as personal communication and should be cited as such only with the
consent of the author.
The Role of Ca²
⁺
and K
⁺
in the Regulatory Volume Decrease Mechanism of
The Role of Ca² and K in the Regulatory Volume Decrease Mechanism of
Alligator mississippiensis Erythrocytes
Alligator mississippiensis Erythrocytes
Cover Page Footnote
Cover Page Footnote
I would like to thank my advisor Dr. Douglas Light for his guidance and tremendous patience throughout
this thesis project. I would also like to thank my committee members, Dr. Elizabeth Fischer and Dr. Nicole
Sleiter for their helpful suggestions and support. A special thank you to Dr. Karen Kirk for letting me use
her microscope to take some great pictures. Thank you to Chloe Wormser and Louise Mason for their
help in getting me started off on the right foot in lab. Lastly, thank you to my lab colleagues, Alina Spivak
add Lital Silverman; summers just would not have been the same without them!
Eukaryon, Vol. 5, March 2009, Lake Forest College
Senior Thesis
The role of Ca
2+
and K
+
in the regulatory volume decrease
mechanism of
Alligator mississippiensis
erythrocytes
Shruti Pore*
Department of Biology Lake Forest College Lake Forest, Illinois 60045
Abstract
All cells need to maintain a state of homeostasis in order to perform the functions necessary to sustain life. Osmotic homeostasis is especially important in animal cells because they lack a cell wall and are often faced with water flux across the plasma membrane. When placed in a dilute (hypotonic) solution, cells swell. In order to return to their homeostatic volume, they initiate a regulatory volume decrease (RVD) response that results in selective loss of osmolytes and water (O’Connor and Kimelberg, 1993). Although volume regulation is an essential property of animal cells, the underlying mechanisms of RVD, including the signal transduction pathways involved with this process, are not well understood and appear to vary between species and even between cell types within an organism (Basavappa et al., 1998, Okada, 2004). My study focused on the specific RVD signaling pathways in Alligator
mississippiensis erythrocytes. Cells were subjected to a
hypotonic shock (0.5X Ringer), and thereafter volume recovery was measured electronically over 40 minutes. Extracellular calcium (Ca2+e) was found to play an
important role in RVD, because volume recovery was inhibited when this ion was buffered to 10 or 1000 nM with EGTA. It also was determined that Ca2+ likely
entered the cell through an ATP-gated purinoreceptor (hexokinase, an ATP scavenger, inhibited RVD), thereby leading to K+ efflux through a quinine-sensitive channel. In addition, studies with gramicidin showed that the efflux of K+ was a rate limiting step during volume recovery. Furthermore, a fluorescence microscopy protocol using a Ca2+-specific probe (fluo-4, AM) was investigated as a potential protocol for qualitatively examining levels of intracellular calcium during RVD. Introduction
Cells were dubbed as the ‘basic units of life’ by Schleiden and Schwann in 1839 (Mazzarello, 1999). They are specialized to perform different functions necessary to sustain life. To carry out their tasks efficiently, they need to maintain a relatively steady internal environment, a trait which is universal for all cell types and is known as homeostasis (Okada et al., 2001). Homeostasis, a term coined by Sir Walter Cannon (Goldstein and Kopin, 2007), is especially evident when cells are exposed to environments in which their internal balance of metabolic activities is disrupted. An example of a stressful environment is when cells are exposed to either hypotonic or hypertonic media; i.e., a medium of a different tonicity compared to the internal cellular environment.
Tonicity and Osmolality
Tonicity describes the movement of water (H2O) across a
________________________________________________
*This author wrote the paper as a Senior thesis under the direction of Dr. Douglas Light.
cell membrane in response to a gradient formed as a result of a difference in the concentration of intracellular and extracellular dissolved particles, governed by the permeability of the cell membrane. For instance, when a cell is exposed to a hypotonic medium, there is water influx that causes the cell to swell. Conversely, when water moves out of a cell, causing the cell to shrink, the medium is termed hypertonic. An isotonic environment is one in which a cell neither shrinks nor swells due to a balance in the concentration of dissolved particles on both sides of the plasma membrane (Lang and Waldegger, 1997). Dissolved particles are known as osmolytes in this case, and their concentration is referred to as osmolality; osmolality is defined as the number of dissolved particles per kilogram of water.
Regulatory Volume Decrease (RVD)
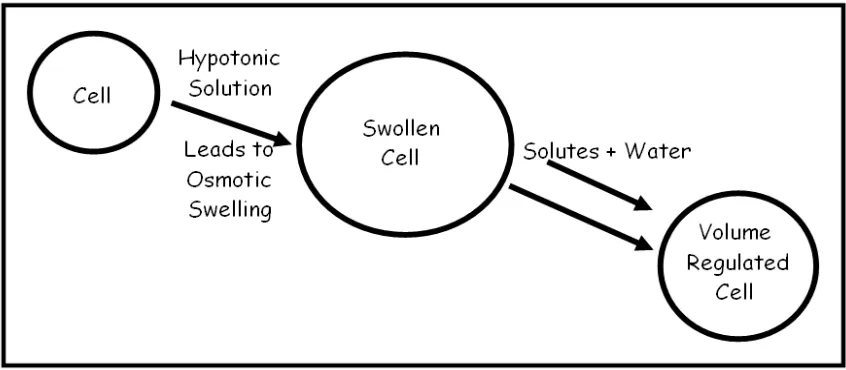
When an animal cell is exposed to medium of lower osmolality compared to self, it swells as a result of water influx. To maintain a state of homeostasis, the cell initiates a regulatory volume decrease (RVD) mechanism, usually returning to near its original volume. During RVD, a cell initiates compensatory mechanisms by which it selectively loses osmolytes (Light et al., 1999; Waldegger et al., 1998). This process results in a lower concentration of osmolytes inside the cell as compared to the outside, which allows for water efflux and subsequent volume recovery (Figure 1).
Unlike animal cells, plant cells are surrounded by a polysaccharide cell wall that protects them from the osmotic pressure due to changes in concentration of the various osmolytes in the extracellular environment (Stein, 2002). However, animal cells, which lack a rigid cell wall, need to be in osmotic equilibrium with their surroundings, and thus the RVD process is especially important. The cell membrane, which separates the internal and external cellular environments, is therefore crucial in maintaining a cell’s osmotic balance and as a result, homeostasis.
The cell membrane
All cell membranes are made of phospholipids arranged to form a bilayer with hydrophobic lipid tails and hydrophilic phosphate heads oriented in such a way that all hydrophobic regions are together in the center and all the hydrophilic regions are in contact with the cytosol and extracellular medium (Singer and Nicolson, 1972).The bilayer is fluid in nature and is embedded with a variety of proteins; hence it is referred to as “fluid mosaic.” Proteins typically make up about 50% of the total cell membrane (Alberts et. al. 2004). They may either span the membrane and be exposed to the cytosol and the extracellular fluid on either side, or they may be attached to just one side of the membrane (Singer and Nicolson, 1972).
Figure 1. Regulatory volume decrease (RVD) in animal cells. A cell swells when placed in a hypotonic medium as a result of the influx of water (due to osmosis). In response, the cell selectively loses osmolytes and osmotically obliged water, returning it to near original cell volume through a process called regulatory volume decrease (Lang et al., 1998)
The importance of membrane proteins in volume regulation
Membrane transport proteins are closely associated with maintaining homeostasis in the cell. They achieve this through the regulation of movement and concentration of osmolytes and osmotically obliged water within the cell relative to its outside (Hill et al., 2004). Channels and other transport proteins may be classified into two categories based on their use of ATP. The first category includes proteins involved in passive transport, such as ion channels and carrier proteins involved with facilitated diffusion. One example of facilitated diffusion is the glucose transporter that aids in its flux across membranes (Hill et al., 2004). Passive transport proteins do not require ATP The second category of transporters includes those proteins that use ATP to move ions across the cell membrane, such as the Na+-K+ pump (Hill et al., 2004). These proteins participate in active transport.
Ions account for the majority of the osmolytes in the intra- and extracellular environments. Changing their relative concentrations inside or outside the cell has a great impact on osmolality and consequently cell volume. Therefore, the use of ion channels and other ion transport mechanisms in the maintenance of a stable cell volume is of great significance (Lang et al., 1998). There are many types of ion transporters and ion channels. Some ion transporters include the Na+-H+ and Cl--HCO3- antiporters and the Na+ -K+-2Cl- and Na+-Cl- symporters (Okada et al., 2001). Ion channels allow for transport of ions across the membrane down their electrochemical gradient. Some of these may be voltage-gated; i.e., they may be activated by a depolarization of the cell membrane (Pasantes-Morales et al., 2006). Other channels may be mechanosensitive; i.e., they activate directly in response to changes in cell volume (O’Neill, 1999). A third class of channels may be ligand-gated; they are activated as a result of binding to a specific ligand (Wimmers et al., 2007).
Pumps, which are involved in active transport, may enable volume regulation by pumping ions across the cell membrane, into or out of the cell. In fact, one of the most ubiquitous proteins implicated with cell volume regulation is the ubiquitous Na+-K+ pump (Hill et al., 2004). This pump is especially important in volume regulation during “steady state” in which cells are under osmotic stress due to changes in osmolality from protein synthesis and degradation, or accumulation of carbohydrates and/or amino
acids and other metabolites in the course of normal metabolic activities (Lang et al., 1998).
For a typical animal cell, the concentration of Na+
outside is greater than on the inside (Lang et al., 1998).
Conversely, K+ ions are the abundant osmolytes in the
intracellular environment. The cell membrane is typically not very permeable to Na+ ions, but is highly permeable to K+ ions (due to open K+ channels at rest). During the course of
normal metabolic activities, cells may accumulate various organic molecules that increase the intracellular osmolality. To offset this increase, cells pump out three Na+ ions for every two K+ ions pumped in using the Na+-K+ pump (Morth et al., 2007). Sodium ions being relatively impermeable do not reenter the cell even though they are in lower concentration inside. On the other hand, K+ ions move down their concentration gradient, eventually heading out of the cell. This results in a depolarization of the cell, which provides a driving force for Cl- ions to flow out of the cell
thereby offsetting the loss of positively charged K+ ions. Thus, there is a net loss of ions that negates the net gain of other osmolytes accumulated in the cell over the course of daily metabolic activities (Lang et al., 1998).
Cell volume regulation: mechanisms and applications
Cell volume regulation may also be carried out by the efflux of organic osmolytes that contribute to the intracellular osmolality (Lang and Waldegger, 1997). This group of organic molecules includes polyols, such as inositol and sorbitol, methylamines, such as betaine and glycerophosphorylcholine, as well as amino acids and their derivatives like taurine (Lang and Waldegger, 1997). These molecules are especially important because, unlike ions, they do not affect the stability of proteins inside the cell, nor do they impair cellular function (Burg et al., 1996).
As stated previously, the maintenance of a steady cell volume is important in cell homeostasis and in the regulation of metabolic activities. Cells therefore have a need to maintain cell volume. However, cells often exploit changes in cell volume to regulate other cellular functions. Some of these include hormone-dependent regulation of body functions, gene transcription, protein translation, and regulation of gene expression, that can all be directed by altering cell volume (Lang and Waldegger, 1997).
One notable example involves the hormone insulin, which helps regulate blood sugar levels, and is secreted when there is an elevated concentration of plasma glucose (Lang and Waldegger, 1997). Insulin stimulates the transport of sodium, potassium, and chloride ions across the membrane in hepatocytes and pneumocytes (Lang et al.; 1998, Lang, 2007). This net movement of ions across the cell membrane causes cells to swell, resulting in the termination of protein and glycogen breakdown. Conversely, low blood sugar levels stimulate the release of glucagon that initiates cell shrinkage, thereby stimulating the breakdown of glycogen in cells (Lang and Waldegger, 1997; O’Neill, 1999). Cell volume changes have also been implicated with gene transcription and regulation (Burg et al., 1996). In fact, cell volume alterations may not only stimulate transcription of membrane proteins associated with volume regulation (Lang and Waldegger, 1997), but also the transcription of heat shock proteins that act to protect other proteins in the cytoplasm during cell volume alterations (Burg et al., 1996). A possible pathway for this mechanism has been proposed by Lang and Waldegger (1997) that suggests the activation of a secondary messenger molecule in response to changes in cell volume. This messenger may in turn bind to what has been termed “cell volume response elements” in the nucleus and thus regulate gene expression (Lang and Waldegger, 1997).
It is therefore evident that cell volume is an important consideration of all cells. Not only are there mechanisms in place to maintain a state of homeostasis with regards to cell volume, but cells also exploit alterations in this fundamental property to regulate other biochemical processes.
Regulatory volume decrease (RVD) mechanisms
Regulatory volume decrease (RVD) is one of the processes by which cells regulate their volume. Upon exposure to a hypotonic solution, cells swell. To recover, they initiate a RVD response characterized by the selective efflux of solutes and passive flow of water out of the swollen cell. Although the mechanisms of RVD vary for different cell types (Light et al., 2003), it generally occurs through the efflux of ions or other organic osmolytes followed by passive transport of osmotically obliged water (Light et al., 1999; Waldegger et al., 1998).
These osmolytes may be lost in the form of K+ and Cl- through electroconductive ion channels (Wimmers et al., 2007), as in the case of lymphocytes and Ehrlich ascites tumor cells (Okada, 2004), or by electroneutral cotransporters, such as the K+-Cl- symporter found in human
red blood cells (Adragna et al., 2000) and Necturus
gallbladder cells (Okada, 2004). In addition, RVD may also
take place through the use of mechanosensitive ion channels (Lang and Waldegger, 1997). These channels may be regulated by interactions with the actin cytoskeleton, whereby cell volume changes directly stimulate the opening or closing of ion channels (Lang and Waldegger, 1997). An example of this mechanism has been observed in the swelling-activated K+ channels of human melanoma cells (Pedersen et al., 2001). The cytoskeleton also regulates cell volume by serving as an anchor for ion transporters, such as epithelial Na+ channels, as well as by regulating the insertion of various transport proteins in the cell membrane, which in turn, contribute to the RVD process (Pedersen, et al., 2001).
The importance of regulatory volume decrease (RVD) mechanisms
The importance of RVD is especially evident from its role in apoptosis (Lang et al., 2004) and necrosis (Okada et al., 2001), as well as its implication for cells and organisms exposed to environments of continually changing osmolalities (Lang et al., 1998). As stated before, the RVD process is associated with the efflux of various solutes, such as K+ and Cl-, passively followed by water.
In the case of cells which have been damaged or injured, the RVD mechanism may become impaired and lead to cell death through necrotic volume increase. In this case, cells accumulate Na+ ions, and then ATP stores are depleted as a consequence of membrane leakage and an overworking of the Na+-K+ pump. This, in turn, stops pump
activity, thereby leading to further accumulation of Na+ within the cell. This increase in cellular osmolality leads to an influx of water causing cells to swell. The resulting volume change is known as necrotic volume increase and is uncontrolled; it thus results in cell lysis and eventual cell death (Okada et al., 2001).
Necrotic volume increase is especially important in the clinical condition of ischemia, which is an insufficient supply of blood to a particular area of the body that deprives the affected part from oxygen-rich blood, resulting in anoxia (Farber et al., 1981). This, in turn, leads to necrotic volume increase of the affected cells through sodium accumulation and resultant cell swelling (Okada et al., 2001). If the mechanisms underlying RVD are better understood, they might be used to induce an RVD-like response in ischemic cells to reverse necrotic volume increase and the resultant lysis.
Another important implication of RVD is seen with its involvement in the process of apoptosis (programmed cell death). The mechanism of apoptosis, which is designed to eliminate potentially harmful or overly abundant cells (Lang et al., 2004), is carried out through the activation of specific receptors such as CD95 (Okada et al., 2001). It is characterized by the activation of intracellular enzymes (caspases), changes in the symmetry of the plasma membrane, cell shrinkage, and DNA fragmentation and nuclear condensation (Lang et al., 2004; Okada et al., 2001).
It turns out that apoptosis is regulated by an RVD-like mechanism. During this process, the loss of osmolytes followed by water results in the shrinkage of cells. However, due to the activation of death receptors, such as CD95, the sensitivity of the cell to osmolyte loss is altered, resulting in shrinkage below normal cell volume. This shrinkage is known as apoptotic volume decrease (AVD). This AVD mechanism then stimulates the activation of caspases that result in cell death (Okada et al., 2001). If the mechanisms underlying RVD were better understood, they might be used to create pharmaceuticals that stimulate AVD and eventual apoptosis in cancer cells, which do not normally display programmed cell death (Yang et al., 2008)
al., 2007). For example, many invertebrate animals that live in intertidal regions are often osmoconformers; i.e. their osmolality mimics the external environment. These organisms may routinely experience a change in osmolality in their external environment anywhere from 5-1000 mOsm/kg H2O (Hill et al., 2004). These relatively rapid
changes in their external environment necessitate highly regulated RVD mechanisms to ensure their survival.
However, even organisms that do not live in extreme environments have a need to regulate the volume of certain cells, especially those exposed to extracellular environments with rapid fluctuations in osmolality. This type of volume regulation is especially important in the cells of the renal medulla of the mammalian kidney that are exposed to extracellular osmolality that may vary from isotonicity to a value of 1400 mOsm/L H2O (Lang, 2007). Erythrocytes that
pass through the renal medulla are also exposed to this high fluctuation in osmolarity. Similarly, cells of the intestine that absorb nutrients into the blood stream uptake molecules, which causes changes in their internal osmolality that would result in cell swelling if there were no volume compensation (Lang et al., 1998). Likewise, liver cells swell after the consumption of water to buffer the blood osmolarity from rapid fluctuations (Lang, 2007).
The abundance of changes in cell volume due to exposure to an anisosmotic environment compel the presence of compensatory mechanisms, such as RVD, that are able to control cell volume changes in response to variations in the environmental osmolality. Therefore, volume regulation is an essential property of all cells and the RVD mechanism is an important tool for its regulation.
As stated above, volume regulation is an essential property of animal cells (Light et al., 1999), and it is well established that when cells swell, they recover by initiating an RVD response that results in selective loss of osmolytes and water (O’Connor and Kimelberg, 1993). However, the underlying mechanisms of RVD are not well understood and appear to vary between species and even between cell types within a given organism (Basavappa et al.; 1998, Okada, 2004). Therefore, the mechanisms that regulate RVD and the signal transduction pathways by which RVD occurs remain to be elucidated.
Alligator mississippiensis Erythrocytes as a Model for Studying RVD
For my research, I studied mechanisms that regulate and allow for RVD using Alligator mississippiensis erythrocytes as a model system. One advantage of using this cell type is that erythrocytes are free floating cells, not attached to a substrate like epithelial cells. This property allows for the measurement of cell volume using available instrumentation. In addition, alligator erythrocytes are nucleated, which allows for protein synthesis and this in turn leads to alterations in the cell volume (Lang, 2007). As stated previously, the presence of protein synthesis and degradation processes indicate the need for volume regulatory mechanisms to compensate for the change in intracellular osmolarity (Lang et al., 1998). Therefore, it is highly plausible that alligator erythrocytes have a well-developed RVD response.
Another reason alligator red blood cells (RBCs) are a good model for studying RVD is that this species hibernates from September until late spring, and during this time, alligators do not consume food (Rosenblatt, 1936). In addition, while hibernating, kidney function is greatly reduced, which inevitably leads to an accumulation of osmolytes and electrolytes within the body of the organism, effectively changing the osmolality of the extracellular environment (Zancanaro et al., 1999). The ability of alligators to cope with the homeostatic challenges of hibernation suggests that their RBCs possess a well-developed RVD mechanism that may enable them to respond to changing osmolalities.
Furthermore, alligators are ectothermic animals; i.e. their body temperature is often similar to the ambient temperature. Therefore, experiments conducted at room temperature are at physiologically relevant temperatures for reptilian cells. Alligator erythrocytes are also much larger than human red blood cells; they are about 11 µm wide and 21 µm in length (Figure 2) (Hartman and Lessler, 1964) and have a volume roughly four times larger than human erythrocytes (Jensen et al., 1998). This makes the cells good candidates for imaging under the microscope, as well for ease of cell volume measurement, which is facilitated by cells significantly larger than bacteria.
Specific Aims
The overall goal of my study was to examine regulatory volume decrease (RVD) in erythrocytes of the American alligator. As described above, these cells have many properties indicating they would be a good model system for this type of study. The specific aims of my thesis were as follows:
1. To determine whether Ca2+ plays a role in RVD. The
rationale for specifically focusing on calcium was because it is a ubiquitous signaling agent and it has been linked to volume regulation in other cell types (Berridge et al., 2000).
2. To elucidate some of the specific mechanisms that regulate RVD. Given the importance of volume regulation for individual cells and the potential clinical applications of RVD, it is important to gain a better understanding of this cellular process. Furthermore, the underlying pathways associated with cell volume vary between species and even between cell types within species (Basavappa et al.; 1998, Okada, 2004), making studies using different cell types appropriate and valuable.
3. To design a protocol using fluorescence microscopy to examine qualitative changes in cytosolic levels of calcium. This technique would complement well the cell volume studies by allowing two different experimental approaches to address similar questions.
Materials and Methods
Thesis project plan
The first goal of my project was to determine whether extracellular calcium is involved in RVD. This would be accomplished by observing the effect of depleting this ion from the extracellular medium. If this resulted in an inhibition of RVD, my hypothesis that extracellular calcium is important in RVD would be confirmed. In contrast, if there was no inhibition, then I would predict that intracellular stores may be involved in RVD. Alternatively, the contributions of both extracellular and intracellular calcium stores to this mechanism could be examined.
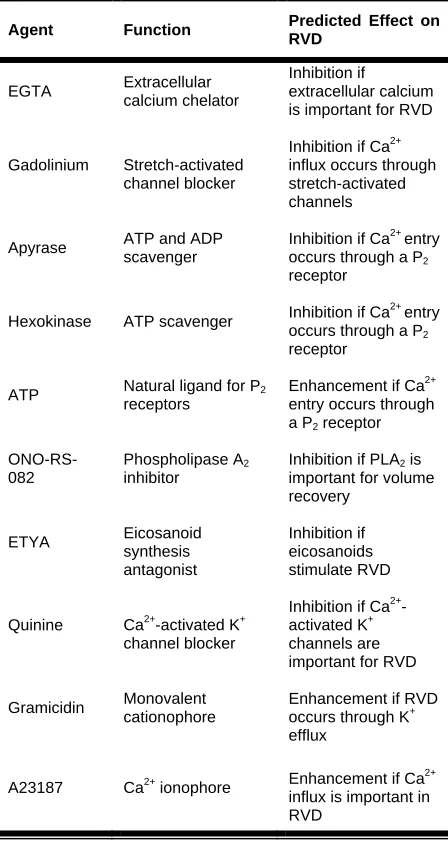
If my results indicated a potential role for extracellular calcium, I would next examine transport pathways for the influx of this ion. Since erythrocytes are not excitable cells like neurons or muscle cells, I would examine the role of ligand-gated channels and stretch-activated channels but not voltage-gated channels (Clapham, 1995). I would also be able to identify the channel type by examining the affect of specific pharmacological antagonists and agonists on volume regulation. An inhibition of RVD due to the action of a potential antagonist would indicate which particular channel or transport pathway was involved. Similarly, potentiation of RVD with an agonist would indicate the involvement of a particular channel or pathway as well. No response after treatment would suggest that the particular channel or pathway was not important for RVD. Taken together, these results could then indicate a mechanism for calcium entry and action. Similar to the experimental strategy for studying calcium, an agonist-antagonist combination would be used to decipher the identity of solutes that leave cells during RVD [Refer to Table 1 for a list of pharmacological agents used in my studies, as well as their predicted effects].
My final goal was to develop a viable protocol to examine qualitative changes in the concentration of intracellular calcium during RVD using fluorescence microscopy. To accomplish this, I would look at cells incubated with a fluorescent probe under conditions of varying tonicity. This would enable me to determine whether the protocol being used was capable of detecting changes in
calcium levels, which would complement well data from cell volume measurement experiments.
Experimental design for cell volume experiments
Cells were given hypotonic shock (0.5x Ringer) and their volume was measured over time, taken at predetermined intervals. Cells in hypotonic Ringer that underwent ‘normal’ RVD mechanisms were the control. Cells that experienced hypotonic shock due to exposure to hypotonic Ringer, but also containing a pharmacological agent, served as the experimental. Pharmacological agents that were predicted to either enhance or antagonize RVD mechanisms were added to elucidate the properties and regulation of this process. For example, if calcium was hypothesized as part of the RVD pathway, the calcium ionophore A23187 was added to examine the potential involvement of calcium. It was hypothesized that if calcium was truly involved, RVD should be enhanced with A23187. If not, then there would be no effect on RVD as seen by cell volume measurements over time.
Agent Function Predicted Effect on RVD
EGTA Extracellular
calcium chelator
Inhibition if
extracellular calcium is important for RVD
Gadolinium Stretch-activated
channel blocker
Inhibition if Ca2+ influx occurs through stretch-activated channels
Apyrase ATP and ADP
scavenger
Inhibition if Ca2+ entry occurs through a P2
receptor
Hexokinase ATP scavenger Inhibition if Ca
2+
entry occurs through a P2
receptor
ATP Natural ligand for P2
receptors
Enhancement if Ca2+ entry occurs through a P2 receptor
ONO-RS-082
Phospholipase A2
inhibitor
Inhibition if PLA2 is
important for volume recovery
ETYA Eicosanoid
synthesis antagonist
Inhibition if eicosanoids stimulate RVD
Quinine Ca2+-activated K+
channel blocker
Inhibition if Ca2+ -activated K+ channels are important for RVD
Gramicidin Monovalent
cationophore
Enhancement if RVD occurs through K+ efflux
A23187 Ca2+ ionophore Enhancement if Ca
2+
influx is important in RVD
Cells
Alligator mississippiensis whole red blood, with Alsevers anticoagulant was obtained from Carolina Biological Supply (Burlington, NC). Blood was stored in small aliquots in either 50 ml or 15 ml (sterile plastic tubes) at 4°C.Blood was inverted daily to ensure that the red blood cells (RBC) did not settle at the bottom of the tubes. The tubes were also left open to allow access to oxygen. Blood was stored for no longer than 3 weeks. The osmolality of the alligator blood plasma was 320 mOsm/kg H2O.
Osmolality and pH measurements
Osmolality was determined using a Wescor 5500 Vapor
Pressure Osmometer (SD of ± 2 mmol/kg H20). The
Osmometer was standardized using known Opti-Mole standards of 100 ± 2 mmol/kg H2O, 290 ± 2 mmol/kg H2O,
and 1000 ± mmol/kg H2O. The pH for all solutions was
measured using an Acumet ® Basic AB15 pH Meter from Fisher Scientific at room temperature (21-23°C). The pH meter was standardized using Orion pH buffers of known pH manufactured by Thermo Electron Corporation (pH = 4, 7, and 10). All solutions used in this study were at a pH between 7.3 and 7.4, which was adjusted using 1N HCl or 1M NaOH if the measured pH fell outside the acceptable range. All osmolality measurements were taken after HCl or NaOH were added to account for any change in osmolality due to their addition.
Microscopy
Cell microscopy was performed with a Nikon TE 2000-U microscope using Metamorph®6.2r6 software at a magnification of 600x. RBCs were photographed in isosmotic Ringer solution with 5 mM glucose and 1 mM sodium bicarbonate.
Z2™ Coulter Counter® and cell volume measurements
A Z2™ Coulter Counter® (Figure 3) was used to measure cell volume over time, using an aperture of 100 m in diameter.
It works on the Coulter principle that is based on Ohm’s Law (V=IR). As particles pass through the aperture, a change in impedance is registered as voltage, or current pulses, that are then converted to volume (http://www.beckmancoulter.com). For each measurement, a metering volume of 0.5 mL was drawn from the Ringer solution containing RBCs. Whole blood was diluted 10,000x to obtain a final RBC count between 15,000 and 40,000 cells per metering volume drawn. In addition the Z2™ Coulter
Counter® was set to measure a volume between 150 and
800.5 fL, which allowed me to ignore potential bacterial contaminants. For volume measurements, the median volume (in fL) was used. The influence of white blood cells on the volume was ignored due to their small proportion of 1:1000 to red blood cells (www.medicinenet.com).
Blood was given hypotonic shock at time t = 0 min. Cell volume measurements were taken every minute for three minutes, starting at time t = 1 min. Thereafter, cell volume measurements were taken at time t = 5 min and t = 10 min, and after that at intervals of 10 min until time t = 40 min. Cell counts were recorded at time t = 1min and time t = 30 min to ensure that all readings had a sufficient sample size. As a general rule, all predicted antagonists of the RVD mechanism were added 5 minutes before t = 0 min, whereas all expected agonists of the RVD mechanism were added at maximum cell volume (t = 1 min).
In addition to the above measurements, the volume of cells in isotonic ringer was measured each day. This cell volume was measured immediately after addition of the RBCs to the isotonic Ringer and calculated as an average of three cell volume measurements. The relative cell volume was calculated by dividing all absolute cell volume measurements by the average isotonic cell volume measurement for that day. This allowed for comparisons of cell volume measurements taken on different days by accounting for the difference in basal conditions for each day.
In addition to the above measurements, the volume of cells in isotonic ringer was measured each day. This cell volume was measured immediately after addition of the RBCs to the isotonic Ringer and calculated as an average of three cell volume measurements. The relative cell volume was calculated by dividing all absolute cell volume measurements by the average isotonic cell volume measurement for that day. This allowed for comparisons of cell volume measurements taken on different days by accounting for the difference in basal conditions for each day.
The percent recovery of cells (as compared to control) was used to quantify RVD, thereby allowing for comparisons between the effects of various pharmacological agents on the RVD process. The percent recovery was calculated using an equation adapted from Light et al. (2003) that is as follows: [(VCONTROLMAX-VXMIN)/(VCONTROL MAX
-1)*100%], where VCONTROLMAX is the maximum relative
volume for the control (t = 1 min) and VXMIN is the relative
volume of either the control or the experimental at t = x min (for all experiments this was taken at x = 40 min).
Fluorescence microscopy
Fluorescence microscopy experiments were aimed at designing a protocol to examine the role of calcium in RVD. The calcium-specific fluorescent probe was fluo-4, AM,
which has a Kd (Ca2+) of 345 nM, (Molecular Probes;
Eugene, OR) was used for this purpose. All cells were incubated in isotonic Ringer with 5.5 mM glucose, 1 mM sodium bicarbonate, and the fluorescent probe solution (in DMSO) with a final working concentration of 10 M. Whole blood was diluted 5x, whereas the aqueous solutions of glucose and sodium bicarbonate were diluted 100x, and the fluorescent probe solution was diluted 1000x from a stock solution.
Cells were incubated with or without Pluronic® F-127 (detergent in 20% DMSO diluted 1000x) at 4°C for 1.5-2 hours (Molecular Probes, Eugene, OR). Pluronic® F-127 was
used to aid in the dispersion of the probe across the cell membrane (Poenie, 1986), and experiments without it were performed to rule out any non-specific effects Pluronic® F-127 might have on RVD.
Thereafter, samples were centrifuged at 2000 rpm for 2 min and then allowed to incubate for 30-60 min in fresh isotonic Ringer (Light et al., 2003), with 5.5 mM glucose and 1 mM sodium bicarbonate. At the end of the incubation period, cells were resuspended again in isotonic Ringer containing glucose and sodium bicarbonate, and then photographed. Following this, cells were either given a hypotonic shock by adding an equal volume of (0.25x) hypotonic Ringer to the isotonic Ringer solution, whereas cells in isotonic Ringer served as the negative control, and cells in isotonic Ringer with A23187, (a Ca2+-ionophore;
MacLeod et al., 1992) served as the positive control. Cells were either photographed with a Zeiss Axiovert 100 microscope using Metamorph®6.1r0 software (Universal Imaging Corp.) or with a Nikon TE 2000-U microscope using Metamorph®6.2r6 software with an exposure time of 3000 msec at a magnification of 400x. For any given experiment, only cells photographed using the same microscope and the same imaging parameters were used for comparison purposes.
Solutions and reagents
Ringer solutions (solutions which mimic blood plasma) were made using the amphibian Ringer solution as a guide (http://www.mbl.edu). The isotonic ‘high Na+’ Ringer (with an
osmolality approximately equal to the blood plasma) consisted of (in mM) 150 NaCl, 6.0 KCl, 6.0 CaCl2, 1.5
MgCl2, 4.55 Hepes acid and 5.45 Hepes base. Glucose (5.5
mM) was added to the solutions to serve as an energy source for the cells and 1 mM sodium bicarbonate was added to clear up any cellular debris due to lysed cells (Hoar and Hickman, 1983). The hypotonic ‘high Na+’ Ringer was made by using 70 mM NaCl (0.5x) or 25 mM NaCl (0.25x). ‘Low Na+’ Ringer was made by substituting NaCl with choline chloride (used with all gramicidin experiments because choline is too large to permeate Na+ channels; Han and Bell,
2003), whereas ‘High K+’ Ringer was made by substituting NaCl with KCl. ‘Low Ca2+’ Ringer was made by using 0.5
mM CaCl2 and adding ethylene glycol-bis
(2-aminoethylether) - N, N, N’, N’ – tetraacetic acid (EGTA) – a calcium chelator and Trizma base in varying concentrations. Calculations to determine the amount of EGTA to be added were performed using Max Chelator software (http://www.stanford.edu/~cpatton/maxc.html). Trizma base was used to maintain the pH of the solution. To obtain free calcium concentrations of 10 nM and 1000 nM, 4.36 mM EGTA and 17.4 mM Trizma base or 0.894 mM EGTA and 3.58 mM Trizma base were added, respectively.
All isotonic Ringer solutions had an osmolality of 300 ± 10 mOsm /kg H2O and all hypotonic Ringers had an
osmolality of 165 ± 10 mOsm /kg H2O. All solutions were
filtered with a 0.8 µm Advantec cellulose acetate membrane filter prior to use to remove potential debris and bacteria.
Chemicals were obtained from Sigma-Aldrich chemicals (St. Louis, MO), Alexis Corporation (San Diego, CA), MP Biomedicals (Santa Ana, CA), and Molecular Probes, (Eugene, OR). All stock solutions were stored for a maximum of 1 day and experiments were carried out at room temperature (21-23°C). Aqueous stock solutions were diluted 100x, whereas non-aqueous stock solutions (solutions in ethanol, methanol, etc.) were diluted to 1000x to obtain the final working concentrations (this was done to avoid any potential non specific effects due to the vehicle molecules). Furthermore, the vehicle was also added to the control solutions. For all apyrase experiments, the apyrase was added directly to the Ringer solution to obtain the final working concentration.
Data analysis
Data were plotted using KaleidaGraph®3.6.4 (Synergy Software) and Microsoft Excel ®11.3.7 (Microsoft Corporation). Statistical significance was determined using a paired student’s t-test or ANOVA/MANOVA, as was appropriate (Data Desk Software Ithaca, NY). A p value
0.05 was considered significant. Variance was determined for t = 1 min and t = 40 min.
Results
Role of extracellular calcium (Ca2+) in alligator erythrocyte RVD
Calcium is a ubiquitous signaling agent, used in a myriad of metabolic pathways in the body (Berridge et al., 2000). With this in mind, I hypothesized that extracellular calcium may be involved in the RVD pathway in alligator erythrocytes. To test this, I used the calcium chelator EGTA (ethylene glycol-bis(2-amino-ethylether)-N,N,N’,N’-tetra-acetic acid,) to regulate the amount of extracellular free calcium (Altamirano et al., 1998). The molecule, EGTA, has a high affinity for calcium ions, so that they are not ‘free’ to interact with other ions or molecules (Altamirano et al., 1998).
Two different concentrations of extracellular calcium (Ca2+e) were used for this series of experiments.
This allowed me to better discern whether Ca2+ is involved in RVD and if there is a concentration-dependent effect. I used
10 nM and 1000 nM free Ca2+
e EGTA Ringer [most cells
have an intracellular calcium (Ca2+i) concentration of
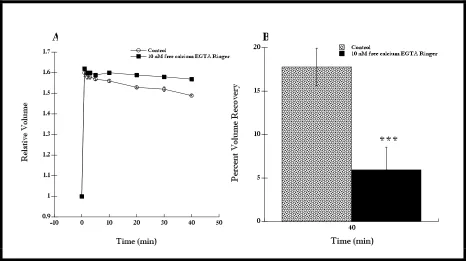
extracellular concentration of calcium to 10 nM resulted in an inhibition of RVD (Figure 4A, P < 0.001 at 40 min). The percent volume recovery of cells in this case was also significantly less than that of the control cells (Figure 4B, P < 0.001 at 40 min). In addition, when RBCs were placed in the 1000 nM free calcium Ringer, they initially swelled more (Figure 5A, P < 0.001 at 1 min) and also recovered less compared to control cells (Figure 5B, P < 0.001).
Thus, restricting the amount of free extracellular calcium resulted in an inhibition of volume recovery, indicating that Ca2+e is indeed involved in RVD Interestingly,
cells in 10 nM free calcium EGTA Ringer did not swell more compared to control cells (Figure 4A). Furthermore, the percent volume recovery of cells in 10 nM free calcium EGTA Ringer was less (6.0%) compared to cells in 1000 nM free calcium EGTA Ringer (-24.4%). This demonstrated that cells in 10 nM free calcium exhibited an enhanced RVD compared to cells in 1000 nM free calcium.
Mechanism of calcium entry into red blood cells
Having established that Ca2+e is important for normal RVD, I
next examined how this ion entered cells. Calcium influx could occur through voltage-gated channels, ligand-gated channels (Clapham, 1995), and/or stretch-activated channels (Lang and Waldegger, 1997). Given that voltage gated channels are mostly found in excitable cells, such as muscle and neurons (Clapham, 1995), I decided not to test whether this is a possible avenue for calcium influx in alligator erythrocytes. Instead, I examined the role of stretch-activated channels as a calcium influx pathway.
Stretch-activated channels normally open in response to volume changes in cells (Lang and Waldegger, 1997), such as hypotonic-shock-induced swelling. I hypothesized that stretch-activated channels were involved
with calcium influx and tested this with gadolinium, an element that blocks stretch-activated ion channels (Boudreault and Grygorczyk, 2002). If these channels were involved with calcium influx, then adding gadolinium would result in an inhibition of RVD. However, if there were no inhibition with gadolinium, I would conclude that calcium did not enter via stretch-activated channels.
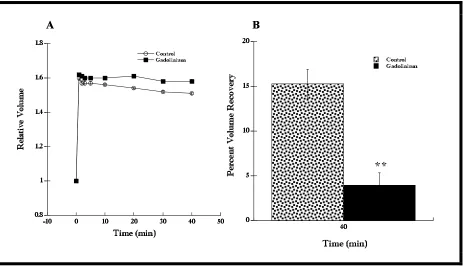
Cells incubated in 50 µM gadolinium (Clemo and Baumgarten, 1997; Robson and Hunter, 1994) showed a modest inhibition of RVD compared to control cells (Figure 6A, n = 6, P < 0.01 at 40 min). These cells also showed a volume recovery of 4.0% compared to the control (15.3%, Figure 6B). This difference in percent volume recovery for cells in both conditions (normal cells and cells in gadolinium) was statistically significant (Figure 6B n = 6, P < 0.01), indicating a potential role for stretch-activated channels during RVD.
Having established evidence for the presence of stretch-activated channels, I next wanted to determine whether ligand-gated channels also contributed to erythrocyte RVD. For this purpose, I looked at the involvement of P2 receptors (purinoreceptors), some of
which act as ligand-gated calcium-permeable channels (Windscheif, 1996). All P2 receptors are activated when
extracellular adenosine triphosphate (ATP) binds the receptor protein, thereby causing a conformational change,
allowing Ca2+ to permeate (Dubyak and el-Moatassim,
1993). To determine whether P2 receptors are involved in
RVD, I used apyrase, a molecule that cleaves the terminal phosphates from ATP, converting it to either AMP (adenosine monophophosphate) or ADP (adenosine diphosphate) (Schwiebert et al., 1995), thereby blocking the activation of thereceptor.
Figure 4. RVD response of cells in 10 nM free calcium EGTA Ringer was inhibited compared to the control. Cells quickly swelled after hypotonic shock at t = 0 min, which was maintained throughout the course of the experiment. (A) The EGTA Ringer limited the amount of free [Ca2+]e to 10 nM.
Cells in EGTA Ringer recovered less compared to control cells (n = 6, P < 0.001 at 40 min). There was no difference in the mean cell volumes of control cells and cells in EGTA Ringer at t = 1 min. (B) The percent volume recovery of cells in EGTA Ringer was less than the percent volume recovery of control cells (n = 6, P < 0.001); 6.0 ± 2.6%, and 17.8 ± 2.2%, respectively. Data shown as mean ± SE.
Figure 5. RVD response of cells in 1000 nM free calcium EGTA Ringer was inhibited compared to the control. Cells quickly swelled after hypotonic shock at t = 0 min, which was maintained throughout the course of the experiment. (A) The EGTA Ringer limited the amount of [Ca2+]e to
1000 nM. Cells in EGTA Ringer recovered less compared to control cells (n = 6, P < 0.001 at 40 min). Cells in EGTA Ringer also swelled more compared to control cells (n = 6, P < 0.001 at t = 1 min). (B) The percent volume recovery of cells in EGTA Ringer was less than the percent volume recovery of control cells (n = 6, P < 0.001); -24.4 ± 2.5%, and 16.8 ± 2.2%, respectively. Data shown as mean ± SE.
Figure 6. RVD response of cells in hypotonic Ringer with the stretch-activated channel antagonist gadolinium (50 µM) was modestly inhibited compared to control. (A) Cells in hypotonic Ringer with gadolinium recovered less compared to control cells (n = 6, P < 0.01 at 40 min). (B) The percent volume recovery of cells in Ringer with gadolinium was less than the percent volume recovery of control cells (n = 6, P < 0.01); 4.0 ± 1.4% and 15.3 ± 1.6%, respectively. Data shown as mean ± SE.
Figure 7. RVD response of cells in hypotonic Ringer with apyrase (10 units/mL). (A) Cells in hypotonic Ringer with apyrase recovered as much as control cells (n = 5). (B) The percent volume recovery of cells in hypotonic Ringer with apyrase was almost the same as the percent volume recovery of control cells (n = 5, P > 0.05); 17.6 ± 2.5% and 20.5 ± 1.3%, respectively. Data shown as mean ± SE.
The RVD response for cells in hypotonic Ringer with apyrase (10 Units/mL, Braunstein et al., 2001; Light et al., 1999; Wang et al., 1996) was not different than the RVD response of control cells (Figure 7A, n = 5). The percent volume recovery for control cells was 20.6%, whereas cells in apyrase had a 17.6% volume recovery (Figure 7B, n = 5, P > 0.05). These experiments suggested that P2 receptors
may not be involved in RVD.
To confirm these results, I chose to examine the effect of another ATP scavenger, hexokinase, an enzyme that cleaves the terminal phosphate from ATP (Schwiebert et al., 1995). Hexokinase is similar to apyrase in that it dephosphorylates ATP; however it only cleaves the terminal phosphate (Schwiebert et al., 1995). If hexokinase, like apyrase, had no effect on RVD, then I would infer that P2
receptors are not the mode of entry for calcium.
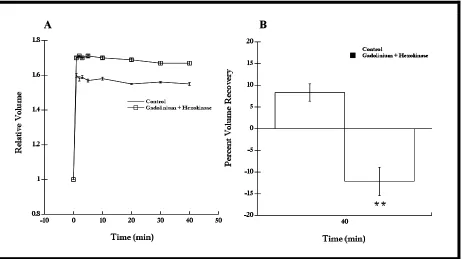
Hexokinase (5 Units/mL, Light et al., 2003; Wang et al., 1996) had a significant inhibitory effect on RVD (Figure 8A, n = 6, P < 0.01 at t = 40 min). That is, cells treated with hexokinase recovered less (-13.3%) compared to control cells (16.3%) (Figure 8B, n = 6, P < 0.01). Furthermore, cells in hexokinase swelled significantly more at t = 1 min compared to the control (Figure 8A, n = 6, P < 0.05). These data suggest that P2 receptors may be involved
in RVD.
Taken together, the results thus far suggested that both stretch-activated channels and P2 receptors played a
role in RVD. I next examined whether both transport pathways really were active during RVD, or alternatively, whether just one pathway was necessary for volume regulation. That is, if calcium influx involved both of these avenues of entry, I predicted that a ‘cocktail’ of gadolinium and hexokinase together would result in an additive inhibition of RVD. If, however, only one transport pathway was used, then the two antagonists would not have an additive effect, pointing toward calcium entry through either a P2 receptor or
a stretch-activated pathway.
Interestingly, the experiments showed that gadolinium and hexokinase together did not inhibit RVD in
an additive manner compared to hexokinase alone (Figure 9). The percent volume recovery of cells in both hexokinase and gadolinium was -12.1%, compared to 8.4% for control cells. However, this was similar to the percent volume recovery of cells with hexokinase alone (-13.3%), but not to cells exposed to just gadolinium (3.97%). In addition, cells treated with both gadolinium and hexokinase together swelled more than control cells and recovered less (Figure 9A, n = 6, P < 0.001 at t = 1 min, P < 0.01 at t = 40 min). Thus, cells in hypotonic Ringer with both these antagonists showed an inhibition of RVD (Figure 9B, n = 6, P < 0.01), but an inhibition similar to hexokinase alone.
I next looked at the effect of the endogenous ligand of P2 receptors, ATP (Windscheif, 1996), on RVD. I
reasoned that since P2 receptors appeared to be an
important mode of calcium entry into these cells, adding extracellular ATP, their natural ligand, should potentiate the RVD response. However, if RVD did not change after the addition of ATP, there could be a saturation of P2 receptors
with endogenous ATP that was released following hypotonic shock. Addition of ATP (50 µM, Ollivier et al., 2006; Light et al, 1999) did not have an effect on RVD (Figure 10A, n = 6, P > 0.05 at t = 40 min). For this experiment, the percent volume recovery of cells with ATP was 5.8% (Figure 10B).
Mechanism of calcium action following its influx into cells
Next, I looked at a probable mechanism of action for calcium following its influx into cells. For this purpose, I chose to examine two possibilities: the calcium-activated arachidonic acid mediated pathway and the direct action of calcium on ion channels. Calcium can activate phospholipase A2 (PLA2)
(Windscheif, 1996), which in turn metabolizes the phospholipid bilayer to form arachidonic acid (Basavappa et al., 1998). Arachidonic acid, or one of its metabolites (eicosanoids), may then lead to solute efflux from cells, thereby resulting in RVD (Pedersen et al., 2001). To examine the potential presence of the PLA2 pathway, I used
ONO-RS-082 (ONO), a PLA2 antagonist (Smalheiser et al.,
Figure 8. RVD response of cells in hypotonic Ringer with hexokinase (5 Units/mL), an ATP scavenger, was diminished compared to control cells. (A) Cells in hypotonic Ringer with hexokinase recovered less than control cells (n = 6, P < 0.01 at t = 40 min). In addition, these cells initially swelled more than control cells (n = 6, P < 0.05 at t = 1 min) (B) The percent volume recovery of cells in hypotonic Ringer with hexokinase was less than control cells (n = 6, P < 0.01); -13.3 ± 8.7% and 16.3 ± 3.3%, respectively. Data shown as mean ± SE.
Figure 9. RVD response of cells in hypotonic Ringer with hexokinase (5 Units/mL) and gadolinium (50 µM) was diminished compared to control cells. (A) Cells in hypotonic Ringer with hexokinase and gadolinium recovered less than control cells (n = 6, P < 0.01 at t = 40 min). In addition, these cells initially swelled more than the control cells (n = 6, P < 0.001 at t = 1 min) (B) The percent volume recovery of cells in hypotonic Ringer with hexokinase and gadolinium was less than control cells (n = 6, P < 0.01); -12.1 ± 3.3% and 8.4 ± 2.0%, respectively. Data shown as mean ± SE.
Figure 10. RVD response of cells in hypotonic Ringer with ATP (50 µM) was the same as control cells. (A) Cells in hypotonic Ringer with ATP recovered the same as control cells (n = 6, P > 0.05 at t = 40 min). (B) The percent volume recovery of cells in hypotonic Ringer with ATP appeared to be similar to that of control cells, 5.8 ± 2.8% and 9.6 ± 1.4%, respectively. Data shown as mean ± SE.
Figure 11. RVD response of cells in hypotonic Ringer with ONO-RS-082 (10 µM) was the same as control cells. (A) Cells in hypotonic Ringer with ONO-RS-082 recovered the same as control cells (n = 5, P > 0.05 at t = 40 min). (B) The percent volume recovery of cells in hypotonic Ringer with ONO was not significantly different than that of control cells (n = 5, P > 0.05), 10.2 ± 1.2% and 10.5 ± 3.0%, respectively. Data shown as mean ± SE.
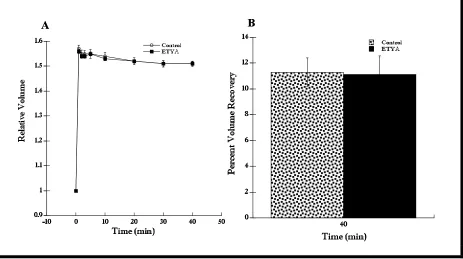
Figure 12. RVD response of cells in hypotonic Ringer with ETYA (10 µM) was the same as control cells. (A) Cells in hypotonic Ringer with ETYA added recovered the same as control cells (n = 6, t = 40 min). (B) The percent volume recovery of cells in hypotonic Ringer with ETYA (11.1 ± 1.4%) was not significantly different than that of control cells (n = 5, 11.3 ± 1.1%). Data shown as mean ± SE.
The inhibitor ONO-RS-082 (10 µM, Light et al., 1997; Kondo and Yonezawa, 2000) had no significant effect on RVD compared to control cells (Figure 11A, n = 5, P > 0.05 at t = 40 min). Furthermore, the percent volume recovery for control cells and cells with ONO were not significantly different (Figure 11B, n = 5, P > 0.05). This indicated that PLA2 was not involved with the action of
calcium during RVD.
To confirm these results, I repeated this experiment using ETYA (5,8,11,14-eicosatetraynoic acid), an antagonist of eicosanoids synthesis (Tinel et al., 1997). I hypothesized that if PLA2 was not involved in RVD, adding
ETYA, an antagonist of events downstream to PLA2
activation, should have no effect on RVD. The results using ETYA (10 µM Tinel et al., 1997; Kersting et al., 1993) confirmed the observations with ONO-RS-082. That is, ETYA had no significant effect on RVD (Figure 12A, n = 6). The percent volume recovery for control cells was 11.3%, whereas cells with ETYA displayed a percent volume recovery of 11.1% (Figure 12B, n = 6). Taken together,
these results all pointed in the direction of a PLA2
-independent pathway for the action of calcium.
The second pathway I investigated was designed to examine whether calcium directly activated potassium channels. The rationale for this part of the study was that potassium efflux has been widely implicated with RVD in various cell types (Basavappa et al., 1998). To test this hypothesis, I used quinine, a calcium-activated potassium channel blocker (O'Connor and Kimelberg, 1993). I hypothesized that if calcium directly activated potassium channels, adding quinine to these cells would result in an inhibition of RVD.
Quinine (5 mM, Nillus et al., 1995; Kaji, 1986) inhibited RVD (Figure 13A). Cells with this antagonist swelled more at t =1 min (n = 5, P < 0.05) and recovered
less (n = 5, P < 0.01 at t = 40 min) than control cells. The percent volume recovery of these cells was also significantly different compared to the control (Figure 13B, n = 5, P < 0.01), -22.0% and 11.0%, respectively. These results are consistent with the presence of a Ca2+-activated K+ channel and implicate K+ as a major solute leaving cells during RVD.
Role of potassium (K+) ions in alligator erythrocyte RVD Based on evidence from the above quinine studies, I further examined whether K+ is a primary solute leaving cells during RVD. To accomplish this I looked at RVD in control conditions (high Na+ Ringer) compared to cells bathed in a high K+ Ringer. The reason for using a high K+ Ringer was that it should abolish the endogenous concentration gradient favoring efflux of K+ ions. I hypothesized that cells in a high K+ Ringer would show a decreased RVD compared to cells in the control high Na+ Ringer.
Cells in a high K+ hypotonic Ringer did not show
an RVD response different from control cells (Figure 14A, n = 6). Interestingly, control cells initially swelled less than cells in the high K+ Ringer (n = 6, P < 0.01). In addition, the percent volume recovery of control cells was 8.7%, whereas cells in high K+ Ringer showed a percent volume recovery of
11.3% (Figure 14B).
Surprised by these results, I next examined the effect of pharmacologically enhancing K+ ion efflux. My rationale for this was that if K+ efflux is necessary for RVD, then a potentiation of this should enhance RVD. For this purpose, I used gramicidin, a monovalent cationophore (Civan et al., 1994), which, when used with choline as a substitute for
sodium in Ringer, can be made selective for K+ ions
(Mastrocola et al., 1991).
Bergeron et al., 1996) resulted in a robust RVD response in alligator erythrocytes (Figure 15A, n = 6, p < 0.001 at t = 40 min). The percent volume recovery of cells with gramicidin added (95.0%) was greatly enhanced compared to the percent volume recovery of control cells (23.8%, Figure 15B, n = 6, P < 0.001).Taken together, these results are consistent with the presence of a calcium-activated K+ ion efflux pathway, in which K+ efflux is the rate limiting step
during volume recovery.
Based on this finding, I next sought to confirm that potassium efflux occurred downstream to extracellular Ca2+ influx, as my previous results had indicated. To assess this, I first re-used hexokinase to inhibit RVD and then tried to reverse this inhibition by using gramicidin. If potassium efflux occurred downstream of calcium influx, then gramicidin should nullify the inhibitory effect of hexokinase.
It was again found, as expected, that hexokinase inhibited RVD and caused cells to swell more than control (Figure 16A, n = 5, P < 0.01 at t = 1 min). However, adding gramicidin reversed this inhibition, resulting in a RVD response that was more robust compared to control cells (Figure 16A, n = 5, P < 0.001). The percent volume recovery of control cells (Figure 16B, 19.4%) was far less than the percent volume recovery of cells with hexokinase and gramicidin together (96.9%, n = 5, P < 0.001).
The confounding effects of A23187
As shown by the studies with gramicidin, potassium efflux is a rate limiting step in the RVD of alligator erythrocytes because pharmacologically enhancing potassium efflux led to an enhanced RVD response. Using a similar logic for the influx of extracellular calcium, which is important for RVD, I proposed that increasing the amount of calcium influx with a calcium ionophore should also enhance RVD.
For this purpose, I used A23187, a calcium-specific ionophore (MacLeod et al., 1992). Since the concentration of extracellular calcium was far greater (6 mM) than the intracellular calcium concentration (typically 10-100
nM; Berridge et al., 2000), I reasoned that calcium would move down its concentration gradient, into the cell in the presence of A23187. This influx of calcium would, in turn, augment the natural RVD response of the erythrocytes in a similar fashion as gramicidin.
Surprisingly, the results were contrary to my initial
prediction. That is, A23187 (1 µM, added 1 min after
hypotonic shock when cells are maximally swollen, MacLeod et al., 1992; Light et al., 1999) did not enhance RVD as predicted, but in contrast, inhibited volume recovery. In fact, A23187 caused the cells to swell and remain swollen throughout the course of the experiment (Figure 17A, n = 6, P < 0.001 at t = 40 min). Further, the percent volume recovery (Figure 17B) of cells in hypotonic Ringer with A23187 (-38.2%) was significantly different from the percent volume recovery of control cells (20.2%, n = 6, P < 0.01).
Intrigued by the finding that A23187 inhibited RVD, I decided to further examine this phenomenon. Given that calcium entry during RVD has been shown to occur in a time dependent manner (McCarty and O’Neil, 1991), I examined whether the effect of A23187 after hypotonic shock was time-dependent. To accomplish this, I added A23187 at different time intervals following hypotonic shock and looked at the effect this had on RVD. Assuming the action of A23187 was time-dependent, I would expect there to be a difference in RVD as a result of adding A23187 at different times.
I first examined the effect of adding A23187 (1 µM) at 5 min after hypotonic shock. Cells swelled immediately and dramatically in this case (Figure 18A), indicating there was a significant inhibition of RVD (t = 40 min) compared to control cells (n = 6, P < 0.001). The percent volume recovery of cells with A23187 added also was severely decreased in comparison to the control cells (Figure 18B, n = 6, P < 0.001). The percent volume recovery of control cells was 5.9%, whereas cells treated with A23187 added at t = 5 min had a percent volume recovery of -42.0%.
Figure 13. RVD response of cells in hypotonic Ringer with quinine (5 mM) was inhibited compared to control cells. (A) Cells in hypotonic Ringer with quinine swelled more than control cells (n = 5, P < 0.05 at t = 1 min). Cells with quinine also recovered less than control cells (n = 5, P < 0.01, t = 40 min). (B) The percent volume recovery of cells in hypotonic Ringer with quinine (-22.0 ± 5.0%) was significantly less than that of control cells (11.0 ± 3.0%, n = 5, P < 0.01). Data shown as mean ± SE.
Figure 14. RVD response of cells in hypotonic high K+
Ringer was the same compared to control cells. (A) Cells in high K+
hypotonic Ringer swelled less than control cells (n = 6, P < 0.01 at t = 1 min). However, these cells were not significantly different from control cells at t = 40 min. (B) The percent volume recovery of cells in high K+
hypotonic Ringer (11.3 ± 3.4%) was the same as that of control cells (8.7 ± 2.1%). Data shown as mean ± SE.
Figure 15. RVD response of cells in hypotonic Ringer with gramicidin (5 µM) was greatly enhanced compared to control cells. (A) Cells in gramicidin showed a robust RVD response compared to control cells (n = 6, P < 0.001 at t = 40 min). (B) The percent volume recovery of cells in hypotonic Ringer with gramicidin (95.0 ± 1.7%) was significantly greater than that of control cells (23.8 ± 1.9%, n = 6, P < 0.001). Data shown as mean ± SE.
Figure 16. Gramicidin (5 µM) reversed the inhibitory effect of hexokinase (5 Units/mL) on alligator red blood cells. (A) Cells with hexokinase swelled more than control cells (n = 5, P < 0.01 at t = 1 min). Adding gramicidin at t =1 min reversed this initial inhibition (n = 5, P < 0.001 at t = 40 min). (B) The percent volume recovery of cells in hypotonic Ringer with gramicidin and hexokinase (96.9 ± 0.8%) was significantly greater than that of control cells (19.4 ± 1.3%, n = 6, P < 0.001). Data shown as mean ± SE.
Figure 17. RVD response of cells in hypotonic Ringer with A23187 (1 µM) was inhibited compared to control cells. (A) Cells with A23187 added at 1 min swelled more than control cells and stayed swollen throughout the experiment (n = 6, P < 0.001 at t = 40 min). (B) The percent volume recovery of cells in hypotonic Ringer with A23187 (-38.2 ± 7.7%) was significantly less than control cells (20.2 ± 4.7%, n = 6, P < 0.01). Data shown as mean ± SE.
Figure 18. RVD response of cells in hypotonic Ringer with A23187 (1 µM) added at t = 5 min was inhibited compared to control cells. (A) Cells with A23187 added at 5 min swelled more than control cells and stayed swollen throughout the experiment (n = 6, P < 0.001 at t = 40 min). (B) The percent volume recovery of cells in hypotonic Ringer with A23187 added (-42.0 ± 2.1%) was significantly less compared to control cells (5.9 ± 1.6%, n = 6, P < 0.001). Data shown as mean ± SE.
Figure 20. Gramicidin (5 µM) reversed the effect of A23187 (1 µM) in a time independent manner. (A) Cells treated only with A23187 added at t = 1 min (n = 6, open squares), cells with A23187 added at t = 1 min and gramicidin added at t = 5 min (n = 6, diamonds), cells with A23187 added at t = 1 min and gramicidin added at t = 30 min (n = 5, closed triangles), and control cells (n = 6, closed circles) had an RVD response (at t = 40 min) significantly different than each of the cells in the other three conditions (P < 0.001). The exceptions were cells with gramicidin added at t = 5 and 30 min respectively. These cells had a similar RVD response (P > 0.05). (B) The percent volume recovery was 23.7 ± 3.1% for control cells, -19.0 ± 6.8% for cells with only A23187 added, 79.2 ± 6.3% for cells with A23187 added at t = 1 min and gramicidin added at t = 5 min, and 77.9 ± 2.6% for cells with A23187 added at t = 1 min and gramicidin added at t = 30 min. The percent volume recoveries for the cells in each of the four conditions were significantly different than one another (P < 0.001), except cells with gramicidin added at t = 5 and 30 min, which had similar percent recoveries (P > 0.05). Data shown as mean ± SE.
Similarly, for cells where A23187 (1 µM) was
added at 30 min after hypotonic shock, there was a rapid increase in cell volume (Figure 19A). At t = 40 min, the cells with A23187 were swollen significantly more than control cells (n = 5, P < 0.001). The percent volume recovery of the cells in the presence of A23187 was considerably diminished (Figure 19B, n = 5, P < 0.001). Control cells had a percent volume recovery of 9.6%, whereas cells with A23187 added recovered -45.0%. Thus, these data were consistent with a time-independent action of A23187.
Finally, I wanted to investigate whether A23187-mediated inhibition of RVD could be reversed using gramicidin. This would indicate that a pharmacologically high concentration of Ca2+ inhibited K+ efflux. Furthermore, I wanted to know whether such a reversal, if possible, was time dependent. I reasoned that if the effect of A23187 was reversible, adding gramicidin to these cells would result in a rapid volume decrease. If this reversal was time-independent, then there would be no difference in the RVD of cells with gramicidin being added at t = 5 min or t = 30 min.
I found that the addition of A23187 (at t = 1 min) resulted in a rapid volume increase in alligator erythrocytes (Figure 20A). However, this inhibitory effect was reversed with gramicidin, and the effect of gramicidin did not appear to be influenced by the time after hypotonic shock at which it was administered (i.e.; gramicidin was added at 5 min and at 30 min after hypotonic shock). In addition, cells with only A23187 added (n = 5) had a considerably diminished RVD as compared to control cells (n = 6, P < 0.001). However, when gramicidin was added to the cells exposed to A23187, they underwent a rapid volume decrease, shrinking back to almost their basal volume (Figure 20A); cells treated with gramicidin were significantly different (potentiated RVD
response) compared to cells only exposed to A23187 (inhibition of RVD) or compared to control cells (t = 40 min, P < 0.001). Furthermore, cells treated with gramicidin at 5 min were not significantly different than the cells treated with gramicidin at 30 min (t = 40 min, P > 0.05).
The percent volume recovery (Figure 20B) for cells under each condition were significantly different from cells in every other condition (P < 0.001) except for cells treated with gramicidin at 5 and at 30 min (P>0.05). Cells in these two conditions had similar percent volume recoveries. In addition, the percent volume recovery was 23.7% for control cells, -19.0% for cells with only A23187 added, 79.2% for cells with A23187 added at t = 1 min and gramicidin added at t = 5 min, and 77.6% for cells with A23187 added at t = 1 min and gramicidin added at t = 30 min. These results suggest a reversible, time-independent pathway, mediated by gramicidin-induced K+ efflux.
Fluorescence microscopy and Ca2+i levels in alligator
erythrocytes during RVD
The above cell volume experiments with EGTA and A23187 had demonstrated the importance of calcium in RVD by alligator erythrocytes. With this in mind, I next conducted a series of complimentary experiments using fluorescence microscopy, a procedure that permits examination of qualitative changes in cytosolic calcium levels in response to hypotonic shock. To accomplish this, I first developed a protocol which would allow me to perform these experiments on alligator RBCs.
The initial results for this protocol indicated that cells in hypotonic solution fluoresced (Figure 21A) when incubated with the fluorescent probe fluo-4, AM (10 µM , Light et al., 2003) in the presence of the detergent Pluronic® F-127. In addition, the same fluorescence was seen for cells
in isotonic solution with A23187 (positive control, Figure 21B). However, some fluorescence, although dim, was also observed for cells in isotonic solution (negative control, Figure 21C). These observations were consistent for all trials (n = 3).
I speculated that the glowing observed in the negative control (isotonic Ringer) may have resulted from the detergent Pluronic® F-127, which may have made the
membrane too leaky, and therefore allowed a significant amount of calcium to enter even under isotonic conditions. Accordingly, I repeated the fluorescence studies in the absence of Pluronic® F-127 (Figure 22, n = 2). In this case, there was a noticeable lower incidence of glowing in the negative control when compared to cells in the positive control and hypotonic Ringer solutions. Nonetheless, there was still observable fluorescence in the negative control. Thus, the prospect of setting up a protocol that might enable the monitoring of intracellular calcium levels is promising, but still needs further refinement.
Discussion
The primary purpose of this study was to investigate the specific mechanisms of RVD in alligator erythrocytes. Direct measurement of cell volume was used to accomplish this. It was found that extracellular Ca2+plays an important role in RVD and that K+ efflux is a rate-limiting step in this process.
Furthermore, fluorescence microscopy was found to have potential as a technique for elucidating the role of calcium in RVD.
Role of extracellular calcium (Ca2+) in RVD
The results indicate a significant role for extracellular Ca2+in RVD by alligator erythrocytes (Figures 4 and 5). Evidence for this conclusion came from experiments where extracellular calcium was buffered with EGTA, which inhibited RVD. In fact, EGTA was used to reduce extracellular calcium availability (6 mM for control cells) to two distinct concentrations, one above and one below the normally occurring [Ca2+]i of approximately 100 nM (Berridge et al.,
2000). Interestingly, cells in the 10 nM free calcium EGTA Ringer had a better RVD response (6.0%) compared to cells in the 1000 nM free calcium (-24.4%).
The incongruity of these results with my initial prediction (that cells bathed in a lower extracellular calcium concentration would show a less robust percent volume decrease) is noteworthy. This indicates a dose-dependent mechanism of action for Ca2+ in RVD. Consistent with this conclusion, Spivak (2007) also found that alligator RBCs in 1000 nM free calcium EGTA Ringer display a more robust inhibition of RVD than cells exposed to 10 nM free calcium. This [Ca2+]e dependent effect may result from a stimulation of
calcium release from intracellular stores in response [Ca2+]e
levels lower than the normal [Ca2+]
i of ~100 nM (Berridge et
al., 2000). In fact, a similar response has been observed in glial cells, which release intracellular calcium in response to sub-threshold extracellular calcium levels, mediated via inositol 1,4,5-tris-phosphate (IP3) (Zanotti and Charles,
1997). Thus, the potential contribution of intracellular calcium release during RVD warrants further investigation.
Figure 21. Cells incubated in fluo-4, AM (10 µM) in the presence of Pluronic® F-127. Cells were incubated with fluo-4, AM and Pluronic® F-127 in isotonic Ringer with 5.5 mM glucose and 1 mM sodium bicarbonate for 1.5-2 hours at 4°C. Thereafter, they were spun at 2000 rpm and then incubated in fresh isotonic Ringer for 30-60 min at 4°C. After this, cells were again resuspended in fresh isotonic Ringer. At this time, A23187 was added or cells were given hypotonic shock by adding 0.25x hypotonic Ringer and then/or cells were examined directly (at 400x). (A) Cells in hypotonic Ringer (B) Cells in isotonic Ringer with A23187 added (positive control) (C) Cells in isotonic Ringer (negative control).