AUT J. Civil Eng., 3(2) (2019) 179-186 DOI: 10.22060/ajce.2018.14988.5512
Artificial Neural Network and Optimization Algorithm to Improve Soil
Resistance by
Means of Aggregation Size Variation
A. R. Mazaheri1, F. Jafarian2*1 Department of Civil Engineering, Engineering Faculty, Ayatollah Borujerdi University, Borujerd, Iran 2 Faculty of Engineering, Mahallat Institute of Higher Education, Mahallat, Iran
ABSTRACT: Nowadays, extensive researches are conducted on soil improvement and most of them are focused on the enhancement of soil strength properties. In this study, the aggregation of soil particles including Gravel, Sand, and Clay was investigated on soil resistance. To do this, the number of 25 different testing experiments were experimentally performed according to the Design of Experiment (DOE). The soil strength parameter was determined by means of direct shear tests on large samples. Based on the experimental results, the effect of aggregation size on shear strength was extensively investigated. To do this, Artificial Neural Network (ANN) was employed to evaluate the effect of different combinations of soil particles on bearing capacity. To provide more precise predictive model, the ANN was trained using the Genetic Algorithm (GA). After that, the optimal condition of mix design with optimal load-bearing capacity was found by a hybrid strategy of EOA-ANN. It was obtained 1091.94 (KPa) that had not been reported using the experiments. To evaluate the reliability of the proposed method, a new experimental test was conducted based on the optimal parameters found by hybrid strategy and it was verified with corresponding estimated ones. At the end, very good agreement was reported between the new experiment and the optimal results. It shows that the employed intelligent method in this paper can be successfully used for the enhancement of soil properties in other investigations.
Review History:
Received: 16 September 2018 Revised: 31 October 2018 Accepted: 12 December 2018 Available Online: 12 December 2018
Keywords: Soil Strength Neural Networks Direct Shear Tests
Aggregation Size
1- Introduction
When resistance of materials is not adequate, soil Improvement is one of the most important tasks in geotechnical engineering. There are several approaches for soil improvement such as: the deep soil mixing, replacement of material and use of additives for soil stabilization. The mentioned methods may cause chemical and physical changes in soil structure and as a result of these events, soil properties can be improved. Replacements of materials are usually used in two ways. In most cases, fine-grained materials are added to course-grained to improve soil liquefaction stability during an earthquake. It has been shown that increasing the percentage of fine materials using the cohesion property, increases the resistance of material in liquefaction [1, 2]. In some cases, the aggregate of sand is added to changes the material strength properties [3-5]. In Europe, the technology of combination of soil-cement and compacting was firstly introduced in France. During the significant progress of this technology, more and more dominant studies were carried out in this regard. Firatcabalar et.al [6] determined the resistance of the untrained clay with low liquid limit combined with a mixture of sand and gravel. That was conducted by a cone Penetration test. Undrained shear
strength, consolidation, and dynamic cyclic parameters of soil are investigated by researches [7].
Thai Pham et al. [8] investigated and compared the performance of four machine learning methods, Particle Swarm Optimization - Adaptive Network-based Fuzzy Inference System (PANFIS), Genetic Algorithm - Adaptive Network-based Fuzzy Inference System (GANFIS), Support Vector Regression (SVR), and Artificial Neural Networks (ANN), for predicting the strength of soft soils. Kanungo et al. [9] compared the ANN and CART techniques for predicting the shear strength parameters. Kiran et al. [10] applied Probabilistic Neural Network (PNN) to predict the shear strength parameters of soil. The Use of soil with a rubber composition was studied to improve seismic behavior [11-14]. It was found that the percentage of the rubber effects on the damping coefficient. Carasca [15] investigated the composition of the clay and sand stabilized with cement examined by unconfined compressive strength, flexural strength, porosity, density, and dynamic modulus. Kim et.al [16] examined the effect of grain size by using untrained cyclic triaxial tests on samples of sand-clay combination. Using the Genetic Algorithm (GA), the bearing capacity of shallow foundations was determined by Taghipoor et al. [17]. They used results of other studies to train and test their model finally the results were compared with proposed
equations such as Vesic and Meyerhof. Regarding the soil improvement by adding existing materials, the weak materials are often replaced. In these studies, fine-grained materials with cohesive properties were added to sandy materials with liquefaction tendency, while fine-grained materials with coarse aggregate replaced. The researchers conducted around soil improvement by replacement methods or use of additives, the percentage of additives has been mostly determined based on the empirical methods. But, it should be noted that, up to know, the optimal percentage of additive materials has been never determined by means of artificial intelligence including the combination of Artificial Neural Network (ANN) and Optimization Algorithm (OP).
In this study, the fine weak materials were replaced with different percentages of coarse aggregate to provide the best resistance and load capacity. For this purpose, the Taguchi method was firstly used to determine mixed materials at different levels. After that, the large scale samples (with dimensions 30×30 cm2 with the new
material compounds) were obtained and then they were experimentally tested. After the experimental procedure, the intelligent systems including Artificial Neural Network (ANN) and Optimization Algorithm (OA) was used to find the most suitable mixed designs and best resistance value.
2- Description of the problem
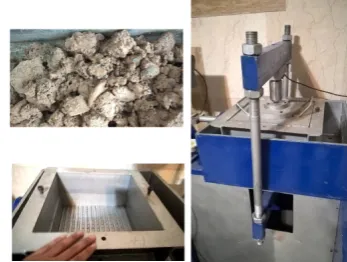
A factory in the industrial zones of Arak requires suitable materials that provide proper and acceptable resistance capacity to prepare the space for their devices and their deployment. The study area consists of the weak silty fine-grained soil that is not able to resist against the high loads. It should be noted that the process of soil replacement or excavation of the bedrock was not economic, due to the vast area of the project (about 100000 square meters). Therefore, it seems the best solution to solve the problem is adding coarse aggregate. The initial soil profile is shown in Table 1.
Table 1. Initial Soil Properties
φ (Degree) C (kN⁄m2) PI(%) LL(%) Soil Category
10.8 1.47 10 31 ML
Figure 1 shows primary particle size that is larger than 0.075 mm. As seen in the figure, more-or-less 90% of the material is smaller than 0.075 mm. According to the information presented in Table 1, the soil is classified as ML with poor resistance parameters and bearing capacity to build an Industrial Shed with a span of 35 meters. In order to provide the required resistance and to obtain the minimum soil subsidence, one of the best ways is that
Figure 1. Aggregation curve of soil in the study area
3- Experiments
In order to stabilization of the soli, different percentages of coarse aggregate are added into the soil and soil strength parameters are determined. To determine the optimum particle size of materials based on the material size classification in four categories which the changing of materials weight in each of these four levels is causing to have a new kind of materials. Since the GC can be beneficial to provide greater bearing capacity, it was mostly used more than 50% when the coarse particles is required.
The percentage of mixing materials was determined by using the Taguchi method and finally, 25 different mix designs were reported.
3- 1- Direct Shear Test
To determine the soil resistance property of samples the large direct shear tests were used. The device was shown in Figure 2. The overhead load was equal to 0.5, 1 and 1.5 kg/cm2 for all tests. All of them were constructed with the
same density.
Table 2. Classification of materials into four levels
Group A Group B Group C Group D
5 ≤ Soil ≤20 mm 1 ≤Soil ≤5 mm 0.075 ≤ Soil ≤1 mm Soil≤0.075 mm
34% to 75% 5% to 39% 3% to 8% 5% to 20%
According to the classic method, to calculate the bearing capacity of foundations, there are two effective parameters including cohesion and friction angle [18]. It can be seen at the bearing capacity relationship presented by Terzaghi (Equation 1) [19]. In this regard, the viscosity parameter directly and the friction angle parameter indirectly affects the adherence factors, density, and overhead load.
qu= cNc+ qNq+1/2γΒNγ (1)
Where: qu= ultimate bearing capacity, C= cohesion B= effective width of foundation, q= surcharge pressure at the foundation depth. Nc, Nq, N γ, dimensionless bearing capacity factors of cohesion “c”, soil weight in the failure wedge, and surcharge “q” terms.
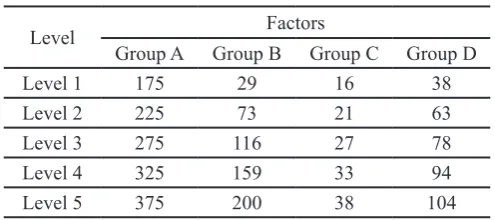
According to the above description, the mix design should be selected with the highest cohesion and friction angle to subsequently result in the maximum bearing capacity. To obtain acceptable results, the different mix designs were taken into account in 4 groups and any of them were selected at the 5 levels. These groups and levels (for 5000 grams) are listed in Table 3.
Table 3. Groups and levels of the materials
Level Factors
Group A Group B Group C Group D
Level 1 175 29 16 38
Level 2 225 73 21 63
Level 3 275 116 27 78
Level 4 325 159 33 94
Level 5 375 200 38 104
Taguchi design of experiment was used for determination of testing conditions. This method chooses a suitable subset from all possible testing conditions to fairly take into account the effect of the groups and their levels on the process outputs and to avoid unnecessary experiments. It should be underlined that, to determine the friction angle and cohesion at the different composition of materials, each experiment should be repeated three times. Therefore, in this study, a total of 75 direct shear tests were conducted. The results of the testing experiments are shown in Table 4.
As shown in Table 4, cohesion and friction angle parameters are the experimental outputs and when they increase, the bearing capacity also increases. Therefore, it is really important to find a suitable mix design that leads to the maximum capacity. This optimal condition should be determined using Equation 1, where these parameters are related to the bearing capacity. In the rest of the paper, the intelligent systems including Artificial Neural Network (ANN) and Genetic Algorithm (GA) was used to evaluate the effect of input parameters on bearing capacity and to find the optimal conditions.
Table 4. The experimental results of the friction angle and cohesion at the different mix design
Experiment
number Group
A
Group B Group C Group D (kN/m Cohesion
2
)
Friction
Angle (Degree)
1 1 1 1 1 8 31.8
2 1 2 2 2 9 31.4
3 1 3 3 3 7 29.7
4 1 4 4 4 7 29.3
5 1 5 5 5 9 29.3
6 2 1 2 3 5 29.7
7 2 2 3 4 5 29.3
8 2 3 4 5 9 30.6
9 2 4 5 1 9 30.1
10 2 5 1 2 10 30.1
11 3 1 3 5 4 32.6
12 3 2 4 1 4 30.1
13 3 3 5 2 6 29.3
14 3 4 1 3 8 31
15 3 5 2 4 5 29.7
16 4 1 4 2 6 29.3
17 4 2 5 3 4 28.4
18 4 3 1 4 3 28.8
19 4 4 2 5 9 30.6
20 4 5 3 1 9 28.4
21 5 1 5 4 5 27.5
22 5 2 1 5 8 27.5
23 5 3 2 1 6 26.6
24 5 4 3 2 8 26.6
25 5 5 4 3 14 24.4
4- The application of intelligent methods
4- 1- Artificial Neural Networks (ANN)
Basically, the neural networks are made by three layers including; input layer, hidden layers and output layers that each layer consist a number of neuron. All neurons of the neural network are related together with special links known as a weight. Each neuron is also influenced by another factor known as a bias. It should be noted that how the amount of weight and bias of each neuron affect the next layer is a linear or non-linear function of transfer function.
Thus, ANNs are able to receive a series of information in the input layer and estimate process parameters at the output layer. Accuracy of the estimation is dependent on many factors such as network structure, type of the transfer function, hidden layers and the neurons located at each layer. Figure 3 shows a general view of a neural network with five inputs and two hidden layers and also shows a neuron structure.
The set values of weights and biases, which commonly called network training, play a crucial role in the performance and efficiency of neural network. Use of appropriate method for training the neural network especially in cases where the number of data is low is more essential. Neural network training plays a main role in performance and precision of the model. Hence, we introduce a new and efficient training method of the neural network in the next section.
Figure 3. Displays the structure of a neural network with neurons structure
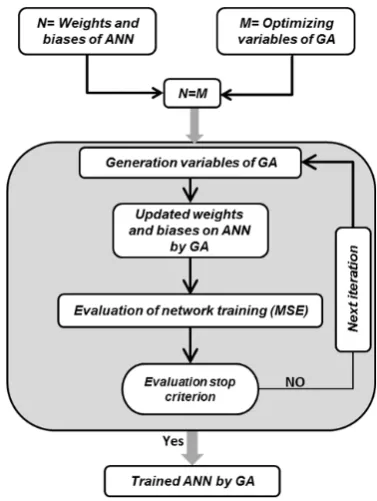
4- 2- Training ANN by GA
In recent years, researchers have used evolutionary optimization algorithms to train the neural networks that are more efficient than previous methods. It has been shown that the importance of this method becomes more highlighted when the number of training data is low [26-28].
To train a neural network with a genetic algorithm, after preparing the neural network structure, the weights and biases of the network are defined as optimization factors of the algorithm. GA updates the weights and biases of the network to reduce the sum of the neural network training error in each stage. This trend will continue to reach the
stopping criteria, which eventually will find the optimal weights and biases to train the neural network. More information in this regard can be found in the literature [29, 30]. Figure 4 illustrates the flowchart of training artificial neural network by optimization algorithm.
Figure 4. The flowchart of neural network training by optimization algorithm
5- Results and Discussion
In this section, the experimental results and intelligent systems are used to model and optimize the process. In this respect, the artificial neural network was employed to extensively evaluate the effects of aggregate and mix design materials on the bearing capacity. In addition, with a combination of neural network and genetic algorithm, the optimal input conditions were found to maximize the loading capacity of the soil.
5- 1- Network Training Results
The neural network was used to estimate the model. The number of 20 out of 25 tests was used to train the neural network and the rest of the data was used to test the network. The comparison between experimental and estimated results for both testing and training data is shown in Figure 5 and the average of testing and training error, network topology and transfer function are shown in Table 5.
Figure 5. Neural network training and testing performance
Table 5. The average testing and training error, network topology and transfer function
ANN Testing Error (%) Average Error (%)Testing Average Training Error (%) TopologyNetwork Transfer Function
Cohesion 3.2, 4, 1.1, 3.2, 1.1 1.9 1.81 4-6-3-1 Logsig - Logsig - Logsig
Friction Angle 1.1, 1.6, 1.2, 1.3, 3.7 1.85 1.32 4-6-3-1 Logsig - Logsig - Logsig
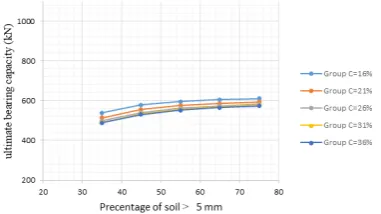
Figure 6. Effect of particle larger than 5 mm and particle between 1 to 5 mm (Group B)
In Figure 6, the soil in two groups C and D are kept constant at the lowest level and soil in groups A and B are changed. As shown in Figure 6 increasing the percentage of soil in groups A and B the growth the bearing capacity but increasing the particles larger than 5 mm (Gravel) in more effective than particles between 1 mm up to 5 mm.
Figure 7. Effect of particle larger than 5 mm and particle between 1 to 0.75 mm (Group C)
Soil percentage in groups A and C are changed in Figure 7 and percentage groups B and D are kept constant at the lowest level. As shown in this figure increasing the percentage of particles larger than 5 mm increases the load capacity but increasing the percentage of materials between 1 mm to 0.075 mm does not noticeably increase the load capacity.
Figure 8. Effect of particle larger than 5 mm and particle smaller than 0.75 mm (Group C)
In Figure 8, soil particles in groups B and C are kept constant at the lowest level and large particles (group A) and clay particles (group D) are changed. As seen from this figure changing the gravel and clay particles are very effective in bearing capacity. Increasing the percentage of clay particles between 8 to 21% increases the load capacity up to 80 percent.
5- 2- Determination of the optimal bearing capacity In the previous section, using the ANN model, the effect of input parameters (including groups A-D) were extensively evaluated on the bearing capacity. It is important to note, application of ANN cannot be enough to find optimal conditions. In this section of the paper, the hybrid strategy of GA-ANN was employed to find the optimal input parameters to maximize bearing capacity. Figure 9 shows the implemented strategy for optimization of the process.
Figure 9. Flowchart for optimization of the Bearing capacity
As can be seen, at the first step, input parameters of mix design were introduced to the neural networks and cohesion and friction angle values were firstly estimated. Using the values estimated by the neural networks, the output bearing capacity was calculated based on the Equation 1. Then, the relationship of Terzaghi (Equation 1) used as the objective function of GA. In each step of the optimization, the input parameters (groups A to D) were updated by GA operation so that the objective function of optimization (bearing capacity) was maximized. In fact, the best results of the previous step are transferred to the next generation to participate in optimization operation. This procedure was repeated to reach the GA stop criterion that provides the optimal solution (maximize bearing capacity).
After the implementation of the above strategy, the optimal output and corresponding input parameters were reported in Table 6. Figure 10 also indicates the convergence curve of GA that led to the optimal output. It should be noted that, since the GA minimize the problem, to obtain the maximum bearing capacity, the objective function was multiplied in the negative sign. As shown, the optimal output obtained using this model is different from both experimental and estimated results.
Figure 10. The convergence curve of results
Table 6. The optimal bearing Capacity determined by GA-ANN method
Optimal input parameters
Optimized Bearing Capacity (kPa)
Group
A
Group B Group C Group D
62 17 3 18 1091.94
In order to ensure optimum results, a new experimental test was carried out in accordance with the optimal conditions found by ANN-GA model and then, the new values of friction angle and cohesion were measured. Finally, the new bearing capacity was calculated based on the new experiment. The comparison between the new experiment and optimal results is reported in Figure 11.
Figure 11. Comparison between experimental and optimization
results
6- Conclusion
One of the efficient and low-cost strategies to improve the soil bearing properties is replacements and changing aggregate mix which results in the improvement of soil strength parameters. In this paper, based on the aggregation size, soil materials were divided into four groups and their effect was investigated on bearing capacity. To do this, the number of 25 experimental tests was firstly carried out based on the Taguchi method to measure cohesion and friction angle by direct shear tests method. ANN was utilized to determine the suitable rang of Cohesion and friction angle and the initial bearing capacity was calculated in these ranges. These ranges are shown in Figures 7-9. After that, the results were introduced to GA to find the optimal bearing capacity. Some of the results can be summarized as follows:
• The results showed that increasing of coarse aggregate more than 5 mm has a significant influence on bearing load capacity while this variation is not visible when the coarse aggregate between 1 to 5 mm is used. It was also found that change in the percentage of particle smaller than 0.075 mm also have an important influence on load capacity. Increasing the percentage of clay particles (group D) to 21% with 65% particle larger than 5 mm (group A) gave bearing capacity equal to 1024 kNs.
• The initial soil bearing capacity was near 360 kN, while it was possible to significantly improve it by implemented strategy in this paper. Changing the aggregate and increasing the size of the soil particle was the cause of the increasing friction angle and the optimal bearing capacity was found to be 1091 kN and it was experimentally verified by conducting a new experiment according to the optimal conditions.
7- Nomenclature
B Effective width of foundation C Cohesion, kN/m2
q Surcharge pressure at the foundation depth, kN/ m2
qu ultimate bearing capacity, kN/m2
Greek symbols
φ Degree, °
Subscript
u Ultimate
Reference
[1] K. Ishihara, J. Koseki, Discussion on the cyclic shear strength of fines-containing sands, Earthquake geotechnical engineering, Proceedings of the 11th international conference on soil mechanics and foundation engineering, Rio De Janiero, Brazil, (1989) 101-106.
[2] S. S. Park, Y. S. Kim, Liquefaction Resistance of Sands Containing Plastic Fines with Different Plasticity, Journal of Geotechnical and Geoenvironmental Engineering, 139(5) (2013) 825-830.
[3] F. B. Martins, L. Bressani, M. R. Coop, A.V.D. Bica, Some aspects of the compressibility behavior of a clayey sand, Canadian Geotechnical Journal, 38(6) (2011) 1177-1186.
[4] F. B. Martins, L. Bressani, M. R. Coop, A.V.D. Bica, Some aspects of the compressibility behavior of a clayey sand, Canadian Geotechnical Journal, 38(6) (2011) 1177-1186.
[5] A. Nocilla, M. Coop, F. Colleselli, The mechanics of an Italian silt: An example of ‘transitional’ behaviour, Géotechnique, 56(4) (2006) 261-271.
[6] A. Firat Cabalar, W. Mustafa, Fall Cone Tests On Clay- Sand Mixtures, Engineering Geology, 192 (2015) 154-165.
[7] D. H. Hsiao, V. Phan, Y. T. Hsieh, H. Y. Kuo, Engineering behavior and correlated parameters from obtained results of sand–silt mixtures, Soil Dynamics and Earthquake Engineering, 77 (2015) 137-151 [8] B. Thai Pham, L. H. Son, T. A. Hoang, D. M. Nguyen,
D. T. Bui, Prediction of shear strength of soft soil using machine learning methods, Prediction of shear strength of soft soil using machine learning methods, 166(3) (2019) 181-191.
[9] D. Kanungo, S. Sharma, A. Pain, Artificial Neural Network (ANN) and Regression Tree (CART) applications for the indirect estimation of unsaturated soil shear strength parameters, Frontiers of Earth Science, 8(3) (2014) 439-456.
[10] S. Kiran, B. Lal, S. Tripathy, Shear strength prediction of soil based on probabilistic neural network, Indian Journal of Science and Technology, 9(41) 2016. [11] H. K. Kim, J.C. Santamarina, Sand–rubber mixtures
(large rubber chips), Canadian Geotechnical Journal, 45(10) (2008) 1457-1466.
[12] Z. Feng, K. Sutter, Dynamic Properties of Granulated Rubber/Sand Mixtures, Geotechnical Testing Journal, 23(3) (2000) 338-344.
[13] K. Hyunki, Spatial variability in soils: stiffness and strengh, A Thesis Presented to The Academic Faculty, (2005).
[14] S. Pamukcu, S. Akbulut, Thermoelastic Enhancement of Damping of Sand Using Synthetic Ground Rubber, 132(4) (2006) 501-510.
[15] O. Caraşca, Soil Improvement by Mixing: Techniques and Performances, Energy Procedia, 85 (2016) 85-92. [16] U. Kim, D. Kim, L. Zhuang, Influence of fines
content on the undrained cyclic shear strength of sand–clay mixtures, Soil Dynamics and Earthquake Engineering, 83 (2016) 124-134.
[17] A. Tahmasebi poor, A. Barari, M. Behnia, T. Najafi, Determination of the ultimate limit states of shallow foundations using gene expression programming (GEP) approach, Soils and Foundations, Soils and Foundations, 55(3) (2015) 650-659.
[19] K. Terzaghi, Theoretical Soil Mechanics, (2007). [20] H. Güllü, Prediction of peak ground acceleration
by genetic expression programming and regression: A comparison using likelihood-based measure, Engineering Geology, 141-142 (2012) 92-113.
[21] S. K. Das, P. K. Basudhar, Undrained lateral load capacity of piles in clay using artificial neural network, Computers and Geotechnics, 33(8) (2006) 454-459. [22] [12] Y. M. Najjar, C. Huang, Simulating the stress–
strain behavior of Georgia kaolin via recurrent neuronet approach, Computers and Geotechnics, 34(5) (2007) 346-361.
[23] S. K. Das, P. Samui, A. K. J. G. G. Sabat, Application of Artificial Intelligence to Maximum Dry Density and Unconfined Compressive Strength of Cement Stabilized Soil, Geotechnical and Geological Engineering,29(3) (2011) 329-342.
[24] H. Ardalan, A. Eslami, N. Nariman-Zadeh, Piles shaft capacity from CPT and CPTu data by polynomial neural networks and genetic algorithms, Computers and Geotechnics, 36(4) (2009) 616-625. [25] S. K. Das, P. K. Basudhar, Prediction of residual
friction angle of clays using artificial neural network, Engineering Geology, 100(3) (2008) 142-145.
[26] R. A. Mozumder, A. I. Laskar, Prediction of unconfined compressive strength of geopolymer stabilized clayey soil using Artificial Neural Network, Computers and Geotechnics, 69 (2015) 291-300. [27] F. Jafarian, D. Umbrello, S. Golpayegani, Z. Darake,
Experimental Investigation to Optimize Tool Life and Surface Roughness in Inconel 718 Machining, Materials and Manufacturing Processes, 31(13) (2016) 1683-1691.
[28] F. Jafarian, H. Amirabadi, J. Sadri, H.R. Banooie, Simultaneous Optimizing Residual Stress and Surface Roughness in Turning of Inconel718 Superalloy, Materials and Manufacturing Processes, 29(3) (2014) 337-343.
[29] F. Jafarian, H. Amirabadi, J. Sadri, Experimental measurement and optimization of tensile residual stress in turning process of Inconel718 superalloy, Measurement, 63 (2015) 1-10.
[30] F. Jafarian, M. Taghipour, H.J.J.o.M.S. Amirabadi, Technology, Application of artificial neural network and optimization algorithms for optimizing surface roughness, tool life and cutting forces in turning operation, 27(5) (2013) 1469-1477
Please cite this article using:
A. R. Mazaheri, F. Jafarian, Artificial neural network and optimization algorithm to improve soil resistance by means of aggregation size variation, AUT J. Civil Eng., 3(2) (2019) 179-186.