International Journal of Finance and Managerial Accounting, Vol.3, No.9, Spring 2018
79
With Cooperation of Islamic Azad University – UAE BranchCombination of DEA and ANP-QUALIFLEX
Methods to determine the most Efficient Portfolio
(Case study: Tehran Stock Exchange)
Alireza Alinezhad
Associate Professor, Department of Industrial Engineering, Faculty of Industrial and Mechanical Engineering, Qazvin Branch, Islamic Azad University, Qazvin, Iran
(Corresponding author) alalinezhad @gmail.com
ABSTRACT
The existence of an active and prosperous capital market is always recognized as one of the signs of international development in the countries. The most important issue faced by investors in these markets is the decision to choose the appropriate securities for investment and formation of optimal portfolio. The rating of companies accepted in stock exchange is a complete mirror of their status and is a measure of investment. This will increase the competitiveness, development and market efficiency.
In this research, the top 20 companies listed in Tehran Stock Exchange during the third quarter of 2015 are ranked according to financial ratios. In previous studies, optimal portfolio has been determined using data envelopment analysis models and multi-criteria decision making techniques, but the present study combines these two techniques to evaluate and determine the most efficient portfolio. Accordingly, the performance scores of each model are obtained using one of the data envelopment analysis model and then, the weight of each index is obtained using the network analysis process through multi-criteria decision-making techniques.
Keywords:
1. Introduction
The existence of an active and prosperous capital market is always recognized as one of the signs of international development in the countries. In developed countries, most investments are made through financial markets. The active participation of people in the stock market ensures the life of the capital market and sustainable development of the country. The most important issue faced by investors in these markets is the decision to choose the appropriate securities for investment and formation of optimal portfolio. Therefore optimal portfolio selection is one of the most significant issues in finance. The investment process in a coherent state,
It involves an analysis of the main nature of investment decisions.In this case, activities related to the decision-making process are decomposed and important factors in the field of activity of investors that affect their decisions are examined. The rating of companies accepted in stock exchange is a complete mirror of their status and is a measure of investment. This will increase the competitiveness, development and market efficiency.
Given the developments that have taken place in the world today, Countries, especially developing countries facing numerous threats, need to find suitable solutions for solving their economic problems in order to better utilize their Goddess facilities and wealth. In this regard, one of the important ways to expand investment. It should be said, Deciding on buying a share is complicated because several variables such as rate of return on capital, earnings per share, the ratio of the price to profit of each share and other factors should be taken into account. Since a set of variables is considered for decision making, a multi-criteria decision making method should be used. The data envelopment analysis method, which is one of the multi-criteria decision-making methods, makes this possible. Based on this method, the best options can be specified. The main purpose of portfolio management is to help investors in selecting the optimal portfolio. In this regard, analyzing the current and past affairs of companies and identifying the most efficient companies, according to some criteria, will be of great help to investors.
The selection of optimal portfolios is one of the most important issues discussed in the past and present, and with the research done in this field, there are some models for determining portfolios that their
deficiencies have been detected over time and have been replaced by other models. One of the main problems of the presented models is the ignorance of multiple indicators and dimensions for the final evaluation of stock portfolios, which in turn undermines the validity of the results of the evaluation. In this research, it is tried to identify financial factors affecting decision making on optimal portfolio selection and combine data envelopment analysis (DEA) and multi-criteria decision making (MCDM) for evaluating and selecting the optimal portfolios of shares of companies accepted in Tehran Stock Exchange in order to eliminate the deficiencies mentioned above (Khajavi et al., 2005).
2. Literature Review
The theory of portfolio selection was created by Markowitz in 1952. Markowitz established the basis of the aforementioned theory on the basis of optimizing the risk and return of a portfolio of several financial assets. The main task of the portfolio selection model was to allocate cash between different portfolios in such a way that risk and return on the portfolio would be optimized (Aoni, 2009).
Markovitz assumes in his choice of portfolios that all investors make their choices based on two criteria of risk and return. However, many studies have criticized all of the other investors' preferences in the Markowitz model. Considering the above mentioned issues about the problems in choosing the optimal portfolio, the present study attempts to take into account stock returns, earnings per share, price / profit ratio and return on assets in the optimal portfolio selection process will be examined.
In the research, Lee and Zhou first measured the technical efficiency of Chinese coal companies using the data envelopment analysis technique, and then examined the relationship between the efficiency and capital structure of the companies. The researchers showed that there is a relationship between the capital structure and the technical efficiency. They also showed that the investigated companies should create a certain debt ratio, so that if the debt ratio is higher than that, the technical efficiency will be reduced. (Li and Zhou, 2011)
Lee et al, studied the performance evaluation of airports using the DEA-AR-AHP combination technique, and by providing a questionnaire and expert opinions, identified factors affecting the efficiency of airports, and attributed weights to each of the factors using the AHP technique. Then, using weights, the upper and lower limits were considered for each DMU and they ranked airports as a constraint using the BCC model (Lee et al., 2015).
3. Methodology
3.1. Data Envelopment Analysis
Data Envelopment Analysis is a technique used to assess the efficiency of homogeneous organizational units with multiple inputs and multiple outputs referred to as decision-making units (Cooper et al., 2000). However this technique is a powerful managerial technique that provides managers with a device so that they could test the function of their companies against their competitors, and make decision for the better future based on the results (Jafarian-Moghaddam et al., 2011).
3.1.1. Free Disposal Hull (FDH) Model
The FDH model is another form of data envelopment analysis model. Its main characteristic is the non-existence of the principle of convexity in the set of production possibilities. This model is also known as the VRS variable model among DEA models and is represented by a integer planning problem . The FDH model will be as follows
(1)
∑
∑
∑
r=1,...,S j=1,...,n i=1,...,m λj { }
3.2. Multi-Criteria Decision Making
Decision process can be defined as a set of actions and methods dynamically organized. Although the decision-making problem could be constructed as more than one hierarchy with different criteria. The minds of researchers from recent decades (1970) have focused on multi-criteria decision models (MCDMs) for complex decisions. In these decisions, instead of using an optimality measure, several criteria are used. In fact in multi-criteria decision problems our interest is in selecting from some set of alternatives the one that best satisfies the criteria.
3.2.1.
Analytical
Network
Process
Analysis (ANP)
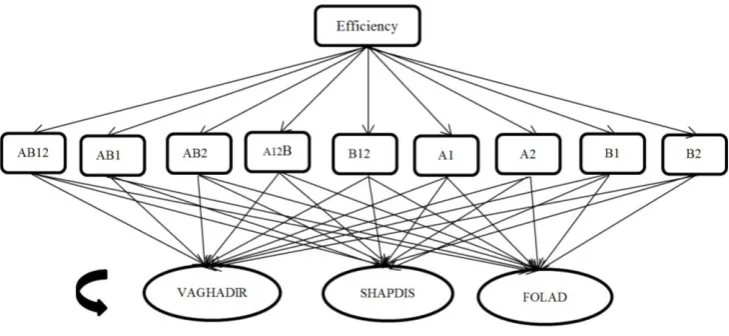
Fig 1. Network Process analysis
3.2.2. QUALIFLEX Method
In this method, first, different permutations of options are formed. In the next step, the options are ranked according to the indexes so that if the option is better than the rest in terms of one of the indices is ranked first and so are the other options. The dominant and non-dominant values are obtained by comparing permutations and rankings.
The obtained results are placed in a matrix having the information of indices and permutations, and the sum of the values for each permutation is calculated, which represents the priority of the permutations.
Model Features: This method is similar to the permutation method on the boundary between compensatory and non-reciprocal methods. In this way, the indicators should be independent and there is no need to convert the quality indices into quantitative ones.
Description of the model: Possible permutations are made up of the existing m option, for example,
if m = 3, then
(2)
Therefore, with the assumption of 3 options, the permutation options are as follows:
per1 = {A1, A2, A3} (3)
per2 = {A1, A3, A2}
per3 = {A2, A1, A3}
per4 = {A2, A3, A1}
per5 = {A3, A2, A1}
per6 = {A3, A1, A2}
Ranking of options based on indicators: At this stage, the decision matrix given by the decision maker. Based on the strengths, the ranking is better than the other one, and the other options are ranked. Calculation of dominant and recessive values: If the permutation matches the values of the value, then the value of 1 and if it does not match, the value of -1 and the time when the two options are equal in one index is assigned zero. for example, Suppose, in the first index and the hypothetical permutation we have the following values:
g1 = {A1, A2 = A3}, per = {A1>A2>A3} (4)
In permutation, A2> A1, in the ranking of the first index A2 <A1, and since this value does not match the ranking of the indices, it takes -1. Also, A2 = A3, and therefore takes the value of zero, and finally, in the prompt A3 <A1, and in the index of the first index, A3 <A1, which is also consistent and therefore takes +1.
up and broken down into all the permutation and indicators and entered into the table.
Calculate the amount of permutation options and select a superior option: then the amount of
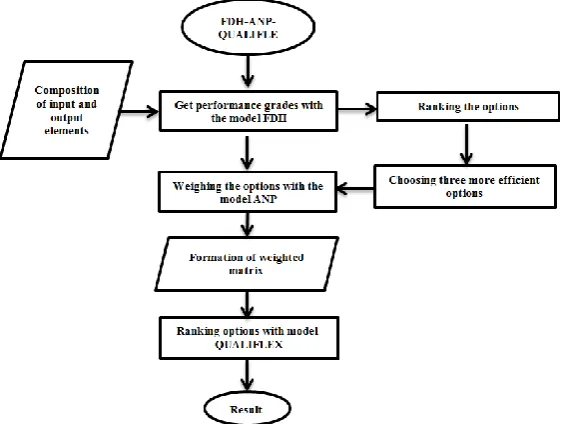
permutation of each indicator is multiplied by weight and combined, and is introduced as a permutation, the highest of which will represent the superior option. Chart of the proposed method
Fig 2. Chart of the proposed method
3.3.
Introduction
of
Performance
Measurement Criteria
In the efficient market, stock prices are determined in the stock market. In other words, when the seller's supply crosses the buyer's request, there are no definite rules that characterize the behavior of stock prices, but there are several factors that influence the stock prices’ upward or downward movement. These factors fall into three general categories of fundamental variables, technical variables, and emotional variables.
3.3.1. Fundamental Variables
EPS and P / E: In an efficient market, stock prices are primarily determined by the fundamental factors that are derived from the combination of the two basic variables of earning per share (EPS) and price to earnings ratio (P / E) per share.
ROE: Among the fundamental parameters, one of the most important ratios is the return on equity (ROE), which indicates the management of the company in the efficient use of investors' money. ROE
indicates that the management of the company was able to increase the company's value as acceptable or not, which is calculated as follows:
(5)
ROA: Return on assets is an indicator of how profitability of the company relies on its total assets. One of the ratios that shows management efficiency is the return on assets, which reflects the profit earned per unit of the company's assets. Assets include cash, accounts receivable, property, machinery and inventory. ROA is calculated as follows:
Return on Asset = (6)
3.3.2. Technical Variables
fundamental factors (for example, the growth of the economy is effective in corporate income growth). Technical variables are as follows: inflation, situation of the industry, alternative markets, age, and liquidity.
3.3.3. Emotional Variables
Emotional variables examine the psychological conditions of stock market activists (individual and collective). In sum, short-term investors usually use the technical variables to select the stock, while long-term investors benefit from fundamental variables for decision making. Of course, these investors may use technical variables along with a fundamental variable (Stock Exchange organization, 2015).
4. Results
In this section, the information gathered from the statistical population is analyzed using the FDH-QUALIFLEX combined technique. The time domain of the study is a three-month period, which begins in September 2015 and ends on December 2015 (the third quarter of 2015).
4.1. Introducing the List of 20 More
Active Companies in Tehran Stock
Exchange
First, data envelopment analysis is used to rank the options. The following table is the top 20 companies in Tehran Stock Exchange, extracted from the Tehran Stock Exchange organization.
4.2. Calculating Input
and Output
Elements of the FDH Model
After introducing the top twenty companies by the stock exchange organization, these companies are re-ranked using the FDH model. First, the input elements and output elements are determined.
The first two components (P, P / E) are considered as inputs and the next two components (ROE, ROA) as output. Inputs are named A and B, and outputs are named 1 and 2, respectively. The inputs are extracted from the Tehran Stock Exchange website and outputs are obtained according to the financial statements presented on the Tehran Stock Exchange website using the presented formulas. For example, the Fars symbol that is related to Persian Gulf Petrochemical Company is examined.
table1. top 20 companies in Tehran Stock Exchange in 2015
Activity indicator Symbol Company Name Row 14.710 FARS
Persian Gulf Petrochemical Industries 1
9.191 VAGHADIR
Investment in GHADIR (holding) 2 7.388 VABEMELT Mellat Bank 3 6.976 HAMRAH
Mobile communication company 4
6.796 VABSADER
SADERAT BANK OF IRAN 5
6.220 FOLD
Steel Mobarakeh Isfahan 6 5.914 AKHABER Iran Telecommunication 7 5.876 TAPICO
Oil and gas and petrochemical supplies 8
5.552 PARSAN
Expansion of oil and gas 9
5.402 RAMPNA
Mapna Group (Public Joint Stock Company) 10
5.329 MOBEN
Mobin Petrochemical Co. 11
5.221 SHABANDAR
Purification of Bandar Abbas Oil 12
4.767 HKESHTI
Shipping of the Republic of Iran 13
4.661 FAMLI
National Copper Industry of Iran 14
4.228 SHAPNA
Isfahan oil refining 15 4.162 VAPASAR Pasargad bank 16 4.009 KHODRO Iran Khodro 17 3.985 SHAPDIS
2.1. Calculating Input Values
Calculating P & P / E: Input values are available on the Tehran Stock Exchange. For Fars, these values are P = 929 and P / E = 6.36
Calculating ROE: Return on equity assesses the performance of a company in creating net profits for shareholders
Table 2. Calculating ROE FOR “FARS
P P/E DPS Net Income Sharehoder
Equity ROE
Symbol
929 6.360 500 50,737,761 105,118,822
0.4826706 FARS
ROE = 0.4826706 (8)
Calculating ROA: The return on assets is an indicator of how profitability of a company depends on the total assets of that company
(9
Table 3. Calculating ROA FOR “FARS”
P P/E DPS Net Income Average
Total Assets ROA
Symbol
929 6.360 500 50,737,761 189,925,512
0.2671456 FARS
ROA=02671456 (10)
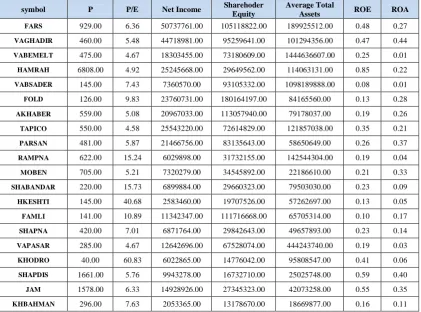
The results of input and output calculations for other companies are as Table 4.
Table 4. The results of input and output calculations for 20 companies
symbol P P/E Net Income Sharehoder
Equity
Average Total
Assets ROE ROA
FARS 929.00 6.36 50737761.00 105118822.00 189925512.00 0.48 0.27
VAGHADIR 460.00 5.48 44718981.00 95259641.00 101294356.00 0.47 0.44
VABEMELT 475.00 4.67 18303455.00 73180609.00 1444636607.00 0.25 0.01
HAMRAH 6808.00 4.92 25245668.00 29649562.00 114063131.00 0.85 0.22
VABSADER 145.00 7.43 7360570.00 93105332.00 1098189888.00 0.08 0.01
FOLD 126.00 9.83 23760731.00 180164197.00 84165560.00 0.13 0.28
AKHABER 559.00 5.08 20967033.00 113057940.00 79178037.00 0.19 0.26
TAPICO 550.00 4.58 25543220.00 72614829.00 121857038.00 0.35 0.21
PARSAN 481.00 5.87 21466756.00 83135643.00 58650649.00 0.26 0.37
RAMPNA 622.00 15.24 6029898.00 31732155.00 142544304.00 0.19 0.04
MOBEN 705.00 5.21 7320279.00 34545892.00 22186610.00 0.21 0.33
SHABANDAR 220.00 15.73 6899884.00 29660323.00 79503030.00 0.23 0.09
HKESHTI 145.00 40.68 2583460.00 19707526.00 57262697.00 0.13 0.05
FAMLI 141.00 10.89 11342347.00 111716668.00 65705314.00 0.10 0.17
SHAPNA 420.00 7.01 6871764.00 29842643.00 49657893.00 0.23 0.14
VAPASAR 285.00 4.67 12642696.00 67528074.00 444243740.00 0.19 0.03
KHODRO 40.00 60.83 6022865.00 14776042.00 95808547.00 0.41 0.06
SHAPDIS 1661.00 5.76 9943278.00 16732710.00 25025748.00 0.59 0.40
JAM 1578.00 6.33 14928926.00 27345323.00 42073258.00 0.55 0.35
4.3. Solving the Models Using the FDH
Method
Then, by combining inputs and outputs, the following nine models are solved with the FDH model. Models include:
AB12-AB1-AB2-A12-B12-A1-A2-B1-B2
To calculate the number of models, the following equation is used
∑ ∑ ( ) ( )
∑ ∑ ( ) ( ) ( ) ( ) ( ) ( ) ( ) ( )
( ) ( )
For example, if there are three inputs and two outputs, the number of models is 21
∑ ∑ ( ) ( ) ( ) ( ) ( ) ( ) ( ) ( )
( ) ( ) ( ) ( ) ( ) ( )
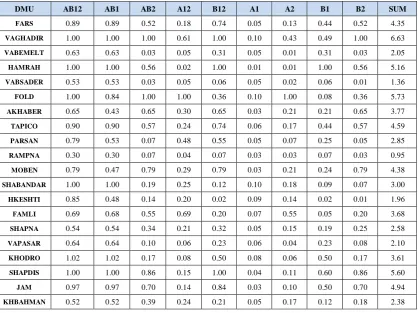
The results of solving all models to obtain the performance scores of twelve DMUs are as follows. In the next step, all the performance scores of each row are summed up and finally, the three highest summed sores are obtained.
Table 5. The results of solving all 20 models
DMU AB12 AB1 AB2 A12 B12 A1 A2 B1 B2 SUM
FARS 0.89 0.89 0.52 0.18 0.74 0.05 0.13 0.44 0.52 4.35
VAGHADIR 1.00 1.00 1.00 0.61 1.00 0.10 0.43 0.49 1.00 6.63
VABEMELT 0.63 0.63 0.03 0.05 0.31 0.05 0.01 0.31 0.03 2.05
HAMRAH 1.00 1.00 0.56 0.02 1.00 0.01 0.01 1.00 0.56 5.16
VABSADER 0.53 0.53 0.03 0.05 0.06 0.05 0.02 0.06 0.01 1.36
FOLD 1.00 0.84 1.00 1.00 0.36 0.10 1.00 0.08 0.36 5.73
AKHABER 0.65 0.43 0.65 0.30 0.65 0.03 0.21 0.21 0.65 3.77
TAPICO 0.90 0.90 0.57 0.24 0.74 0.06 0.17 0.44 0.57 4.59
PARSAN 0.79 0.53 0.07 0.48 0.55 0.05 0.07 0.25 0.05 2.85
RAMPNA 0.30 0.30 0.07 0.04 0.07 0.03 0.03 0.07 0.03 0.95
MOBEN 0.79 0.47 0.79 0.29 0.79 0.03 0.21 0.24 0.79 4.38
SHABANDAR 1.00 1.00 0.19 0.25 0.12 0.10 0.18 0.09 0.07 3.00
HKESHTI 0.85 0.48 0.14 0.20 0.02 0.09 0.14 0.02 0.01 1.96
FAMLI 0.69 0.68 0.55 0.69 0.20 0.07 0.55 0.05 0.20 3.68
SHAPNA 0.54 0.54 0.34 0.21 0.32 0.05 0.15 0.19 0.25 2.58
VAPASAR 0.64 0.64 0.10 0.06 0.23 0.06 0.04 0.23 0.08 2.10
KHODRO 1.02 1.02 0.17 0.08 0.50 0.08 0.06 0.50 0.17 3.61
SHAPDIS 1.00 1.00 0.86 0.15 1.00 0.04 0.11 0.60 0.86 5.60
JAM 0.97 0.97 0.70 0.14 0.84 0.03 0.10 0.50 0.70 4.94
4.4. Weighing Using ANP Analysis
Weighting is done using an ANP method with the same weight of 1.3 through MATLAB software so that stocks, options and models are indicators as well. The results are as follows
The weight of the options is equal to:
Table 6. Super Matrix
Super Matrix
0.00000 0.00000 0.00000 0.00000 0.00000 0.00000 0.00000 0.00000 0.00000 0.15073 0.17452 0.17849
0.00000 0.00000 0.00000 0.00000 0.00000 0.00000 0.00000 0.00000 0.00000 0.15073 0.14605 0.17849
0.00000 0.00000 0.00000 0.00000 0.00000 0.00000 0.00000 0.00000 0.00000 0.15073 0.17452 0.15283
0.00000 0.00000 0.00000 0.00000 0.00000 0.00000 0.00000 0.00000 0.00000 0.09205 0.17452 0.02717
0.00000 0.00000 0.00000 0.00000 0.00000 0.00000 0.00000 0.00000 0.00000 0.15073 0.06221 0.17849
0.00000 0.00000 0.00000 0.00000 0.00000 0.00000 0.00000 0.00000 0.00000 0.01510 0.01793 0.00627
0.00000 0.00000 0.00000 0.00000 0.00000 0.00000 0.00000 0.00000 0.00000 0.06457 0.17452 0.01906
0.00000 0.00000 0.00000 0.00000 0.00000 0.00000 0.00000 0.00000 0.00000 0.07461 0.01353 0.10640
0.00000 0.00000 0.00000 0.00000 0.00000 0.00000 0.00000 0.00000 0.00000 0.15073 0.06221 0.15283
0.33333 0.35250 0.35011 0.34641 0.42436 0.42084 0.27903 0.42356 0.45193 0.00023 0.00034 0.00029
0.33333 0.29501 0.35011 0.56725 0.15128 0.43163 0.65142 0.06634 0.16111 0.00013 0.00017 0.00015
0.33333 0.35250 0.29978 0.08634 0.42436 0.14753 0.06955 0.51010 0.38696 0.00005 0.00009 0.00004
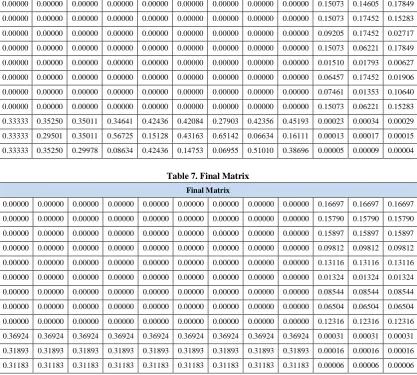
Table 7. Final Matrix
Final Matrix
0.00000 0.00000 0.00000 0.00000 0.00000 0.00000 0.00000 0.00000 0.00000 0.16697 0.16697 0.16697
0.00000 0.00000 0.00000 0.00000 0.00000 0.00000 0.00000 0.00000 0.00000 0.15790 0.15790 0.15790
0.00000 0.00000 0.00000 0.00000 0.00000 0.00000 0.00000 0.00000 0.00000 0.15897 0.15897 0.15897
0.00000 0.00000 0.00000 0.00000 0.00000 0.00000 0.00000 0.00000 0.00000 0.09812 0.09812 0.09812
0.00000 0.00000 0.00000 0.00000 0.00000 0.00000 0.00000 0.00000 0.00000 0.13116 0.13116 0.13116
0.00000 0.00000 0.00000 0.00000 0.00000 0.00000 0.00000 0.00000 0.00000 0.01324 0.01324 0.01324
0.00000 0.00000 0.00000 0.00000 0.00000 0.00000 0.00000 0.00000 0.00000 0.08544 0.08544 0.08544
0.00000 0.00000 0.00000 0.00000 0.00000 0.00000 0.00000 0.00000 0.00000 0.06504 0.06504 0.06504
0.00000 0.00000 0.00000 0.00000 0.00000 0.00000 0.00000 0.00000 0.00000 0.12316 0.12316 0.12316
0.36924 0.36924 0.36924 0.36924 0.36924 0.36924 0.36924 0.36924 0.36924 0.00031 0.00031 0.00031
0.31893 0.31893 0.31893 0.31893 0.31893 0.31893 0.31893 0.31893 0.31893 0.00016 0.00016 0.00016
0.31183 0.31183 0.31183 0.31183 0.31183 0.31183 0.31183 0.31183 0.31183 0.00006 0.00006 0.00006
Table 8. Final weight for 3 top DMU
ROW DMU AB12 AB1 AB2 A12 B12 A1 A2 B1 B2 w
2 VAGHADIR 1.00 1.00 1.00 0.61 1.00 0.10 0.43 0.49 1.00 0.37
6 FOLAD 1.00 0.84 1.00 1.00 0.36 0.10 1.00 0.08 0.36 0.32
4.5. Ranking the Most Efficient Stock
Portfolio Using the QUALIFLEX Method
Since after weighing using the network analysis process, it is observed that the second and third options are of the similar weights, QUALIFLEX technique is used to have more resolution and choose the best option from among the second and third options.
Finally, weights obtained from QUALIFLEX technique are used to rank the stock portfolio and the following results are obtained. Then, the obtained results are multiplied in weights (we call Ghadir
symbol A, the steel symbol B, and the Shepdis symbol C). Now, with the QUALIFLEX model, the best option is assigned number 1, the next is assigned 2, and the worst option is assigned 3. Finally, with the formation of six permutations, the best permutation is obtained as follows.
And thus, the top permutation is the second row. Accordingly, the largest share is to be purchased from the investment company of Ghadir (Holding) and then Pardis Petrochemical Company and finally from Mobarakeh Steel Co. of Isfahan.
Table 9. Formation of six permutations
ROW permutations AB12 AB1 AB2 A12 B12 A1 A2 B1 B2 SUM
1 A>B>C 3 1 1 -3 1 3 1 -1 1 7
2 A>C>B 1 3 3 -1 3 1 -1 1 3 13
3 B>A>C 1 -1 -1 -1 -1 1 3 -3 -1 -3
4 B>C>A -1 -3 -3 1 -3 -1 1 -1 -3 -13
5 C>A>B -1 1 1 1 1 -1 -3 3 1 3
6 C>B>A -3 -1 -1 3 -1 -3 -1 1 -1 -7
5. Discussion and Conclusions
The results presented in this study were based only on studies on the top 20 companies listed in the Tehran Stock Exchange during the third quarter of 2015. In previous studies, optimal portfolio was determined using data envelopment analysis models (Khajavi and Moghaddam, 2012) and multi-criteria decision making techniques (Amiri et al., 2010). but the present study combined these two techniques to evaluate and determine the most efficient portfolio.
The advantage of the DEA-ANP ranking model is that ANP pair-wise comparisons have been derived mathematically from multiple input/output data by running pair-wise DEA runs. Thus, there is no subjective evaluation. The DEA and the ANP methods are commonly used in practice and, yet, both have limitations. The DEA-ANP method combines the best of both models by avoiding the pitfalls of each. ANP is designed for subjective evaluation of a set of
alternates based on multiple criteria organized in a hierarchical structure. In this model, we work with given tangible inputs and outputs of units, and no subjective assessment of the decision maker’s evaluation is involved. The Pareto optimum
limitation of DEA is resolved by the full- ranking performed here by means of the ANP. It is important to note that DEA-ANP does not replace DEA, but rather, it provides further analysis of DEA to full ranking the units.
Therefore, the largest share should be purchased from the investment company of Ghadir (Holding) and then Pardis Petrochemical Company and finally from Mobarakeh Steel Co. of Isfahan.
Researchers can improve this study by changing indicators. For example, instead of placing nine models as indicators, they only put models that have delivered better results and reduce the size of the problem or select
the indexes by 20 stocks and weight models and select the model that weigh more in order to identify the factors affecting stock performance.
Qualiflex method’s development in the fuzzy environment can also be considered in order to use the capabilities of the method.
References
1) Alinezhad, A., (2017). A Hybrid Method of DEA and MODM in Grey Environment. Journal of Industrial Strategic Management, 2, 63-72. 2) Amiri, M., Shariat Panahi, H., & Banakar, M.
(2010). Selection of Optimal Portfolio Using Multi-Criterion Decision Making. Quarterly journal of stock exchange, 11, 5-24.
3) Andersen, P., & Peterson N. C( .1993). A Procedure for Ranking Efficient Unit in DEA. Management Science, 39(10), 1261-1294. 4) Banker, R.D., Charnes, A., & Cooper, W.W.
(1984). Some models for estimating technical and scale inefficiencies in data envelopment analysis. Management Science, 1078-1092.
5) Bowlin, W.F. (1999). An Analysis of the Financial Performance of Defense Business Segments Using Data Envelopment Analysis. J Accounting and Public Policy, 18(4/5), 287-310. 6) Castro, D.M., Parreiras, F.S., (2018). A Review
on Multi-Criteria Decision-Making for Energy Efficiency in Automotive Engineering, Applied Computing and Informatics, doi:https://doi.org/10.1016/j.aci.2018.04.004. 7) Charnes, A., Cooper, W.W., & Sueyoshi, T.
(1986). Least Square/Ridge Regression and Goal Programming/Constrained Regression Alternatives. European Journal of Operational Research, 27, 146-157.
8) Cheng, E., Chaing, Y., & Tang, B. (2007). Alternative Approach to Credit Scoring by DEA: Evaluating Borrowers with Respect to PFI Projects.Building and Environment, 42, 1752-1760.
9) Chen, H. (2008). Stock selection using data envelopment analysis. Industrial Management & Data Systems ,108 (9),1255-1268.
10) Cooper, W.W., Seiford, L., & Ton, K. (2000). Data envelopment analysis: a comprehensive text with models, applications, references and DEA-solver software, Dordrecht. Kluwer Academic Publishers, 2, 68-96.
11) Daneshvar Royendegh, B., & Erol, S. (2008). A DEA–ANP hybrid Algorithm Approach to Evaluate a University’s Performance.
International Journal of Basic & Applied Sciences IJBAS, 10, 115-129.
12) Daneshvar Royendegh, B., & Erol, S. (2008). A DEA–Fuzzy ANP Department Ranking Model Applied in Iran Amirkabir University. Acta Polytechnica Hungarica, vol 7, 103-114.
13) Foroughi, A., Tahari Mehrjardi, M.H., Babaei meybodi, H., & Esfahani, M.J. (2012). Pragmatics of hybrid approach DEA/VIKOR to assess international airports of Iran. Indian Journal of Science and Technology, 8, 3015-3121.
14) Hwang, C., & Yoon, K. (1981). Multiple Attribute decision making: A state of the art survey. Springer-Verlog, 56-64.Kj
15) Johnson, R., & Soenen, L.U.C. (2003). Indicators of Successful Companies. European Management Journal, 3, 364–369.
16) Kazemi, A., Shakourloo, A., & Alinezhad, A. (2017). A Fuzzy Goal Programming Model for Efficient Portfolio Selection. Journal of Optimization in Industrial Engineering, 22, 61-71. 17) Khajavi, Sh., Salimi Fard, A., & Rabieh, M. (2005). Application of Data Envelopment Analysis in Portfolio Determination of the Most Effective Companies Accepted in Tehran Stock Exchange. Social Sciences and Human Sciences Journal of Shiraz University, 22, 75-89.
18) Khajavi, Sh., & Ghayour Moghaddam, A. (2012). Data Envelopment Analysis, A Method for Selecting Optimal Portfolios Based on Stock Liability (Case Study: Companies Listed in Tehran Stock Exchange). Journal of Accounting Progress of Shiraz University, 4(2), 27-52.
19)
Lee,
H.S., & Zhu, J.
(2011).
Super-efficiency DEA in the presence of
infeasibility.
European
Journal
of
Operational Research, 212, 141–147.
20) Potter, A., Beynon, M., & Beresford, A. (2015). Evaluating thee efficiency performance of airports using an integrated AHP/DEA-AR technique. Transport Policy, 42, 75-85.
22) Ronald R. Yager ,(2017). Categorization in Multi-Criteria Decision Making, Information Sciences, doi: 10.1016/j.ins.2017.08.011.
23) Saaty, T.L. (1996). Decision Making with Dependence and Feedback: The Analytic Network Process. RWS Publications, Pittsburgh. 24) Wang, Y.M., Liu, J., & Elhag T.M.S. (2007). An
integrated AHP-DEA methodology for bridge risk assessment. Journal of Computer and Industrial Engineering, 1-13.
25) Zhu, J. (2004). Imprecise DEA via standard linear DEA models with a revisit to a Korean mobile telecommunications firm. Operations Research, 52, 323-329.