A Quantitative Evaluation of Maintainability of Software
Architecture Styles
G.R. Shahmohammadii and S. Jaliliii*
i G.R. Shahmohammadi is Ph.D. of Computer Engineering, Tarbiat Modares University, Tehran, Iran (e-mail: [email protected]) ii * Corresponding Author, S. Jalili is with the Department of Computer Engineering, Tarbiat Modares University, Tehran, Iran (e-mail: [email protected])
ABSTRACT
Proper decisions play a crucial role in any software architecture design process. An important decision of design stage is the selection of a suitable software architecture style. Lack of investigation on the quantitative impact of architecture styles on software quality attributes is the main problem in using such styles. Consequently, the use of architecture styles in designing is based on the intuition of software developers. The aim of this research is to quantify the impacts of architecture styles on software maintainability that is an expected quality of each software. In this study, architecture styles are quantified based on coupling, complexity and cohesion metrics and ranked by analytic hierarchy process from a maintainability viewpoint. Metrics validation confirms fitness of the metrics. Regarding the great impact of this decision on maintainability of software product, the presented parametric model provides a basis for sensible selection of architecture style.
KEYWORDS
Software Architecture, Architectural Style, Coupling, Complexity, Cohesion, Maintainability Evaluation.
1. INTRODUCTION
Knowing the fact that functionality may be achieved using a number of possible structures [1], software architecture styles (SASs) are selected based on the
amount of their support from quality attributes. SASs
present models to solve the problem of designing software architecture in a way that each model describes its components, responsibilities of the components and the way they cooperate [2]. Architectural decisions made early in the design process are a critical factor in the successful development of the system. In particular, the selection of an appropriate architectural style has a significant impact on various system quality attributes [3]. Since quantitative impacts of SASs on quality attributes
have not been studied so far [4], their applications are not systematic [5]. In other words, the current use of SASs in
design is ad-hoc and based on the intuition of software developers.
A method has been shown in [6] to map an architectural style into a relational model that can be checked for various style properties such as consistency of style. In [7] two graph-based approaches have been shown and compared to the specification and modeling of dynamic software architectures. The impact of a
distributed software system’s architectural style on the system’s energy consumption has been estimated in [3]. A method for specifying the relation between six SASs and
quality attributes such as maintainability has been proposed in [8]. The relationship between the quality attributes, design principles and some SASs have been
specified in [8] using a tree-based framework.In [4], the impacts of SASs on quality attributes are determined
based on the description of style in [2]. The methods offered in [4] and [8] are not able to determine the amount of style support from quality attributes, do not offer quantitative results about their maintainability, and are not precise. SASs are evaluated in [9] from maintainability
viewpoint based on the scenario-based evaluation method that is less precise, less reliable and less analyzable as compared to the
measurement-based evaluation method utilized in this paper. In [10], the performance of three SASs has been
investigated through simulation-based evaluation method. Implicit/invocation style has been verified in [11] by model checking method.
In this study, the quantitative impact of SASs on
software maintainability, one of the important quality attributes required by all software, is determined based on the measurement-based evaluation of SASs. The SASs
evaluated include Repository (PRS), Blackboard (BKB),
(I/I), Client/Server(C/S), Broker (BRK) and
Object-Oriented (OO), which have been introduced in [2], [12].
Software architecture evaluation methods include: 1) scenario-based evaluation, 2) simulation-based evaluation, 3) measurement-based evaluation and 4) mathematic model-based evaluation. Measurement-based evaluation method uses metrics to measure software architecture. Metrics evaluate internal attributes of software (e.g. coupling). External attributes (e.g. maintainability) reflect those properties that are desirable for the software user and usually are evaluated by internal attributes. It is believed that there is a relationship between internal and external quality attributes. This relationship is based on theoretical models and empirical study [13], [14]. There is a general agreement in software community that modularity has an influence on external attributes such as maintainability [15]. Therefore, this paper uses coupling, complexity and cohesion metrics to quantify the impact of SASs on software maintainability.
These metrics are essential in evaluation of software design quality and their effects on maintainability have been extensively investigated [15]-[18]. In addition, the merit
of these metrics is investigated using metric validation criteria [19] to clarify the value of their use in a quantitative model.
The advantage of measurement-based evaluation as compared to scenario-based evaluation is that the evaluation would be easier and more precise if there are appropriate metrics. In addition, it does not have the problems of scenario-based evaluation, namely the dependency of the results on the scenarios used, and extensive participation of the expert. As a result, the problem is evaluated more comprehensively.
Multi-criteria decision-making methods are used in the ranking problem of SASs. These methods are in three categories: 1) scoring, 2) compromise and 3) concordance [20]. Analytic hierarchy process (AHP) [21] is one of the most comprehensive multi-criteria decision making methods. It structures the problem as a hierarchy and provides a means of decomposing the problem into a hierarchy of sub problems that can more easily be comprehended and subjectively evaluated. AHP reflects the way people think and behave. It also considers different quantitative and qualitative criteria in the problem and provides sensitivity analysis on the criteria and sub-criteria. The AHP has been proven a theoretically sound, market-tested and accepted methodology.
In this paper, to rank SASs based on the results of measurement-based evaluation of SASs, three methods of AHP (in the scoring category), Technique for Order Preference by Similarity to Ideal Solution (TOPSIS) ( in the compromise category), and Linear assignment (in the concordance category) are used. However, due to space limitation and benefits of AHP method, only the results of AHP method are presented.
This paper is organized as follows. Section 2 discusses software maintainability and its measurement metrics. In section 3, validations of metrics are offered. Section 4 explains the quantitative measurement of SASs. Section 5 deals with the ranking of SASs. Finally, section 6 presents the conclusion.
2. SOFTWARE MAINTAINABILITY AND ITS
MEASUREMENT METRICS
The main objective of any software is to offer desired services according to the predetermined quality level. There is a strong connection between many quality attributes and the software architecture of the software system. The architecture defines the overall potential that a software system possesses to fulfill certain quality attributes. Software are often redesigned not for the deficiency in the functionality, but due to difficulty in maintenance, port or scale [22].
Maintainability is the capability of the software product to be modified [23]. Modifications may include corrections, improvements or adaptations of the software to changes in the environment and in the requirements and functional specifications. The ease of software correction is determined through: 1) analyzability, 2) changeability, 3) stability and 4) testability [23].
A close look at software maintainability attributes reveals that provision of each characteristic depends on the amount of modularity of software design, design with low coupling among modules, low complexity of the modules and high cohesion of modules. Therefore, the less is the amount of coupling and complexity of the components and the more their cohesion, the easier will be the analyzability, changeability, stability and testability of the software. Various researches emphasize the impact of complexity, cohesion of components and coupling among components metrics on software maintainability [15]-[18].
A. Coupling Metric
High interaction of modules makes the understanding and modification of the modules more difficult [15]. The more independent the components, the easier their understanding, modification and maintainability [16]. Coupling is a complex concept that has been categorized by Yourdon and Constantine [24] as: 1) Datacoupling, 2)
Stampcoupling, 3) Controlcoupling, 4) Sharedcoupling
and 5) Contentcoupling.
In this work, we generalize the “coupling among modules” concept to the coupling among software architecture components and use it to measure the amount of coupling of SASs. Components of SASs investigated in
software systems designs. Regarding the coupling metric, SASs are investigated in terms of the type of coupling among the components and the number of components involved in the coupling. The more the strength of coupling among components and the more the number of components involved in the coupling, the less the understandability, correction and maintainability of the components [15]. To measure the coupling value of any
SAS, Eq.(1) is used that is Euclidean norm, where n is the
number of style components, SCP is the amount of SAS
coupling and CCPi is the amount of coupling of the i-th
component. CCPi is computed by Eq. (2), where NCTjis
the number of type j couplings, wjis the weight of the
corresponding coupling type and p is the number of
coupling of the component i:
TABLE 1.TYPE OF COMPONENTS COUPLING
Ro w
Coupling type Symbol Weigh t
1 Data w1 1
2 Stamp w2 2
3 Common w3 4
(1)
(2)
B. Complexity Metric
Complexity value of SASs is computed by Eq. (3) where, SCM is the complexity of SAS, n is the number of
style components and CCMi is the amount of complexity
of the i-th component. CCMi is computed by Eq. (4),
usingthemodule evaluation metric of Shepperd et al [26], where fin(i) is the fan-in of component i and fout(i) is the
fan-out of component i.
∑
= = n
i i CCM SCM
1
2 (3)
CCMi =[fin(i)*fout(i)]2 (4)
fin(i) and fout(i) are computed by Eq. (5) and Eq. (6). In
Eq. (5), Nci is the sum of the number of invocations of
component i by other components and Nri is the number
of data that component i has retrieved from the repository. In Eq. (6), Ncei is the number of other components called
by component i and Nui is the number of the repository
data updated by component i. A component that controls a
lot of components usually performs various functions and so it will have a high complexity [15],[27].
fin(i)=Nci+Nri (5)
fout(i)=Ncei+Nui (6)
C. Cohesion Metric
The cohesion of a module is the extent to which its individual components are needed to perform the same
task. Types of cohesion are: 1) Coincidental, 2) Logical, 3) Temporal, 4) Procedural, 5) Communicational, 6) Sequential and 7) Functional [24]. The cohesion type of every component is computed based on the available information of functionality of each component of SASs
regarding the definition of the type of component cohesion in Table 2 [27].
In this work, we generalize the “modules cohesion” concept to the cohesion of software architecture components and use it to measure the amount of cohesion of SASs. Our investigations showed that the cohesion of SASs in component is of three types: Functional,
Communicational and Logical, which are quantified
based on Table 2.
TABLE 2.TYPE OF COMPONENTS COHESION [27]
Cohesion Type Description Symb
ol Weight Logical Component
performs multiple functions, and in each calling, one of them is executed
C1 1
Communicational Component refers
to the same data set and/or creates the same data set
C2 2
Functional Component performs a single well-defined function
C3 3
Since every component i may have different types of
cohesion (Cj), so the cohesion type of component i, CCHi,
is computed by Eq. (7). Finally, the cohesion of SASs is
computed by Eq. (8).
j j
i C
CCH =argmin (7)
∑
= = ni i CCH SCH
1
2 (8)
3. METRICS VALIDATION
In this section, first, the metrics validation criteria (that verify merit of coupling, complexity and cohesion) are introduced. The metrics are then evaluated by the validation criteria.
A. Metrics Validation Criteria
The metrics are validated through Weyuker’s validation Criteria[19]. The investigation of these criteria in [28], has shown that the criteria (7), (8) and (9) are not usable at the level of object-oriented software classes. The same condition is satified in the components of SASs. Therefore, the first six criteria are used:
∑
=
= n
i i
CCP SCP
1 2
j p
j j i NCT w
CCP .
1
∑
=
1- No Coarseness: There are two components P and Q
for which µ(P) ≠µ(Q).
2- No Uniqueness: There are distinct components P and
Q for which µ (P) = µ (Q).
3-Lack of one to one correspondence between
functionality and metric: There are functionally
equivalent components P and Q for which µ (P) ≠µ (Q).
4- Monotonic ness: For any component bodies P and Q,
we have µ (P) ≤µ (P+Q) and µ (Q) ≤µ (P+Q) where P + Q imply combination of P and Q.
5- Nonequivalence: ∃P, ∃Q, ∃R, such that µ(P) = µ(Q)
does not imply that µ(P + R) = µ(Q + R).
6- Interaction increases complexity: ∃P and ∃Q such
that: |µ(P+Q)| ≥ µ(Q)+ µ(P). By combining two components, the interaction between them can increase the metric value.
B. Validation of Coupling Metric
The possibility that the components like P and Q exist and µ(P) ≠ µ(Q) is non-zero. So criterion 1 is satisfied. Equally the possibility that components such as P and Q exist and µ(P)≠µ(Q) is non zero, criterion 2 is also satisfied. Two components with the same functionality may have different amount of coupling due to being in different styles. In other words, since there is no one-to-one correspondence between the compone-to-onents' coupling and functionality, criterion 3 will be also satisfied. By combining P and Q components, the resulting components' coupling equals nP+nQ-α, in which, α is the
quantity of coupling decrease due to combination of components. The quantity of coupling decrease is not more than the number of primary couplings (nQ-α≥0 and
nP-α≥0), hence:
nQ+ nP -α≤ nP for all P & Q
nQ+ nP -α≤ nQ for all P & Q
It means that for all P and Q, µ (P+R) ≥µ (P) and µ
(P+Q) ≥µ (Q). Therefore, criterion 4 is also satisfied. Let P and Q be two components such that µ(P) = µ(Q) =n, and let R be another component with µ (P) = r, then:
µ(P+R)=n+r-α
Similarly µ(Q+R)=n+r-β
Given that α and β are independent functions, they will not be equal, i.e., µ(P+R) ≠ µ(Q+R, so, criterion 5 is
satisfied.
For any two components P and Q, nQ+ nP -α≤ nP, i.e.
µ(P+Q)≤µ(P)+µ(Q)-δ, impling that µ(P+Q)≤µ(P)+µ (Q)
for any P & Q. Thus, criterion 6 is not satisfied.
If criterion 6 is not satisfied, it means that after the division of one component into several components, complexity has increased. It is clear by dividing one component into several components, complexity is increased if there is high interaction among components
while complexity is decreased if there is low interaction among them. Therefore, without satisfying criterion 6, the merit of criteria is still satisfied. This criterion was not satisfied for the metrics discussed in [28] and it appeared that violation of this criterion did not lead to the violation of criteria merit.
It is worth mentioning that two other metrics (complexity and cohesion) were also validated. It was clarified that criteria 1 to 5 were satisfied.
4. QUANTITATIVE MEASUREMENT OF SASS
In this section, SASs are measured from the viewpoint
of maintainability based on coupling, complexity and cohesion metrics.
The effect of software size on SASs ranking is taken
into account in the computations of this section. In object-oriented style, the number of objects (no) and in other SASs, the number of components (n) correspond the
software size. So in the evaluations done in this section, the number of SASs components is considered as 3, 4, 5,
6, 7, 8 and 9 and the number of classes in object-oriented style is considered accordingly as 21, 28, 35, 42, 49, 56 and 63.
A. Measuring the Coupling of SASs
In this section, the coupling formula of every SAS is
computed using Eq. (1) to Eq. (2).
A. Repository style. In this style, all components have
common coupling with the repository. Therefore, any change in the repository affects them. If the number of components in the repository style is n, then the number of couplings in this style will be n as well. Thus coupling of repository style is obtained from n.
w
3.B. Blackboard style. The control component has a
common coupling with the blackboard and has data coupling with the knowledge resources. Therefore, the control component has one common coupling and n data coupling while the knowledge resources have a common coupling with the blackboard. Thus, the coupling of the control component is n.w1+ w3 and the coupling of each
knowledge resource is w3. Then coupling of this style is
obtained from 2
3 2 3 1 ) . .
(nw+w +nw .
C. Pipe and filterstyle. Every filter (component) has a
stamp coupling with the next filter while the last filter has no coupling with any other filter. The number of couplings is n-1, and regarding the coupling type, the coupling of this style is obtained from n−1
w
2D. Layered style. The coupling type of every layer
(component) with its lower layer is data. Considering the fact that coupling is two way, the last and first layers have only one coupling while other layers have two couplings. So for n layer, the coupling of this style is obtained from
2 1 2 1 2. ). 2 (
4n− W + W .
components publish the events that are favored by n/2 of the components, the coupling type of the event publisher component with the dispatcher component is data. If an event occurs, the dispatcher component invokes the interested components, so the coupling type of the dispatcher component with the interested components is data, and the coupling of the dispatcher component will be (n/2).w1. The coupling type of independent
components (n/2) is data, so coupling of this style is obtained from (( /2). ) ( /2). 2
1 2
1
w
w
nn + .
F. Client/server style. The coupling of the client with the
server is data type. Supposing that, in average, the coupling of each server component is f and, since some
server components are in transaction and usually the last component is related to repository, thus about r % of the
components have just one connection with the repository. So, coupling of this style is obtained
from 2
3 2 1 2 (1 ) ( . )
1 r n f w rnw
w + − + .
G. Broker style. Coupling of all components is data type.
Considering these facts: (1) the client component is related to the client side proxy, (2) the client is related to the broker in order to be informed of different services of the server, (3) the server side proxy is coupled with the broker, (4) the broker is coupled with the server side proxy and (5) the broker is coupled with the server for being informed of different type of services of the server, and also considering the similarity of the coupling of the server components to client/server style, the style
coupling is obtained from 2
3 2 1 2 (1 ) ( . ) . .
8
1 r n f w rnw
w + − + .
H. Object oriented style. In this style, the type of
coupling is data. A case study done by Yu and Ramaswamy [29] on components dependency showed that 83% of the couplings between classes are of parameter (data) type. Coupling of each class with other classes is considered as fo. So style coupling is obtained
from fo no.
w
1.Column 2 of Table 3 shows the coupling formulas of
SASs. The third column shows the coupling value
obtained by replacing the weight of coupling type based on Table 1.
TABLE 3.COUPLING FORMULAS OF SASS
Symbol Coupling Formula Coupling Value
RPS n.
w
3 3 nBKB 2
3 2 3
1 ) .
.
(nw+w +nw (n+3)2+9n
P/F n−1
w
2 2 n−1LYD 2
1 2 1 2. ). 2 (
4n− W + W 4n−6
I/I ((/2). )2 (/2). 12
1
w
w
nn + (n/2)2+(n/2)
C/S 2
3 2 1 2 (1 )( . )
1 rnfw rnw
w+ − + 1+(1−r)n.f2+9.r.n
BRK 2
3 2 1 2 (1 )( . ) ..
8
1 rnfw rnw
w+ − + 8+(1−r)n.f2+9.r..n
OO fo no.
w
1 fo noThe coupling value of classes in object-oriented style (fo) is related to the designing manner of the past software
systems. This is true for the coupling value of server components (f) in the broker and client/server styles as
well. Therefore, software designers determine the average value of coupling (i.e. f and fo) by referring to the
previous software design records. For displaying the relationship between coupling value and software size, it is necessary that first the values of f, r and fo parameters
are determined. Thus, documents of software design projects of a large and valid software company in Iran is investigated. Accordingly, after computations, the values of these parameters become f=1.65 and fo=1.5 and r=0.2.
By setting the parameters of f,fo and r tothe designated
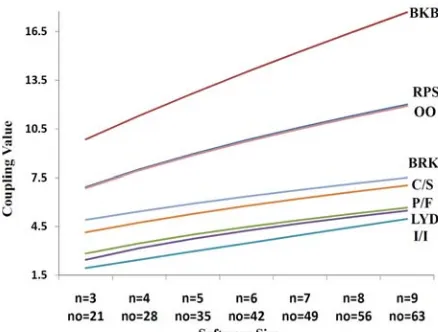
formulas andparameters n and no, the coupling value of SASs is computed considering the software size (number
of components), and its diagram is shown in figure 1. According to this diagram, the coupling value of SASs
is increased by increasing the software size.
Figure 1: Coupling value of SASs based on the size of software
B. Measuring the Complexity of SASs
In this section, the complexity formula of every SASs is
computed using Eq. (3) to Eq. (6).
A. Repository style. In this style, all components read
from the data repository and modify it. Thus, both their in and out are equal to 1. Therefore, the total fan-out of each component, considering the writing in the repository and invoking the repository for this writing, is 3. Thus the complexity of independent components is 9 and the complexity of style is obtained from 9 n.
B. Blackboard style. The fan-in of the control component
the control component is 22, the complexity of each of the
knowledge resource is 36, and complexity of style is obtained from 42+362n.
C. Pipe and filter style. The first filter (component) has
no input and the last filter does not have any output. Thus, their complexity is 0. The other filters have one input and one output. So the complexity of style is obtained from
2
−
n .
D. Layered style. In this style, the relation of lower layer to upper layer is response to the request of upper layer, so in computing of layer's fan-out, this relation is ignored, i.e. only upper layer invokes lower layer. Thus, each layer has fan-in and fan-out equal to 1. None of the layers does not invoke first layer and the last layer invokes no layer. So their complexity is 0 and the complexity of style is obtained from n−2.
E. Implicit invocation style. With the occurrence of an
event, the dispatcher component invokes the interested components. Therefore, the fan-in of dispatcher component is 1 (for occurrence of the event that led to the invoking of the interested component by the dispatcher component) and its fan-out is 1 (for invocation of the interested component, when an event occurs). Therefore, its complexity becomes 1. The complexity of event publisher due to the lack of fan-in and the complexity of interested components due to the lack of fan-out is 0. Therefore, the complexity of style gets 1.
F. Client/server style. The client component invokes a procedure from the server, so in of the server and fan-out of the client are set to 1. Since the client is not invoked by the components and has no direct access to the repository, its fan-in is equal to 0 and its complexity is 0. The number of fan-ins and fan-outs of the server components, in average, is considered as f. So the
complexity of each server component is f 4 and the
complexity of style is
f
4n
.G. Broker style. The client component gets informed of
the services of the server through the method interface of the server that has been offered to the broker component, so both fan-in and fan-out of the server becomes 1. In addition, fan-in of the broker becomes 1 due to accessing the interface of the server services. The client invokes the client side proxy, thus its fan-out becomes 1 as well. The client side proxy sends a request to the broker component, therefore, both its fan-in and fan-out become 1. The broker component sends the request to the server side proxy. On the other hand, the broker invokes the server to get informed of the interface of the server services. Therefore, both fan-in and fan-out of the broker become 2. The server side proxy has the fan-in and fan-out equal to those of the client side proxy too. The complexity of server components is considered similar to that of the
client/server style, thus style complexity is obtained from
n f8
274+ .
H. Object-Oriented style. If, in average, the number of
fan-in and fan-out of each class is considered as fo, then
the complexity of each class becomes fo4 and the
complexity of style is fo no 4 .
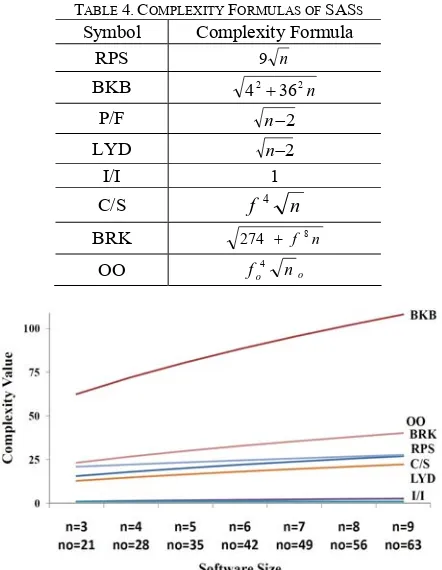
Table 4 shows the complexity formulas of SASs.
Values of f and fo are considered as similar to those in
the Section 4.A.
By setting the parameters n and no, the complexity
value of SASs is computed considering the software size
and its diagram shown in figure 2. According to this diagram, the complexity value of most SASs is increased
by increasing the software size.
TABLE 4.COMPLEXITY FORMULAS OF SASS
Symbol Complexity Formula
RPS 9 n
BKB 42+362n
P/F n−2
LYD n−2
I/I 1
C/S f 4 n
BRK 274 + f8n
OO fo no
4
Figure 2: Complexity value of SASs based on size of software
C. Measuring the Cohesion of SASs
In this section, the cohesion formula of every SAS is
computed using Eq. (7) to Eq. (8).
A. Repository style. Each component processes the same
set of data, so their cohesion type is communicational. The repository component performs various functions on the data, and in each calling, one of the functions is performed. Therefore, its cohesion type becomes logical, and the cohesion of style is n
c
c
21 2 2+ .
B. Blackboard style. Each knowledge resource processes
communicational. The control component invokes the knowledge resources based on the status of the blackboard. Therefore, its cohesion type is logical. The blackboard component performs various functions and, in each invocation, one of these functions is performed. So, its cohesion type is logical, and the cohesion of style is n
c
22+2c
12.C. Pipe and filter style. Each filter processes the same
set of data, so its cohesion type is communicational and the cohesion of style is n.
c
2.D. Layered style. Each layer contains some components;
regarding the invoking of upper layer, one of components of the lower layer is performed, so the cohesion type of each layer is logical and the cohesion of style is n.
c
1.E. Implicit invocation style. Since the components are
publisher or interested in the event, their cohesion type is communicational. The dispatcher component performs various functions and, in each invocation, one of them is performed. Thus, its cohesion type is logical and the cohesion of style is 2
2 2 1 nC
C + .
F. Client/Server style. The server provides various
services for the client by its components, and in each invocation, one or some of the server components are performed so that each one works on the same data. Accordingly, their cohesion type is communicational. The client component performs a specific function, so its cohesion type is functional. The repository component performs various functions and in each calling, one of them is performed. So its cohesion type is logical and the
cohesion of style is 2
3 2 2 2
1 nC C
C + + .
G. Broker style. The client side proxy, server side proxy,
broker and server components perform various functions and in each invocation, just one of these functions is performed. Therefore, their cohesion type is logical. Because the client component performs a specific function, its cohesion type becomes functional. The repository component performs various functions and in each calling, one of them is performed. Therefore, its cohesion type is logical. Cohesion of the server components is considered similar to that of the client/server style. Thus, the cohesion of style
is
C C C12 n 22 23
4 + + .
H. Object-Oriented style. The classes in this style define
the data of an entity and its related functions. Hence, the cohesion type of each class is communicational and the cohesion of style is no.C2.
Column 2 of Table 5 represents the cohesion formulas of SASs. The third column shows the cohesion value
obtained by replacing the weight of cohesion type based on Table 2.
TABLE 5.COHESION FORMULAS OF SASS
Symbol Cohesion Formula Cohesion Value RPS n
c
22+c
12 4n+1BKB 2
1 2
2 2
.C C
n + 4n+2
P/F n.
c
2 2 nLYD n.
c
1 nI/I 2
2 2 1 nC
C + 1+4n
C/S 2
3 2 2 2
1 nC C
C + + 10+4n
BRK 4C12+nC22+C23 13+4n
OO no.C2 2 no
By setting the parameters n and no, the cohesion value
of SASs is computed considering the software size and its
diagram is shown in figure 3. According to this diagram, the cohesion value of SASs is increased by increasing the
software size and the amount of increase is higher in the object-oriented style relative to the other styles.
Figure 3: Cohesion value of SASs based on the software size
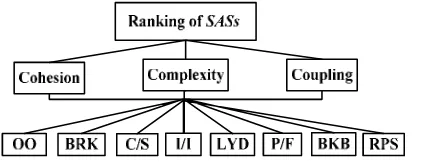
5. COMPUTATION OF THE RANK OF SASS
In this section, the ranking of SASs is performed based
on the results of measurement coupling, complexity and cohesion of SASs using AHP method.
A. Organizing Ranking Problem of SASs
In SASs ranking problem, aim is in the first level,
metrics are in the second level and SASs are in the third
levels of the structure.
B. Computation of Priority of Metrics and the Relative Rank of SASs
In this stage, comparison matrix of the metrics and comparison matrices of SASs for the metrics are formed.
The complexity and cohesion values of a component do not affect the other components of SAS. However, the
coupling value of a component affects the related components. Accordingly and due to the emphasis of researches on the importance of coupling [13] ,[ 15], the preference of coupling metric is considered more important than (1.6 ) the other metrics, and the preferences of other metrics are considered equal. Then the relative priority of metrics is computed by the AHP method, the relative priority of coupling becomes 0.444 and that of the other metrics become 0.278.
To determine the relative rank of SASs for each metric,
comparison matrices of SASs for each metric is formed.
To set cell (i, j) of the comparison matrix of metric k, for
the style x in row i with the style y in column j, if there is
a direct relation between the metric k and maintainability,
the ratio of the metric value of style x to the metric value of style y is set to cell (i,j), otherwise the inverse of the ratio is set to cell(i,j). After setting of the comparison matrices based on the described procedure, the relative rank of SASs for each metric is computed by AHP
method.
Investigation of the consistency using the Expertchoice tool, tool of AHP method, showed that consistencyindex is zero, so there is no inconsistency between the comparisons.
C. Computing the Final Rank of SASs
The final rank of SASs is computed regarding the
priority of metrics and the relative ranks of SASs. Table 6
shows the final rank of SASs. Based on the values of this
Table, the Implicit/ Invocation (I/I), Pipe and Filter (P/F),
and Layered (LYD) styles provide the highest support for
maintainability, respectively.
TABLE 6.RANK OF SASS FROM THE MAINTAINABILITY VIEWPOINT
n=9 n=8 n=7 n=6 n=5 n=4 n=3
no=63 no=56 no=49 no=42 no=35 no=28 no=21 Symbo
70 70 70 69 69 67 64 RPS
55 55 55 55 54 54 52 BKB
158 160 163 166 170 176 187 P/F
146 149 151 155 161 169 185 LYD
260 257 255 251 246 238 223 I/I
99 99 99 98 97 97 95 C/S
95 94 94 92 91 89 87 BRK
116 116 115 114 112 110 107 OO
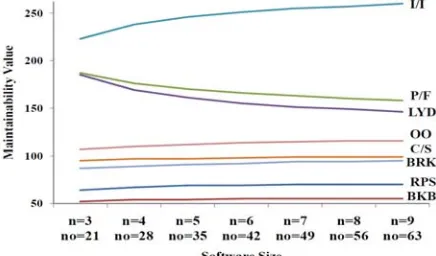
Figure 5 shows the changes in maintainability value of
SASs based on the changes of software size. With the
increasing of software size, the rank of some styles such as Pipe and Filter (P/F) and Layered (LYD) are decreased,
and the rank of some styles such as Implicit
Figure 5: Maintainability value of SASs based on the changes of
software size
Invocation (I/I) are increased while the rank of some
styles such as Blackboard (BKB) are not changed
considerably.
Figure 6 shows the diagram of styles ranks based on the relative priority of metrics. It is known as sensitivity analysis diagram, which is drawn by Expertchoice. In this diagram, the vertical lines show the relative priority of metrics and the horizontal lines show the rank of SASs
based on the metrics. The final rank of SASs is determined
by the “OVERALL” label based on the vertical line (Figure 6). The coupling metric accords with the y-axes and after that are complexity, cohesion and combination of the three metrics.
D. Analyzing the Rank of SASs
Here, by changing the values of some parameters, the effects of these changes on the rank of SASs are
investigated.
1- For the values of coupling types (Section 2.A), other values were used besides the values mentioned in table 1 (for twelve values in the ranges of 1≤w1≤1.5, 1.5≤w2≤2.5 and 2.5≤w3≤3.5),
but they did not lead to any changes in the rank position of the SASs' maintainability.
2- For the values of cohesion types (Section 2.C), other values were used besides the values mentioned in table 2 (for twelve values in the ranges of 1≤c1≤1.5, 1.5≤c2≤2.5 and 3≤c3≤3.5), but
they did not lead to any changes in the rank position of the SASs' maintainability.
3- By changing the f parameter (coupling of the server components in Section 4.A) in the range of 1.65≤ f≤2.8 at the Client/Server (C/S) style, the
change in the rank position of this style was checked. It was found that only for f≥2, therank
position of this style is placed after the Broker (BRK) style and no other changes in the rank position of other styles were seen.
4- For determining the relative priority of metrics (In Section 5.B), in addition to 1.6 (the relative priority of coupling metric compared to that of the other metric), the ten values in the range of 1.3 to 2.2 were used. The results showed no changes in the rank position of the styles from maintainability viewpoint.
In addition to AHP method (Section 5), two methods
of TOPSIS and Linear Assignment were used for
computing the rank of SASs. The results are shown in table 7. The rank positions of the styles in three methods are as follows: the rank position of Implicit/ Invocation (I/I), Repository (RPS) and Blackboard (BKB) styles are the same. The rank positions of Pipe and Filter (P/F),
Layered (LYD), Client/Server (C/S) and Broker (BRK)
styles are different, only one position better or worse, but the rank position of Object-Oriented (OO) style in AHP
method is different in two positions with the other methods. Regarding the robust infrastructure of AHP method, we accept the SASs ranking of this method.
TABLE 7.RANKING OF SASS BY DIFFERENT METHODS
Method Rank
TOPSI S
Linear
Assignment AHP
1 I/I I/I I/I 2 LYD P/F P/F 3 P/F C/S LYD 4 C/S LYD OO 5 BRK BRK C/S 6 OO OO BRK 7 RPS RPS RPS 8 BKB BKB BKB
6. CONCLUSION
In this study, a model was offered to analyze the impact of SASs on softwaremaintainability according to
the measurement-based evaluation of SASs. In this model,
first, the formulas were presented to compute the coupling, complexity and cohesion values of each SAS.
Next, the coupling, complexity and cohesion values of
SASs were computed quantitatively using the presented
formulas. Then, the relative rank of each SAS was
determined regarding the coupling, complexity and cohesion values of SASs. Afterward, the priority of
metrics was determined. Subsequently, the final rank of
SASs maintainability was determined using the three
methods of AHP, TOPSIS and Linear Assignment considering the priority of metrics and the relative rank of each SAS. The results showed that rank of SASs in all of
the mentioned three methods was very close to each other. The analyses done showed that our proposed method had stability regarding the value of coupling types, different values of f parameter, value of cohesion types
and preference of coupling metric to the other metrics. As mentioned in the Section 3, merit of used metrics was assessed and confirmed.
Since the evaluation of this paper is based on measurement as compared to the method used in [9], which uses scenario-based evaluation and the quality of its results is dependent on the used scenarios and also on the extensive expert participation, the results of our proposed model is more precise, more reliable and more analyzable.
The proposed method validates merit of the used metrics and their relations with maintainability. However the methods in [4], [8], [9] lack such validation. The proposed method gives formulas to determine the values of 1) coupling, 2) complexity and 3) cohesion of each SAS, while this has not been done in previous methods.
As compared to [4], [8], both the proposed method and the method used in [9] give the quantitative results about the maintainability of SASs that is basis of the systematic recommendation and selection of SAS.
Finally, only the proposed method examines the effect of the software size on the maintainability rank of SASs.
The methods given in [6], [7], [11] use the mathematic model-based evaluation and the method used in [10] uses the simulation-based evaluation. These methods verify specific features such as consistency and satisfaction of some properties by SASs that are different from the quality attributes required in this paper. The above points and table 8 clearly show the position of the proposed method as compared to the methods in [4], [8] and [9].
TABLE 8. COMPARISON OF THE PROPOSED METHOD WITH THE RELATED METHODS
7. ACKNOWLEDGEMENT
This work was supported in-part by the Iranian Telecommunication Research Center (ITRC).
8. REFERENCES
[1] L. Bass, P. Clements, and R. Kazman,"Software Architecture in Practice" (2nd Edition), Addison-Wesley, 2003, p. 89.
[2] F. Buschmann, R. Meunier, H. Rohnert, P. Sornmerlad, and M. Stal, "Pattern-Oriented Software Architecture- A system of Patterns", John Wiley & Sons, 1996, p. 394.
[3] C. Seo, G. Edwards, S. Malek, and N. Medvidovic," A Framework for Estimating the Impact of a Distributed Software System’s Architectural Style on Its Energy Consumption", 7th Working IEEE/IFIP Conf. on Software Architecture, 2009, pp. 277-280. [4] B. Harrison, and P. Avgeriou, "Leveraging Architecture Patterns to
Satisfy Quality Attributes", 1st European Conf. on Software Architecture, Springer, pp. 263-270, 2007.
[5] P. Avgeriou P, and U. Zdun, "Architectural Patterns Revisited: A Pattern Language", Proc. of 10th European Conf. on Pattern Languages of Programs، 2005, pp.1-39.
[6] J.S Kim, and D. Garlan, "Analyzing Architectural Styles with alloy", Proc. of the ISSTA 2006 workshop on Role of Software Architecture for Testing and Analysis, 2006, pp. 70-80.
[7] R. Bruni, A. Bucchiarone, A. Gnesi, D. Hirsch, and A.L. Lafuente,"Graph-based Design and Analysis of Dynamic Software Architectures", LNCS 5065, pp. 37–56, 2008.
[8] H. Reza, and E. Grant, "Quality-Oriented Software Architecture", The IEEE Int. Conf on Information Technology, 2005, pp. 140 – 145.
[9] G.R. Shahmohammadi, and S. Jalili,"Scenario-Based Quantitative Evaluation of Software Architecture Style from Maintainability Viewpoint", 14 th Annual of CSI Computer Conference (CSICC 2009), Iran, Amirkabir University, 2009.
[10] H. Grahn, and J. Bosch,"Some Initial Performance Characteristics of Three Architectural Styles", Proc. of Int. Workshop on Software and Performance, 1998.
[11] D. Garlan, and S. Khersonsky, "Model Checking Implicit Invocation Systems", 10th Int. Workshop On Software Specification and Design, 2000.
[12] M. Shaw, D. Garlan, "Software Architecture: Perspectives Discipline on an ٍEmerging Discipline”, Prentice Hall, 1996. [13] L. Briand, S. Morasca, and V. Basili, "Property Based Software
Engineering Measurement", IEEE Trans on Software Eng., Vol. 22, No. 1, pp. 68-86, 1996.
[14] L. Briand, J. Wust, and H. Lounis, "Using Coupling Measurement for Impact Analysis in Object-Oriented Systems", IEEE Int. Conf. on Software Maintenance, 1999.
[15] S.L. Pfleeger, and J.M. Atlee,”Software Engineering, Theory and Practice”, 3rd Edition, Prentice Hall, 2006.
[16] P. Yu, T. Systa, and H. Muller, "Predicting FaultProneness using OO Metrics. An Industrial Case Study," 6th European Conf. on Software Maintenance and Reengineering, 2002, pp.99 – 107. [17] M. Alshayeb, and L. Wei, "An Empirical Validation of
Object-Oriented Metrics in Two Different Iterative Software Processes," IEEE Trans on Software Engineering, Vol. 29 (11), pp. 1043 – 1049, 2003.
[18] F. Bachmann, L. Bass, M. Klein, M. and C. Shelton, “Designing Software Architectures to Achieve Quality Attribute Requirements”, IEE Proc. of Software, Vol. 152, No 4,pp. 153- 165, 2005. [19] E. Weyuker, "The Evaluation of Software Complexity Measures",
IEEE Trans on Soft. Eng, 14, pp. 1357-1365, 1988.
[20] C.L. Hwang, K. Yoon, "Multiple Attribute-Decision Making", Springer-Verlag, 1981.
[21] T. L. Saaty, and L .G. Vargas, “Models, Methods, Concepts & Applications of the Analytic Hierarchy Process”, Kluwer Academic Publisher, 2001.
[22] L. Bass, P. Clements, and R. Kazman," Software Architecture in Practice", Addison-Wesley, 1998, p. 17.
[23] ISO, International Organization for Standardization, “ISO 9126-1:2001, Software Engineering – Product quality, Part 1: Quality model”, 2001.
[24] E. Yourdon, and L. Constantine, "Structured Design", Englewood Cliff, NJ, prentice Hall,1978.
[25] N. Fenton, and A. Melton, "Deriving Structurally Based Software Measures", Journal of Systems and Software 12(3), pp. 177-187, 1990.
[26] M. J. Shepperd, and D.C. Ince, "The use of metrics in the early detection of design errors", Proc.of the European Software Engineering Conf, 1990, pp.67-85.
[27] NE. Fenton, and SL. Pfleeger,"Software Metrics: A Rigorous and Practical Approach", (2nd Edition), International Thomson Computer PRESS, 1997.
[28] S. Chidamber, and C. Kemerer,"A Metrics Suite for Object Oriented Design", IEEE Trans on Software Engineering, Vol. 20, pp. 476-493, 1994.