IJIRMPS1806007
Website :
www.ijirmps.org
Email : [email protected]
43
The QRS Complex Detection Approach
1Priyanka Mayapur
1B.E Student
1Dept. Of Electronics and Communications Engineering, 1Agnel Institute of Technology and Design, Assagao, Goa, India
Abstract: A graphical demonstration of the electrical signals produced through the heart movement could be termed as Electrocardiogram (ECG). Analysis of ECG by identifying the various features and traits could help us detect the standard and pathological physiology of the heart, thus providing valuable information about the activity of the human heart. Automatic classification of ECG has evolved as an emerging tool in medical diagnosis for effective treatments. In this Research paper, a real time procedure for recognition of QRS Complex and its duration has been developed. Also, the work proposed in this paper reviews and summarizes the various techniques used by researchers in order to detect and delineate QRS Complex. ECG signals in this exertion are unruffled from MIT-BIH record and it has been implemented using MATLAB routine consisting of four different databases formats. The processing of the data was done on the Lead-II ECG signals.
Index Terms: Electrocardiogram (ECG), QRS Complex, Lead-II Configuration, Matlab, Pan Tompkins Algorithm.
________________________________________________________________________________________________________
I.INTRODUCTION
Heart is a muscular structure accountable in propelling oxygenated blood through the body via blood receptacles by rhythmic contractions [1]. The power source that makes this possible is the electrical system of the heart which gives rise to electrical impulses that triggers the heartbeat acting as a source of voltage, therefore, generating a current flow in the torso and corresponding potentials on the skin [2]. And this electrical activity can be subsequently measured by placing electrodes over different areas on surface of the skin and recorded using an external device.
Fig. 1: The Human Heart (a) and ECG image portraying a 12 channel recording (b)
The electrical manifestation of the contractile activity of the heart’s myocardium is termed as Electrocardiogram (ECG). It is a graph that records the deviation of the bio potential signal of the human heartbeats using electrodes [2, 3]. The ECG technique helps in determining a lot of features like the morphology, durations, amplitudes, segments, intervals, appearance sequence, rhythm and regularity, position of the heart, thickness of chambers, inflammation and the heart rate.
And the output of each and every electrode is known as a Lead. Invented by Willem Einthoven in 1901, the ECG is recorded in an image entailing of all 12 networks or lead demos interweaved 3 second interludes from groupings of leads per row. They often transpire in the identical order:
First row: I, AVR, V1, V4 Second row: II, AVL, V2, V5 Third row: III, AVF, V3, V6
All happening ranged in columns. Since dissimilar ailments apparent contrarily in each of the leads, it is imperative to detach the dissimilar tips. The ECG rackets due to interventions like electrode communication, gesticulation artifacts, base-line drift and arrangement nose produced by electronic devices, electrosurgical noise, and muscle contraction sometimes hamper the signal [5]. Accurate measurements of ECG parameters are an important requirement for ECG analysis and this could be done using signal processing. It’s basically a technique used to extract the morphological and dynamic features in order to classify and evaluate an ECG.
II.THE CARDIAC CYCLE AND HEART DEFECTS
IJIRMPS1806007
Website :
www.ijirmps.org
Email : [email protected]
44
We all know that heart diseases are recognized as one of the major causes of death in the world and the best diagnostic tool to determine any abnormality in the cardiac function or tissue damage would be through ECG [6]. In the morphology of ECG signal where the normal rhythm of the heart represents no disease or disorder is called Normal sinus rhythm (NSR).Fig. 2: A General ECG Waveform
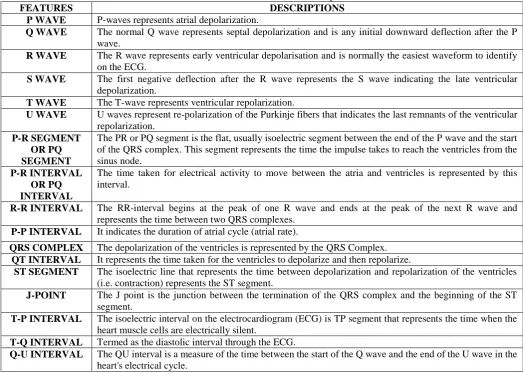
The table 1 shows the ECG features and descriptions.
Table 1: ECG Features and their Description
FEATURES DESCRIPTIONS
P WAVE P-waves represents atrial depolarization.
Q WAVE The normal Q wave represents septal depolarization and is any initial downward deflection after the P wave.
R WAVE The R wave represents early ventricular depolarisation and is normally the easiest waveform to identify on the ECG.
S WAVE The first negative deflection after the R wave represents the S wave indicating the late ventricular depolarization.
T WAVE The T-wave represents ventricular repolarization.
U WAVE U waves represent re-polarization of the Purkinje fibers that indicates the last remnants of the ventricular repolarization.
P-R SEGMENT OR PQ SEGMENT
The PR or PQ segment is the flat, usually isoelectric segment between the end of the P wave and the start of the QRS complex. This segment represents the time the impulse takes to reach the ventricles from the sinus node.
P-R INTERVAL OR PQ INTERVAL
The time taken for electrical activity to move between the atria and ventricles is represented by this interval.
R-R INTERVAL The RR-interval begins at the peak of one R wave and ends at the peak of the next R wave and represents the time between two QRS complexes.
P-P INTERVAL It indicates the duration of atrial cycle (atrial rate).
QRS COMPLEX The depolarization of the ventricles is represented by the QRS Complex. QT INTERVAL It represents the time taken for the ventricles to depolarize and then repolarize.
ST SEGMENT The isoelectric line that represents the time between depolarization and repolarization of the ventricles (i.e. contraction) represents the ST segment.
J-POINT The J point is the junction between the termination of the QRS complex and the beginning of the ST segment.
T-P INTERVAL The isoelectric interval on the electrocardiogram (ECG) is TP segment that represents the time when the heart muscle cells are electrically silent.
T-Q INTERVAL Termed as the diastolic interval through the ECG.
Q-U INTERVAL The QU interval is a measure of the time between the start of the Q wave and the end of the U wave in the heart's electrical cycle.
Cardiac Arrhythmia could be defined as a disorder or disturbance or any abnormality resulting in the normal activation sequence of the myocardium giving rise to irregular heartbeat or abnormal rhythm of the heart that may cause permanent injury to the heart. Although cardiac arrhythmia is one of the leading causes of death, it can be treated if detected on time [7, 8 and 9].
Under the expert guidance of the doctors and after lots of literature review, it was seen that Lead II is the most preferred monitoring lead of choice for continuous ECG monitoring. Nowadays, ECG has become a golden medium for detecting Arrhythmia and Cardiovascular diseases and also could detect bifid P wave in lead II (P Mitrale).
III.THE QRS COMPLEX SIGNIFICANCE
IJIRMPS1806007
Website :
www.ijirmps.org
Email : [email protected]
45
The QRS Complex is the most characteristic waveform of the ECG signal and is termed as the ventricular complex that represents the ventricular depolarisation. Since the ventricles of the heart have larger muscle mass and are thicker, this process consumes more electrical activity and represents the average depolarisation of the inner and outer cardiomyocytes [4, 5, 11 and 12]. The QRS duration is an indication of how fast the ventricles depolarize and the voltage required to cause ventricular contraction is comparatively more and therefore the wave is much bigger.In a normal sinus rhythm, the complex consists of a combination of the Q wave, R wave and the S wave indicating the change in direction of the electrical stimulus as it passes through the heart's conduction system. In a Lead-II ECG Configuration, the Q wave represents a small negative wave indicating the depolarisation of the septum, R wave is the sharpest component and the largest wave in the tracing and represents the electrical stimulus as it passes through the main portion of the ventricular walls and the S wave is the negative wave following the R wave indicating depolarisation in the Purkinje fibers. The entire complex along with the individual waves indicates information about the ventricular activity and is clearly visible in Lead-II Configuration. Usually the QRS Complex is used to identify factors like the heart rate, regularity, rhythm and arrhythmias and also the proper functioning of the heart [13]. A normal QRS Complex present right after the P wave indicates that normal depolarisation of the ventricles has occurred.
Fig. 3: The QRS Complex and the QRS Complex Duration
It is very important to analyze each QRS complex on the tracing and report the duration measurement and describe the shape. Any changes in the shape of the waveform can indicate the locus of stimulation has changed or a different conduction pathway was followed. Also a change in duration like lengthened or shortened or widened can convey some critical information about the heart. The QRS Complex in itself provides a lot of information about the health of the heart and it is very necessary to determine and analyze it in order to be aware of diseases if any and also the functioning of the heart along with its rhythm. Processing it could really provide us some significant information and treat the defects.
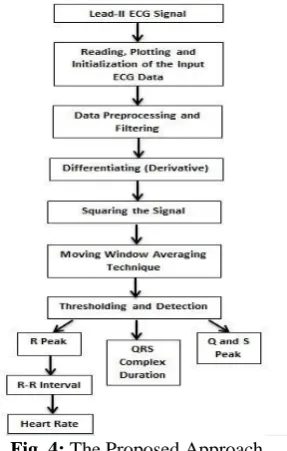
IV.FLOWCHART MODEL
Fig. 4: The Proposed Approach
V.BACKGROUND SURVEY
In a paper proposed by Jiapu Pan et al, a real-time algorithm for detection of the QRS complexes of ECG signals was developed on the basis of digital analyses of slope, amplitude, and width. With increased detection sensitivity, the algorithm automatically adjusted thresholds and parameters periodically to adapt to such ECG changes as QRS morphology and heart rate. The accuracy of this algorithm detects 99.3 percent of the QRS complexes [16].
R. Sivakumar et al, proposed a paper wherein Empirical Mode Decomposition method was used for adaptively representing non-stationary signals as sums of zero mean AMFM components. Detection of the QRS Complex was done using EMD and Haar Wavelet transform and it was seen that Haar wavelet transform performs better than other methods. The notch filter applied directly to the non-stationary signal like ECG showed more ringing effect [39].
IJIRMPS1806007
Website :
www.ijirmps.org
Email : [email protected]
46
Afseen Naaz et al proposed work deals with the extraction of QRS complex using wavelet decomposition. Noisy ECG signal was first pre-processed to remove the power-line and base line wandering line. ST segmentation was also performed to see whether the ECG pattern belong to the Heart attack patients or not [37].In a paper proposed by Vandana Verma et al, three methods for detecting QRS Complex were performed. One being the Adaptive Threshold where QRS Complex was detected using the Pan Tompkins Algorithm. Another procedure used was the Dynamic Quantized Threshold. In this method Butterworth filter with pass band of 1-13 Hz was used to remove all frequencies which were not necessary to detect the region of QRS complex. The mean was subtracted from the signal for base line wandering removal. By Squaring the signal four components were detected by gradient and moving average integrator. The desired final QRS feature was finally derived by retaining the amplitude values of G4 exceeding dynamic threshold THR1 rather than of 5% of the maximum peak amplitude and reducing the remaining to zero. The third method was based on the de-noised by wavelet and QRS complex were found using threshold and window [21].
Tanushree Sharma et al, proposed a paper where QRS Complex was detected using the synchrosqueezed wavelet transform (SSWT) which consisted of synchrosqueezing to the continuous wavelet transform. Nonlinear Mapping technique was applied to detect the R peaks [36].
A. Peterkova et al, worked on a paper that dealt with processing raw ECG data and QRS Complex detection. The detection of the QRS Complex was done by using QRS online detector that used the state-machine logic to determine the different peaks in an ECG based on averaging and adaptive thresholds that were fluctuating in respect to the noise and the signal [4].
Sameer K. Salih et al, devoted a paper in detecting QRS complexes and evaluating related R-R intervals of ECG signals using PNDM. It recognized QRS complexes based on the deflection occurred between R & S waves as a large positive and negative interval with respect to other ECG signal waves. The proposed detection method followed new fast direct algorithm applied to the entire ECG record itself without additional transformation like discrete wavelet transform (DWT) or any filtering sequence [26]. Yan sun et al, proposed a paper detection of the characteristic waves including QRS Complex were done using a multiscale morphological derivative (MMD) transform based singularity detector by substituting the conventional derivative [42].
VI.METHODOLOGY TO DETERMINE QRS COMPLEX (a) Collection of the ECG Database
Initially ECG signals were collected from variety of databases like the MIT-BIH (The Massachusetts Institute of Technology– Beth Israel Hospital Arrhythmia Database), AHA (The American Heart Association ECG Database), ESC (The European Society of Cardiology ST-T Database) and UCI (Machine Learning Repository). The database consisted of several different ECG format waveforms like .mat, .csv, .xml, .dat or .txt. The collections of databases were done from the database banks, ECG Simulators, ECG Machines along with an ECG Amplifier in practical laboratories and Electrocardiographs from the hospitals and the preferred configuration for the ECG database was Lead-II Configuration.
(b) Initialization of the ECG Signal
To process an ECG signal, we first need to read and plot the signal. Our Project has been implemented using the multipurpose tool i.e. the MATLAB Environment. If the signal is raw, which usually is unless it’s taken from a filtered database, we need to perform initialization and remove the base and gain by using the following formula:
𝑿𝒊 =𝑿𝒊−𝑩𝒂𝒔𝒆
𝑮𝒂𝒊𝒏 (1)
Where Xi= ECG Sample Base= Baseline Value Gain= Gain Factor
Once done, we can proceed to reading and plotting of the signal on Matlab. Depending upon the various formats, some signals could be plotted directly (.mat) and some required conversion from one format to the required format ((.csv, .xml, .dat or .txt) to .mat) by choosing the appropriate frequency and threshold along with re-dimensioning of the variable matrix.
(c) Preprocessing Phase
In the preprocessing stage, the noise is removed or suppressed using specific filters in order to extract the required information from the signal and for noise reduction.
This could be done either by performing Amplitude Normalization where in each sample of signal is divided from max of absolute value of signal in order to limit signal dynamic range from -1 to 1, i.e.
𝑽𝒂𝒓𝒊𝒂𝒃𝒍𝒆 = 𝒙𝒊
𝒎𝒂𝒙(|𝒙|) (2)
Where xi= ECG Sample at a point x= ECG Sample
The .mat format signal could be directly plotted in Matlab using a specific command. Considering the .csv and .dat format signals, Conversion and Zero Phase Filtering were done in order to plot it. In case of the .xml format signal, the same procedure was carried out in order to plot the signal which represented all the 12 Lead Configurations followed by extracting the required signal configuration needed to work on (Lead-II).
(d) Feature Extraction of the QRS Complex
IJIRMPS1806007
Website :
www.ijirmps.org
Email : [email protected]
47
Morphological Features Dynamic Features
Morphological Features would mean determining the size, shape and structure of the ECG signal including the fiducial points like the peak points, onset and offset (wave boundaries), segments and interval durations.
Dynamic features would mean extracting RR interval, PP interval features, Heart rate, HRV and the R/P ratio.
In this paper, what we present to propose is to extract and analyze the QRS Complex duration along with the Q, R and S peaks and their amplitudes and locations, R-R Interval and Heart Rate in order to evaluate an ECG properly.
i. So in order to begin with this we first identified the QRS Complex which would help us identify the R peak using the Pan Tompkins Algorithm.
ii. R peak detection is a good start for the identification procedure as it is the sharpest component with respect to all the other peaks in a Normal Lead-II ECG Signal and is easier to detect.
iii. In the Pan Tompkins Algorithm, ECG was first filtered using a Band Pass Filter.
iv. This was followed by differentiating the signal in order to get the slope information of the QRS Complex.
v. This was then followed by squaring the signal which made the entire signal values positive and amplifies the output of the derivative process nonlinearly. It also emphasizes the higher frequencies in the signal that are mainly due to the QRS Complex.
𝒚(𝒏𝑻) = [𝒙(𝒏𝑻)]𝟐 (3)
vi. This was concluded with the moving window average integration which was done to obtain the waveform feature information.
vii. After moving window integration, thresholding of the obtained signal was done. If a peak exceeded the threshold during the first step of analysis, it was classified as a QRS peak (Complex).
viii. The next step was to detect the Q peak by finding out the first local minimum from the left of the positive R wave and the onset of the Q peak; and the onset and offset of the Q peak; Qon and Qoff, using the same thresholding technique.
ix. The next step was to detect the S peak by finding out the first local minimum from the right of the positive R wave and the onset and offset of the S peak; Son and Soff, using the same thresholding technique.
x. Later, the QRS Complex duration was calculated using the equation;
𝑸𝑹𝑺𝑪𝒐𝒎𝒑𝒍𝒆𝒙𝑫𝒖𝒓𝒂𝒕𝒊𝒐𝒏 = 𝑺𝒐𝒇𝒇 − 𝑸𝒐𝒏 (4)
xi. This was then followed by calculating the R-R Interval using the R-Spike Detection Method which is basically calculating the interval between one R-Spike and the next R-Spike (successive R’s).
xii. This was then used to calculate the heart rate which could be defined as how fast the person’s heart could beat in a minute. Initially the mean value of the R-R Interval is calculated and then this duration is then divided into 60. The resulting equation would be:
𝑹𝒂𝒕𝒆 = 𝟔𝟎
𝑹−𝑹𝑰𝒏𝒕𝒆𝒓𝒗𝒂𝒍(𝑨𝒗𝒈) (5)
VII.RESULTS
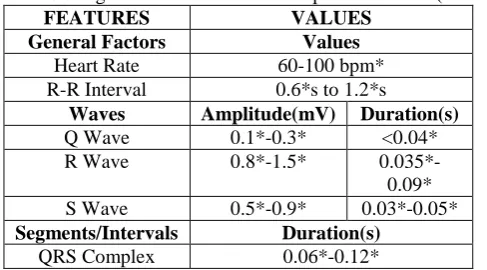
The table displayed below gives the value of the average of more than 80 samples taken and analyzed in Matlab and that could be considered as Normal ECG, based on the characteristics observed.
Table 2: ECG Signal Features and their Respective Values (Normal)
FEATURES VALUES
General Factors Values Heart Rate 60-100 bpm* R-R Interval 0.6*s to 1.2*s
Waves Amplitude(mV) Duration(s) Q Wave 0.1*-0.3* <0.04* R Wave 0.8*-1.5* 0.035*-0.09* S Wave 0.5*-0.9* 0.03*-0.05* Segments/Intervals Duration(s)
QRS Complex 0.06*-0.12*
*These obtained values in the table are calculated manually as well as using specific algorithms through computer processing in Matlab by analyzing more than 80 samples and is verified by doing a lot of literature review and is approved by the doctors.
The entered values in the table above are the average values of more than 80 samples after processing.
IJIRMPS1806007
Website :
www.ijirmps.org
Email : [email protected]
48
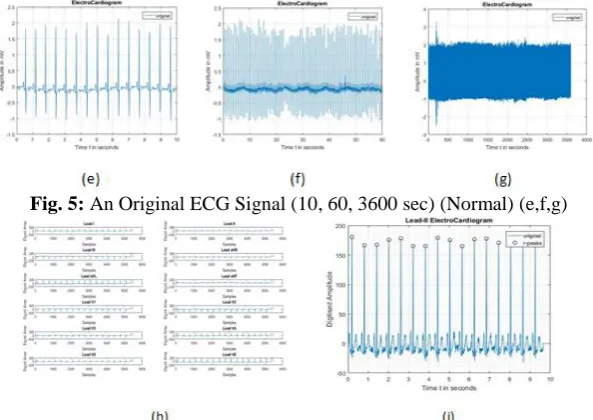
Fig. 5: An Original ECG Signal (10, 60, 3600 sec) (Normal) (e,f,g)Fig. 6: Plotting of 12 Lead Configuration ECG Signal from the .xml format to .mat signal and A Lead-II ECG Configuration extracted from 12 Lead Configuration ECG signal (h and i)
Fig. 7: Zero Phase Filtering of Extracted Lead-II ECG Signal to (.mat) from (.xml) (j), Zero Phase Filtering of Extracted Lead-II ECG Signal to (.mat) from (.csv) (k) and Detection of R Peak (l)
Fig. 8: Differentiating the Signal (m), Squaring the Signal (n) and Averaging the Signal (Moving Window Integration) (o)
IJIRMPS1806007
Website :
www.ijirmps.org
Email : [email protected]
49
Fig. 10: Detection of Q Peak, Detection of S Peak, Evaluating the R-R interval and the Heart Rate (s, t, u resp)Fig. 11: Calculating the QRS Duration (v) and the Area under the QRS Complex (w), ECG in Normal Sinus Rhythm (x)
An additional amount of calculation and analysis was also done to find out the Area under the QRS Complex in order to find out the work done by the heart which was later considered as not so mandatory point in our proposed thesis.
The average estimated area under the QRS Complex was found to be 4.24 mVps as per Figure 11 (w).
Processing 10 such similar signals later, it was seen that these signal tracings followed the particular sequence, a P wave with a round shape followed by a regular QRS Complex followed by T wave. Also signal in Figure 11 (x) maintains a heart rate within 60 to 100 BPM at rest along with the specific values of the features as obtained in the table. After a lot of literature review and processing, it could be learnt that the following traits correlate to a normal sinus rhythm criteria and therefore, it could be said that the subject could be in Normal Sinus Rhythm.
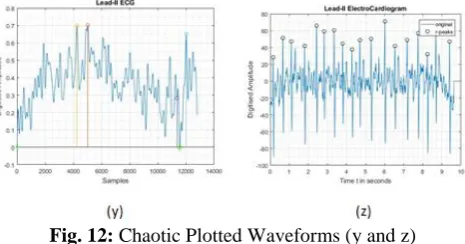
Fig. 12: Chaotic Plotted Waveforms (y and z)
After processing 10 such similar signals, it could be seen that this signal lacks the necessary sequence and therefore, could be stated that this subject does not have a Regular Rhythm and the Waves, Segments and Intervals are either absent or immeasurable, QRS Complex being difficult to locate. The Rates observed in Figure 12 (y and z) are above 100 BPM. This represents an Abnormal ECG Signal.
VIII.CONCLUSION
An algorithm for detection of the QRS Complex and its duration is proposed in this paper and was found useful for classification, evaluation, identification performance and diagnosis authentication.
Biomedical signals are non-stationary signals whose analyses require better time and frequency resolution. Such analysis include de-noising, filtering, normalizing, squaring, averaging, encoding, decoding, compressing, decompressing, deinterleaving, constructing, reconstructing and comparing of the data.
The results obtained from our project cannot be immediately applied to the population. Many of our subjects suffered from a combination of heart defects. Classification and Detection of the heart defects using Lead-II configuration with respect to QRS Complex and duration would require many more samples.
IX.ACKNOWLEDGMENT
IJIRMPS1806007
Website :
www.ijirmps.org
Email : [email protected]
50
REFERENCES[1] Mr. Vyankatesh S. Thorat, Dr. Suresh D. Shirbahadurkar, Mrs. Vaishali V. Thorat, “Study and Literature Survey for Classification of Cardiac Arrhythmia With Respect to ECG and HRV Signal”, International Journal of Advanced Research in Computer and Communication Engineering, Vol. 5, Issue 4, April 2016.
[2] V S Waydande, Prof. A N Jadhav, “A Cardiac Telemonitoring System”, IOSR Journal of Electronics and Communication Engineering, PP: 01-04.
[3] Preeti Raman, DR SM Ghosh, “Classification of Heart Diseases based on ECG analysis Using FCM And SVM Methods”, International Journal of Engineering Science and Computing, 2016.
[4] A.Peterkova, M. Stremy, “The raw ECG signal processing and the detection of QRS complex”, IEEE European Modelling Symposium, 2015 IEEE.
[5] Vandana Verma, Sagar Singh Rathore, “Detection of Characteristic Points of ECG Signal”, International Journal of Innovative Research in Computer and Communication Engineering, Vol. 3, Issue 11, November 2015.
[6] Er. J.S Dhir, Er. N.K. Panag, “ECG Analysis and R Peak Detection Using Filters and Wavelet Transform”, International Journal of Innovative Research in Computer and Communication Engineering, An ISO 3297: 2007 Certified Organization, Vol. 2, Issue 2, February 2014, ISSN: 2320-9801.
[7] Mr. Vyankatesh S. Thorat, Dr. Suresh D. Shirbahadurkar, Mrs. Vaishali V. Thorat, “Study and Literature Survey for Classification of Cardiac Arrhythmia With Respect to ECG and HRV Signal”, International Journal of Advanced Research in Computer and Communication Engineering, Vol. 5, Issue 4, April 2016.
[8] Preeti Raman, DR SM Ghosh, “Classification of Heart Diseases based on ECG analysis Using FCM And SVM Methods”, International Journal of Engineering Science and Computing, 2016.
[9] Sandeep Sharma (Scholar), Prof. Vikas Mittal, Prof. Yuvraj Sharma, “Detection of ECG points using Principal component analysis”, International Association of Scientific Innovation and Research in Association with International Journal of Emerging Technologies in Computational and Applied Sciences, 13-190.
[10] Anand Kumar Joshi, Arun Tomar, Mangesh Tomar, “A Review Paper on Analysis of Electrocardiograph (ECG) Signal for the Detection of Arrhythmia Abnormalities”, International Journal of Advanced Research in Electrical, Electronics and Instrumentation Engineering, Vol. 3, Issue 10, October 2014.
[11] Namitha Thomas, D.J.Jagannath, “DETECTION OF PEAK AND BOUNDARIES OF P AND T WAVES IN ECG SIGNALS”, International Journal of Electronics Signals and Systems, Vol-3, Iss-1, 2013.
[12] Nishant Saxena, Kshitij Shinghal, “A NEW APPROACH FOR THE PATTERN RECOGNITION AND CLASSIFICATION OF ECG SIGNAL”, International Journal of Advances in Engineering & Technology, Aug., 2016.
[13] Afseen Naaz, Mrs Shikha Singh, “QRS Complex Detection and ST Segmentation of ECG Signal Using Wavelet Transform”, International Journal of Research in Advent Technology, Vol.3, No.6, June 2015.
[14] Namitha Thomas, D.J.Jagannath, “DETECTION OF PEAK AND BOUNDARIES OF P AND T WAVES IN ECG SIGNALS”, International Journal of Electronics Signals and Systems, Vol-3, Iss-1, 2013.
[15] Sonal Pokharkar, Amit Kulkarni , “ECG Real Time Feature Extraction Using MATLAB”, International Journal of Technology and Science, Volume V, Issue 1, 2015 pp. 1-4.
[16] Jiapu Pan, Willis J. Tompkins, Senior Member, “A Real-Time QRS Detection Algorithm”, IEEE TRANSACTIONS ON BIOMEDICAL ENGINEERING, Vol. BME32, No. 3, March 1985.
[17] A Khorovets, “What Is An Electrocardiogram (ECG)?”, The Internet Journal of Advanced Nursing Practice Volume 4 Number 2, 1999.
[18] A.Muthuchudar, Lt.Dr.S.Santosh Baboo, “A Study of the Processes Involved in ECG Signal Analysis”, International Journal of Scientific and Research Publications, Volume 3, Issue 3, March 2013.
[19] Shital L. Pingale, “USING PAN TOMPKINS METHOD, ECG SIGNAL PROCESSING AND DIGNOSE VARIOUS DISEASES IN MATLAB”, Proceedings of IRF International Conference, 13th April-2014, Pune, India.
[20] Nitish V. Thakor, Senior Member, IEEE, Yi-Sheng Zhu, Senior Momher, IEEE, “Applications of Adaptive Filtering to ECG Analysis : Noise Cancellation and Arrhythmia Detection”, IEEE TRANSACTIONS ON BIOMEDICAL ENGINEERING. Vol. 18. NO 8. AUGUST I99I.
[21] Vandana Verma, Sagar Singh Rathore, “COMPARATIVE STUDY OF QRS COMPLEX DETECTION BY THRESHOLD TECHNIQUE”, International Journal of Advances in Engineering Technology, Oct., 2015, IJAET, ISSN: 22311963. [22] Prema T. Akkasaligar, Usharani Math, “REVIEW OF ANALYSIS OF ECG IMAGE”, International Journal of Engineering Applied Sciences and Technology, 2016 Vol. 1, Issue 10.
[23] Kritika Bawa, Pooja Sabherwal, “R-Peak Detection by Modified Pan-Tompkins Algorithm”, International Journal of Advancements in Research & Technology, Volume 3, Issue 5, May-2014.
[24] R. G. Mark, G. B. Moody, W. H. Olson, S. K. Peterson, P. S. Schulter, and J. B. Walters, Jr., “Real-time ambulatory arrhythmia analysis with a microcomputer,” Comput. Cardiol., pp. 5762, 1979.
[25] Ms. P. G. Patel, Prof. J. S. Warrier, Prof. U. R. Bagal, “ECG Analysis And Detection Of Arrhythmia Using MATLAB”, Vol 1, Issue 11, December, 2012.
[26] Sameer K. Salih, S.A. Aljunid, Abid Yahya, Khalid Ghailan, “A Novel Approach for Detecting QRS Complex of ECG signal”, International Journal of Computer Science issues, Vol.9, Issue 6, No 3, November 2012.
IJIRMPS1806007
Website :
www.ijirmps.org
Email : [email protected]
51
[28] V S Waydande, Prof. A N Jadhav, “A Cardiac Telemonitoring System”, IOSR Journal of Electronics and Communication Engineering, PP: 01-04.[29] Patrick S. Hamilton and Willis J.Tompkins, “Quantitative Investigation of QRS Detection Rules Using the MIT-BIH Arrhythmia Database”, IEEE TRANSACTION ON BIOMEDICAL ENGINEERING, Vol.BME-33, No.12, DECEMBER 1988. [30] Durgesh Kumar Ojha, Monica Subashini, “Analysis of Electrocardiograph (ECG) Signal for the Detection of Abnormalities Using MATLAB”, World Academy of Science, Engineering and Technology International Journal of Medical, Health, Biomedical, Bioengineering and Pharmaceutical Engineering Vol.8, No: 2, 2014.
[31] Anand Kumar Joshi, Arun Tomar, Mangesh Tomar, “A Review Paper on Analysis of Electrocardiograph (ECG) Signal for the Detection of Arrhythmia Abnormalities”, International Journal of Advanced Research in Electrical, Electronics and Instrumentation Engineering, Vol. 3, Issue 10, October 2014.
[32] N P. Joshi, Shweta A.Tambe, P.S. Topannavar, “Morphological & Dynamic Feature Based Heartbeat Classification”, International Journal of Engineering Research and General Science Volume 2, Issue 3, April-May 2014.
[33] J. Parak, J. Havlik, “ECG SIGNAL PROCESSING AND HEART RATE FREQUENCY DETECTION METHODS”, Department of Circuit Theory, Faculty of Electrical Engineering Czech Technical University in Prague.
[34] Joseph J. Carr, John M. Brown, “Introduction to Biomedical Equipment Technology”, Pearson Education Fourth Edition. [35] ECG processing R-peaks detection, Medical digital signal processing (DSP) software development.
[36] Tanushree Sharma, Kamalesh K. Sharma, “QRS Complex Detection in ECG Signals Using the Synchrosqueezed Wavelet Transform”, IETE Journal Of Research, 2016, Vol.62, No. 6, 885-892.
[37] Afseen Naaz, Mrs Shikha Singh, “QRS Complex Detection and ST Segmentation of ECG Signal Using Wavelet Transform”, International Journal of Research in Advent Technology, Vol.3, No.6, June 2015.
[38] Yan Sun, Kap Luk Chan and Shankar Muthu Krishnan, “Characteristic wave detection in ECG signal using morphological transform”, BMC Cardiovascular Disorders, 20 September 2005.
[39] R.SIVAKUMAR, R.TAMILSELVI, S.ABINAYA, “Noise Analysis & QRS Detection in ECG Signals”, 2012 International Conference on Computer Technology and Science, Vol. 47, 2012.
[40] Mahalakshmi Ponnusamy, Sundararajan M, “Detecting and classifying ECG abnormalities using a multi model methods”, Biomedical Research 2017.
[41] Dean OBrien , INVESTIGATION OF PEAK DETECTION METHODOLOGIES FOR ECG SIGNALS, School of Engineering Information Technology Faculty of Engineering, Health, Science and the Environment Charles Darwin University Darwin.
[42] Yan Sun, Kap Luk Chan and Shankar Muthu Krishnan, “Characteristic wave detection in ECG signal using morphological transform”, BMC Cardiovascular Disorders, 20 September 2005.
[43] ElectroCardioGraphy-ECG made extra easy. [44] Advanced ECG Interpretation.
[45] JOHN P. DIMARCO, M.D., PH.D. ,Cardiac Electrophysiology : A Cost-Effective Approach. [46] The Normal ECG and its (Normal) Variants.
[47] ECG Primer.
[48] ECG Monitor, Project Id H3290. [49] USB TAP Probe User Guide.
[50] Signal Processing Toolbox, For Use with MATLAB, Users Guide Version 5.
[51] INTRODUCTORY GUIDE TO IDENTIFYING ECG IRREGULARITIES, DailyCare BioMedical Inc. [52] www.ecgsim.org
[53] www.lifeinthefastlane.com [54] www.ecg.utah.edu [55] www.nurseslearning.com [56] www.everydayhealth.com [57] www.thesurvivaldoctor.com [58] www.patientcareonline.com [59] www.healio.com
[60] www.medscape.com [61] www.my-ekg.com [62] www.ecgpedia.com [63] www.researchgate.net [64] www.cardionetics.com [65] in.mathworks.com