R E S E A R C H
Open Access
Mixing modes in a population-based
interview survey: comparison of a
sequential and a concurrent mixed-mode
design for public health research
Elvira Mauz
1,3*, Elena von der Lippe
1, Jennifer Allen
1, Ralph Schilling
2, Stephan Müters
1, Jens Hoebel
1,
Patrick Schmich
1, Matthias Wetzstein
1, Panagiotis Kamtsiuris
1and Cornelia Lange
1Abstract
Background:Population-based surveys currently face the problem of decreasing response rates. Mixed-mode designs are now being implemented more often to account for this, to improve sample composition and to reduce overall costs. This study examines whether a concurrent or sequential mixed-mode design achieves better results on a number of indicators of survey quality.
Methods:Data were obtained from a population-based health interview survey of adults in Germany that was conducted as a methodological pilot study as part of the German Health Update (GEDA). Participants were randomly allocated to one of two surveys; each of the surveys had a different design. In the concurrent mixed-mode design (n= 617) two types of self-administered questionnaires (SAQ-Web and SAQ-Paper) and computer-assisted telephone interviewing were offered simultaneously to the respondents along with the invitation to participate. In the sequential mixed-mode design (n= 561), SAQ-Web was initially provided, followed by SAQ-Paper, with an option for a telephone interview being sent out together with the reminders at a later date. Finally, this study compared the response rates, sample composition, health indicators, item non-response, the scope of fieldwork and the costs of both designs. Results:No systematic differences were identified between the two mixed-mode designs in terms of response rates, the socio-demographic characteristics of the achieved samples, or the prevalence rates of the health indicators under study. The sequential design gained a higher rate of online respondents. Very few telephone interviews were conducted for either design. With regard to data quality, the sequential design (which had more online respondents) showed less item non-response. There were minor differences between the designs in terms of their costs. Postage and printing costs were lower in the concurrent design, but labour costs were lower in the sequential design. No differences in health indicators were found between the two designs. Modelling these results for higher response rates and larger net sample sizes indicated that the sequential design was more cost and time-effective.
Conclusions:This study contributes to the research available on implementing mixed-mode designs as part of public health surveys. Our findings show that SAQ-Paper and SAQ-Web questionnaires can be combined effectively. Sequential mixed-mode designs with higher rates of online respondents may be of greater benefit to studies with larger net sample sizes than concurrent mixed-mode designs.
Keywords:Population health monitoring, Health interview surveys, Mixed-mode designs, Self-administered questionnaires, Sequential mixed-mode design, Concurrent mixed-mode design
* Correspondence:[email protected] 1
Department of Epidemiology and Health Monitoring, Robert Koch Institute, Berlin, Germany
3FG 23 Monitoring Studies and Survey Methods, Robert Koch Institute, P.O. Box 650261, G-13302 Berlin, Germany
Full list of author information is available at the end of the article
Background
Empirical research in public health is frequently based on data derived from population-based health interview surveys (HIS), in which participants are questioned about health issues by an interviewer or fill out self-administered questionnaires. Population-based health surveys can be used to observe prevalence rates for dis-eases, aspects of medical care and the consequences of diseases as well as the psychological, behavioural and so-cial determinants of health across different population groups. When planning population-based (health) sur-veys, different aspects of survey design have to be taken into account and this includes sampling procedures and data collection methods. Surveys need to be designed in a manner that minimizes total survey error [1, 2] and that enables them to be undertaken within an acceptable length of time on limited financial budgets. Survey er-rors can result from various aspects: low sample sizes can lead to inaccurate estimates (sampling error); errors in the sampling procedure may mean that the sample no longer properly reflects the target population (coverage error); a study may be affected by systematic non-response (non-non-response bias); or systematic errors may have occurred during measurement of the parameters under study (measurement bias). Importantly, the de-creasing response rates facing many kinds of survey since the 1990s [3–5] leads to a higher probability of systematic errors such as selection bias, i.e. a certain population group can be underrepresented in an achieved sample due to a particular low response to the survey in this group. In turn, this situation makes it more difficult to gain suffi-cient sample sizes that are representative of the target population and to do so within the limited financial re-sources available to the study.
The German Health Update (GEDA) is an example of one such population-based HIS [6]. The study is under-taken as a part of the German Health Monitoring System [7], which is administered by the Robert Koch Institute (RKI) in Berlin. Between 2008 and 2013, three waves of the GEDA study were carried out as computer-assisted telephone interview surveys (CATI) with a random telephone sample that excluded mobile phone numbers. Several problems such as declining re-sponse rates, growing selection and coverage bias as well as increasing costs led to the decision to change the study design in a number of ways. On the one hand, a register-based sample was employed as part of a mixed-mode design instead of a random selection of telephone numbers. Moreover, expensive telephone-based interviews were replaced as part of the GEDA study with self-administered paper-based question-naires (SAQ-Paper) and self-administered online ques-tionnaires (SAQ-Web) [8]. The findings presented here are the result of the research conducted to find the
most appropriate way of implementing this mixed-mode design.
Mixed-mode designs are increasingly employed in social and public health research [9, 10]. They offer a combination of survey methods, and this is said to pro-vide a balance between the benefits and drawbacks asso-ciated with the choice of a more traditional survey design [5, 11–14]. Research has shown that mixed-mode designs can reduce costs, improve data quality, and can lead to higher response rates as well as a better sam-ple composition [9, 10, 15–22]. However, whether the benefits of a mixed-mode design can be reaped largely depends on the choice of the mixed survey methods, the way in which they are combined and the single modes with which they are compared. Nevertheless, the offer of a choice between survey modes [23–25] can increase the study’s acceptance [11] and the motivation to participate among certain population groups [9, 21, 26]. With re-gard to total survey error, the possible benefits of a mixed-mode design need to be compared with the po-tential for errors that can occur due to the particular combination of survey modes. This primarily involves systematic measuring errors that can occur due to the way that mode effects lead questions to be answered dif-ferently [5, 9]. The effects of social desirability, which can be caused by the presence of an interviewer, or those related to response scales depending on whether they are presented visually or audibly, are particularly import-ant [e.g. 3, 9, 10, 26]. As a whole, when modes differ at the two levels (e.g. interviewer and oral versus self-administered and visual), the responses varies more than when modes differ only at one level [5].
The offer of both SAQ-Paper and SAQ-Web provides an attractive combination of methods that also takes total survey error into account. These methods generate comparable results [27, 28] because they share a number of characteristics: both are conducted without the pres-ence of an interviewer, and both use visual presentation. This has also been found among adults in Germany, as we have reported in a previous article based on data from a methodological pilot study conducted within the programme of the above-mentioned GEDA study [29]. The findings indicate that mixing self-administered modes, such as SAQ-Paper and SAQ-Web, may be a combination to minimize mode differences in mixed-mode health interview surveys.
population-based studies is only recommended as part of a mixed-mode design [33]; therefore, online question-naires need to be used together with another mode that is linked to higher response rates and better sample coverage such as SAQ-Paper [12].
Alongside the choice of a combination of methods, the way in which survey modes are presented to re-spondents is also of paramount importance. In concur-rent mixed-mode designs, respondents are offered a choice of different possibilities for participation simul-taneously. In a sequential mixed-mode design, the dif-ferent modes are offered one after the other. Respondents are initially invited to participate through one mode, whereas during one or more additional con-tacts, non-respondents are invited to participate through additional survey modes. In sequential designs, the least expensive mode is usually offered first in order to reduce overall survey costs [11, 14, 24, 31]. Direct empirical comparisons of sequential and concurrent mixed-mode designs are quite rare. Most methodo-logical studies of mixed-mode survey designs compare survey quality indicators such as response rates be-tween concurrent or sequential mixed-mode designs and a single-mode design. Sequential mixed-mode de-signs are presumed to be more effective in terms of re-sponse rates than concurrent mixed-mode designs; this may be because concurrent designs place an additional burden on respondents to choose their preferred mode of participation [36]. This problem is known as the ‘paradox of choice’effect [37] and it refers to the over-load caused by the pressure to decide between one of many available options. In the survey context, this problem can result in non-participation. In line with the lower response rates expected with online surveys, concurrent [38] and sequential [34] mixed-mode de-signs implementing SAQ-Paper provide improved re-sponse rates compared to single-mode SAQ-Web surveys [31, 34]. However, other studies report a de-creased response rate compared to a single-mode SAQ-Paper design in cases where online questionnaires were provided as a concurrent option [15, 23, 36, 39–41] and in a sequential design that began by offering an online questionnaire [42]. One study compared two sequential mixed-mode designs; one offered SAQ-Web followed by SAQ-Paper, the second provided SAQ-Paper before SAQ-Web. SAQ-Web led to the lowest response rates in both survey designs; however, higher online partici-pation was gained in the study that offered SAQ-Web first [31]. Summing up the results of these compari-sons, survey quality indicators such as response rates or sample composition differ depending on the mode used in the case of a single mode, and the mix of modes that is adopted (the modes themselves, and, in sequential designs, the order in which the modes are offered).
Only a small number of studies have compared con-current and sequential mixed-mode designs directly with one another with regard to survey quality indicators such as overall response rates, representativeness and costs, and conclude which one is ‘better’. Millar and Dillman (2011) conducted two experiments investigating how response rates can be improved through the web when mixed-mode designs are employed [24]. They sur-veyed an internet-savvy population of undergraduate students with internet access, and found that a concur-rent design did not outperform a paper-only option. When offering these modes as part of a sequential de-sign, with the web option offered first followed by a pos-tal option, the overall response rate was equivalent to using SAQ-Paper only, but did increase the number of web-based responses.
Another study compared different kinds of concurrent and sequential designs [43]. It included several designs aimed at finding the best way of integrating online ques-tionnaires into the American Community Survey. The results showed that offering a choice between internet and postal questionnaires as part of a concurrent mixed-mode design achieved response rates similar to those of a mail-only strategy with no decrease caused by the on-line option. This occurred no matter how prominently the choice of options was advertised (in other words, whether the web option was presented on all documents or merely on the paper-and-pencil questionnaire). When offering the two modes as part of a sequential design with the web option offered first, followed by paper questionnaires, only a ‘push accelerated strategy’with a 2-week interval between the two modes obtained a higher response rate than a mail-only strategy. Adding another week before sending out a reminder together with the other mode achieved the lowest response rate of all [43].
No differences between the two mixed-mode designs were found in a methodological mixed-mode experiment conducted as part of round four of the European Social Survey in the Netherlands. Two randomly divided sam-ples (a sequential mixed-mode design with a web option first, followed by a telephone interview option, followed by a face-to-face interview within a concurrent mixed-mode design) found almost identical response rates with a few more web interviews gained through the sequen-tial design [5].
empirical comparisons between concurrent and sequen-tial mixed-mode designs, we conducted the methodo-logical GEDA 2.0 pilot study described in this paper to provide an indication of which of two particular mixed-mode designs would be the most appropriate for the fu-ture GEDA study and employed different survey quality indicators to do so.
Methods
Aims and research questions
In addition to testing the practical implementation of a mixed-mode design for the new GEDA wave and testing various methodological concepts and instruments, we conducted a methodological pilot study (GEDA 2.0) that tested the use of concurrent versus sequential mixed-mode designs as part of a health interview survey of adults. Both designs offered two kinds of self-administered questionnaires (SAQ-Web and SAQ-Paper) as well as computer-assisted telephone interview-ing (CATI). The aim was to determine whether one of these mixed-mode designs outperformed the other on different survey quality indicators. The study was ap-proved by the German Federal Commissioner for Data Protection and Freedom of Information and informed consent was obtained from all participants. Participants were informed about the goals and contents of the study, about privacy and data protection, and that their partici-pation in the study was voluntary.
The study focused on a comparison of concurrent and sequential mixed-mode survey designs and considered five questions:
Does a concurrent and sequential mixed-mode design that uses three modes (SAQ-Paper, SAQ-Web and CATI) lead to different response rates?
What are the socio-demographic characteristics of the achieved samples from the concurrent and sequential mixed-mode designs, and do they differ? Are there differences between the two designs with
respect to basic health indicators? Do the two designs differ in terms of item
non-response?
What are the costs of each study design, and is it possible to identify a more economical mixed-mode design?
Study design and fieldwork
The study design was chosen so that a sequential mixed-mode design comprising SAQ-Web, SAQ-Paper, and CATI could be compared with a concurrent mixed-mode design that used an identical mixed-mode mixture. A telephone interview was offered in order to determine whether it would be an accepted mode as part of this new sampling strategy.
The study was based on a random sample of adults registered with the local resident registries of six munici-palities in Germany. The sample covered urban and rural locations as well as eastern and western regions. Participants were selected using a disproportionate stratified random sampling procedure that ensured an equal distribution of men and women, and an equal distribution of age groups (18–29 years, 30–44 years, 45–64 years, and 65–79 years). Local registry offices were asked to provide the name, address, year of birth, and sex of the people in the sample. Telephone numbers were unavailable as these are not recorded on German registers. The gross sample of 6720 partici-pants was randomly allocated to the two mixed-mode survey designs, stratified by region, sex and age. An equal distribution of these factors in each mixed-mode design was important for the analysis and com-parison of the two survey designs.
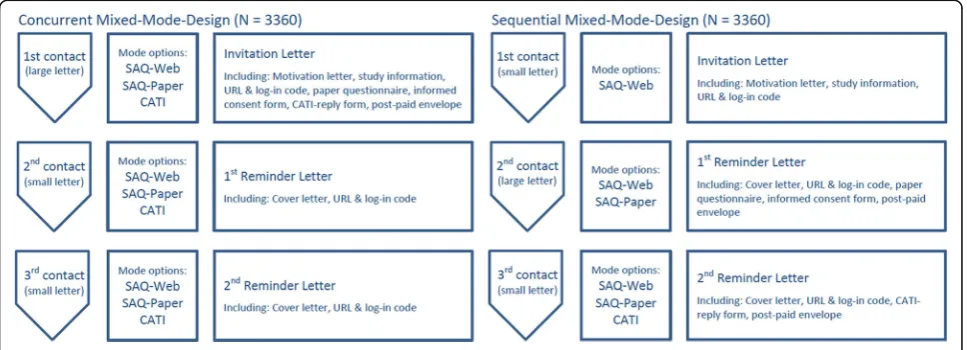
The procedure for contacting participants in the con-current mixed-mode design (Fig. 1) consisted of an invi-tation letter, information about the study and data privacy, the paper questionnaire, a consent form, and a user name and password to access the web option. Re-spondents were also able to participate through CATI, but had to provide their telephone number (either by phone, email or reply form). Three weeks after the first contact, a reminder was sent out to the non-respondents. User names and passwords were resent, but without a copy of the paper questionnaire. Three weeks later, non-respondents were contacted a third time with a further reminder. In the concurrent mixed-mode design, the reminder included the cover letter and the respondent’s user name; in the sequential mixed-mode design, a CATI reply form and a pre-paid enve-lope was also sent out as part of the second reminder.
Participants assigned to the sequential mixed-mode design received information about the study and a user name and password in their first contact letter (Fig. 1). Non-respondents received a paper version of the questionnaire 3 weeks later and were invited to partici-pate by completing the paper or web questionnaire. After three further weeks, a third letter was sent to non-respondents suggesting a telephone interview. In this case, respondents completed a form providing their telephone number and returned it to the Robert Koch Institute.
telephone directories had been used. Unlisted sub-scribers differ in certain socio-demographic characteris-tics: they are more likely to live in urban than rural areas, are younger and have a higher level of education [44]. Moreover, matching some sections of the sample with the public telephone directory would not have enabled any general conclusions to be drawn from the findings, since the sample would have been extremely biased. In addition, although it would have been possible to match addresses with commercial registers of telephone numbers, doing so would have been costly and fairly ineffective (it is associated with a 20% success rate).
The questionnaires used in the different modes were designed using a combination of unified-mode-design (to ensure that the questionnaires were almost identical)– this reduced mode-effects– and mode-specific-design so as to capitalize on the advantages provided by modes that lead to better data quality [17]. In all modes, standardized formulations and explanations were used. Telephone and online questionnaires were optimized using filter skips whenever this did not impair the understanding of a filter question. Plausibility checks and do-answer-checks were also integrated into the online questionnaires. The average response time for the online questionnaire was 26 min. The dropout rate among people who started the web questionnaire was just 2%. On average, the telephone interviews lasted 35 min.
Response rates
The response rates for each mixed-mode design were calculated according to the standards of the American Association for Public Opinion Research (AAPOR). The response rate was calculated as the share of interviews from the gross sample (AAPOR-Response Rate 1) [45]. Completed questionnaires were only considered valid if the respondents had signed an informed consent form
before participating in the study. This consent form had to be returned in a separate envelope. During the web questionnaire, participants were asked to tick a box indi-cating whether they had read and accepted the study’s data protection conditions. The overall response rate for both designs was 18.3%.
Sample composition
We performed a two-level comparison of the two sam-ples’various socio-demographic characteristics. The first step involved comparing the achieved net samples of each mixed-mode design with the original gross sample according to sex, age, region of residence, and the type of residential area. These characteristics were chosen as the distribution of these characteristics in the gross sam-ple was also known. The second step involved analysing the statistical differences between the two designs; we included current employment status, marital status, type of household, migration background, educational level [46] and income level (based on household net income and using income quintiles).
Health indicators and data quality
Minimum European Health Module [48]. Current de-pression was evaluated using the diagnostic algorithm set out in the eight-item Patient Health Questionnaire depression scale (PHQ-8) [49]. Current mental wellbeing was assessed using the five-item WHO Well-Being Index (WHO-5) [50]. Finally, perceived social support was measured using the three-item Oslo Social Support scale (OSS-3) [51]. In addition, data was collected on the fol-lowing forms of health-related behaviour: current smok-ing status, at-risk alcohol consumption (measured by AUDIT-C) [52], sporting activity in the last 3 months, and vaccination status.
The scope of fieldwork and cost analyses
We calculated the overall costs of the two mixed-mode designs based on postage, printing and data entry costs and time requirements. We also performed a modelling calculation that reproduced the real field conditions as-sociated with a population-based survey aimed at gain-ing a 20,000 net sample with a supposed response rate of 20% for a sequential mixed-mode design; the aim here was to obtain a better assessment of the cost-efficiency of the two designs. The cost analysis and the scope of fieldwork are described in the results.
Statistical analysis
To test for statistically significant differences, we calcu-lated response rates for different sample characteristics, crude (unadjusted) prevalence rates for health indicators, and prevalence rates of item non-response by survey-design. Pearson’s χ2-tests were used to test for statisti-cally significant differences (α = 0.05). No adjustments were made to significance levels, which could have helped control for multiple testing, as this ensured that the analysis remained sensitive to possible differences between the two designs. Statistical analyses were con-ducted using STATA 14.1 SE (StataCorp LP, College Station, TX).
Results
Response rates
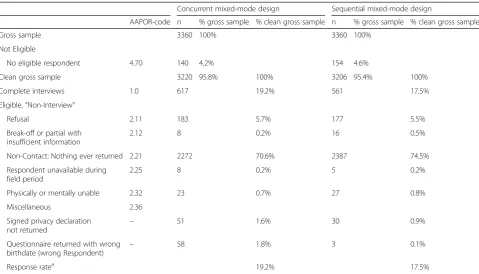
Table 1 shows the disposition codes (a code for the re-sult of the contact) and response rates for the two mixed-mode designs. From the total 1320 questionnaires that were returned (594 in the sequential design and 726 in the concurrent design), 61 were discarded because a respondent’s date of birth was inconsistent with that provided by the registry office. In addition, 81 interviews were not analysed as they were not accompanied by a signed informed consent form; all of these were paper questionnaires. In total, 1178 valid questionnaires were analysed: 561 were obtained from the sequential mixed-mode design and 617 stemmed from the concurrent mixed-mode design.
The response rate was 19.2% in the concurrent mixed-mode design compared with 17.5% in the sequential design. There was no statistically significant difference between these response rates (p= 0.085).
We also calculated response rates by age group (Table 2). The differences between the two designs were small and statistically insignificant.
Sample composition
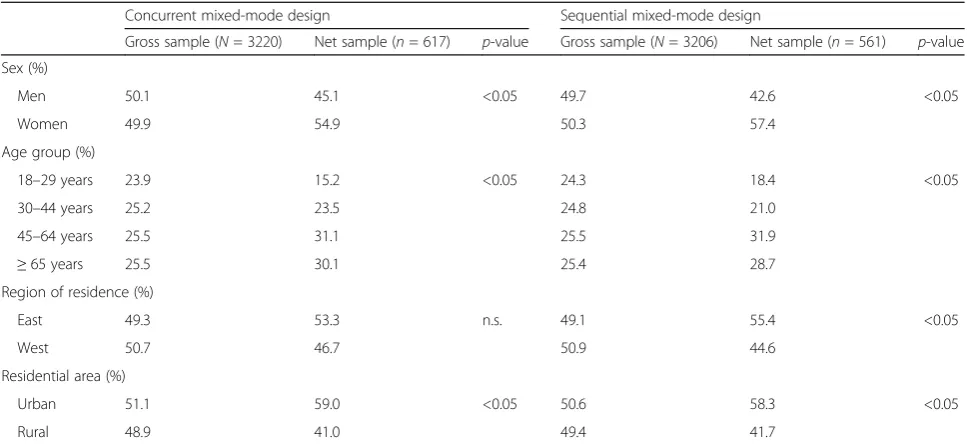
Table 3 presents the socio-demographic characteristics of the gross and net samples according to the type of mixed-mode design. The results show that women, older people, and people living in urban areas were signifi-cantly overrepresented in the net samples gained for both designs compared to the original gross sample. People living in eastern Germany were significantly over-represented in the net sample of the sequential mixed-mode design. However, when the two net samples were compared, no significant differences were found with re-gard to sex, age, region of residence and type of residen-tial area (p-values > 0.05).
Further comparisons could be made only for the achieved samples of the two mixed-mode designs as the required (self-reported) data was only collected using the questionnaires employed in the two surveys. The achieved samples for the mixed-mode designs showed no significant differences when compared by age, marital status, household type, educational level, income, em-ployment status or family history of migration (Table 4).
Health indicators and data quality
Given that mixed-mode designs are used in public health surveys, we aimed to determine whether con-current and sequential mixed-mode designs lead to significantly different results. The crude (unadjusted) prevalence rates for a number of essential health indica-tors are presented separately for each design in Fig. 2. A comparison of the mixed-mode designs found no statis-tically significant differences between any of the health indicators (p-values > 0.05).
Participation by mode and cost analysis
Before reporting a detailed description of the costs of each design, we first present the distribution of the sur-vey modes within the mixed-mode designs (Fig. 3) and the number of contacts needed to gain the specified number of returned questionnaires (Fig. 4). In the con-current mixed-mode design, about 20% of valid re-sponses (n= 124) were gained via SAQ-Web, compared with more than 50% of valid responses (n= 290) in the sequential design. In both designs, the CATI option was chosen by less than 2% of the participants who provided a valid response (concurrent: n = 11, sequential: n= 7) (Fig. 3). Therefore, offering a telephone interview as part of this sampling strategy proved to be ineffective.
There was a pronounced difference between the con-tacting waves for the two mixed-mode designs with re-gard to the way in which the respondents participated
(Fig. 4). This difference is likely to have been caused by the difference in modes that were offered: the highest re-sponse rate occurred when SAQ-Paper was offered to the respondents. More than half of the returned concur-rent design questionnaires (more than 85% of paper questionnaires) were received from the first wave of invi-tations. In the sequential design, the first contact only produced about one-third of the questionnaires (online questionnaires). The majority of questionnaires in the sequential design were returned after the second contact (after the paper version had been sent to the respon-dents). A high proportion of respondents returned paper questionnaires. In the concurrent design, where the sec-ond contact only included a reminder and the user name, another 30% answered; once again, a large pro-portion provided a paper questionnaire. The third con-tact letter was identical in both designs: it stated the URL and the user name for the online questionnaire. About 17% of the questionnaires in the concurrent and 31% in the sequential mixed-mode designs were ob-tained during the last few weeks of the study. After the third contact had been made, about two-thirds of re-spondents had already returned their paper question-naires for the concurrent and sequential designs.
The costs of the web questionnaire were comparably low, mainly because manual data entry was unnecessary. All data entered online were automatically saved in a database, meaning that the high costs incurred by data Table 1Disposition codes and response rates by survey design
Concurrent mixed-mode design Sequential mixed-mode design
AAPOR-code n % gross sample % clean gross sample n % gross sample % clean gross sample
Gross sample 3360 100% 3360 100%
Not Eligible
No eligible respondent 4.70 140 4.2% 154 4.6%
Clean gross sample 3220 95.8% 100% 3206 95.4% 100%
Complete interviews 1.0 617 19.2% 561 17.5%
Eligible,“Non-Interview”
Refusal 2.11 183 5.7% 177 5.5%
Break-off or partial with insufficient information
2.12 8 0.2% 16 0.5%
Non-Contact: Nothing ever returned 2.21 2272 70.6% 2387 74.5%
Respondent unavailable during field period
2.25 8 0.2% 5 0.2%
Physically or mentally unable 2.32 23 0.7% 27 0.8%
Miscellaneous 2.36
Signed privacy declaration not returned
– 51 1.6% 30 0.9%
Questionnaire returned with wrong birthdate (wrong Respondent) –
58 1.8% 3 0.1%
Response ratea 19.2% 17.5%
a
“Response rate 1”in accordance with the American Association for Public Opinion Research (2011).p= 0.085 (chi-square)
Table 2Response rates by survey design and age group
Concurrent mixed-mode design (n= 617) %
Sequential mixed-mode design (n= 561) %
p-value
18–29 years 12.2 13.2 n.s.
30–44 years 17.9 14.9 n.s.
45–64 years 23.4 21.9 n.s.
65–79 years 22.6 19.8 n.s.
Total 19.2 17.5 n.s.
entry were avoided. Excluding the infrastructure and overhead costs (e.g., server space, programming work etc.), which are similar to those incurred during the preparation of a paper questionnaire, the only time con-suming function undertaken for the fieldwork was data management. Data management involved managing the server and the questionnaires held in the database.
The cost of the paper questionnaires was significantly higher. Printing costs are a major expense that is simply not incurred by online questionnaires. In this survey, production costs amounted to about EUR 3 per (60-page) questionnaire. The second major expense was postage. The size and weight of the paper questionnaire (including the invitation letter) meant that mailing the concurrent option in all modes (see Fig. 1) was about three times more expensive than mailing the invitation letter containing information on how to take part via the web (URL, username and password). Mailing costs (in-cluding filling the envelopes) amounted to EUR 0.70 for a small envelope (invitation letter, online information) and EUR 2.20 for a large envelope (invitation letter and paper questionnaire). Further postal costs were incurred for each returned paper questionnaire. Moreover, as a means of encouraging respondents to return their ques-tionnaires, each mailing was supplied with a pre-addressed postage-paid envelope; this incurred EUR 2.20 in costs per returned envelope.
Another costly and time-consuming step involved manual data entry and the logistics of receiving and sort-ing questionnaires. The paper questionnaires used in this survey were designed and produced as machine-readable forms. As such, completed questionnaires that were
returned to the Robert Koch Institute were scanned, verified and exported to a database. Reviewing and data correction was undertaken manually and could not be entirely automated. The whole process took, on average, 8 minutes per questionnaire plus 1 minute for logistics. Other costs to consider were supervision of the data entry process and management of data quality (e.g., at least 10% of the questionnaires were entered twice to en-sure data quality and develop data correction guidelines). Overall, the use of web questionnaires required signifi-cantly less labour than paper questionnaires.
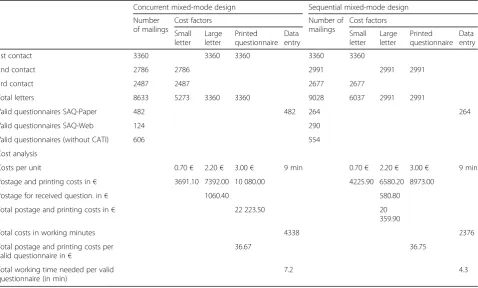
The total number of letters sent out was higher in the sequential mixed-mode design, but the number of paper questionnaires was comparatively low given the higher rate of cheaper and smaller postal letters (Table 6). The postage and printing costs incurred by the sequential de-sign were slightly lower than for the concurrent dede-sign. As the sequential mixed-mode design received consider-ably more web questionnaires, the time available for scanning and verifying paper questionnaires was reduced by about 40%. These advantages decreased in light of the 1.7% lower overall response rate gained by the sequential mixed-mode design (Table 6). The overall response rate is also relevant in calculating the costs per valid ques-tionnaire. The postage and printing costs for each valid questionnaire were almost the same for both the sequen-tial design and the concurrent design, but there was still potential to save labour costs associated with about 40% of the questionnaires given the higher proportion of on-line responses.
In order to estimate the costs for larger population-based interview surveys, we modelled the calculations Table 3Socio-demographic characteristics of the achieved net samples, compared with the original gross samples
Concurrent mixed-mode design Sequential mixed-mode design
Gross sample (N= 3220) Net sample (n= 617) p-value Gross sample (N= 3206) Net sample (n= 561) p-value
Sex (%)
Men 50.1 45.1 <0.05 49.7 42.6 <0.05
Women 49.9 54.9 50.3 57.4
Age group (%)
18–29 years 23.9 15.2 <0.05 24.3 18.4 <0.05
30–44 years 25.2 23.5 24.8 21.0
45–64 years 25.5 31.1 25.5 31.9
≥65 years 25.5 30.1 25.4 28.7
Region of residence (%)
East 49.3 53.3 n.s. 49.1 55.4 <0.05
West 50.7 46.7 50.9 44.6
Residential area (%)
Urban 51.1 59.0 <0.05 50.6 58.3 <0.05
Rural 48.9 41.0 49.4 41.7
using a net sample of 20,000 with a supposed response rate of 20% for the sequential mixed-mode design (Table 7). We assumed a higher response rate (20%) than the meth-odological study’s real field conditions because of higher than expected respondent motivation. All other compo-nents were taken from the findings produced by GEDA 2.0 (Table 6). Both designs incurred very similar levels of postage and printing costs. In a study of this size, more labour is needed in concurrent designs. Given the management of incoming paper-and-pencil questionnaires and data entry demands, the concurrent design required about 960 more working hours than the sequential design. This results in extra costs that have to be paid as well as a time lag in full access to survey data. We calculated labour expenses for data entry based on the pay scale for German public services (Table 7) and found lower labour costs of
about EUR 24,000 for the sequential design compared with the concurrent design. In total, the difference in costs between the two designs was less than EUR 25,000, with overall costs of EUR 670,000 for the concurrent and EUR 645,000 for the sequential design (excluding overheads).
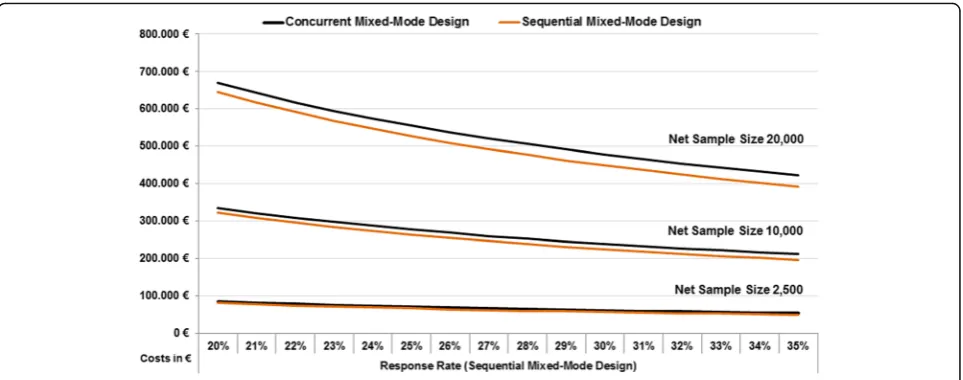
This model of possible survey costs (which excludes data cleaning and overheads) was used for different net sample sizes and different response rates. For example, we calculated the costs associated with net sample sizes of 20,000, 10,000, and 2500 respondents and for different assumed response rates (ranging from between 20% and 35%). In all three net samples, the difference be-tween the two mixed-mode designs increased with higher response rates, with the sequential mixed-mode design having a slight advantage due to its somewhat lower costs compared to the concurrent mixed-mode design (Fig. 5). In general, the cost differences between the two mixed-mode designs declined with smaller net samples.
Discussion
This study compared two different mixed-mode designs: a concurrent and a sequential design. The response rates for the two designs were similar with regard to overall response rate and for different population groups. On-line respondents represented 50% of participants in the sequential mixed mode design, and 20% of participants in the concurrent mixed-mode design. The concurrent mixed-mode design and the second contact letter in the sequential mixed-mode design offered a paper-and-pencil questionnaire, an option that the participants pre-ferred. An important factor in this preference was the way in which we contacted potential participants. No national list of email addresses was available, and German registry offices do not collect this information; therefore, we contacted potential respondents via mail and invited them to complete an online questionnaire. The invitation that was sent out to potential respondents included a URL that had to be manually typed into a browser. Compared with an email invitation that in-cludes an embedded, hot-linked URL, responding re-quired more effort. Researching email addresses or collecting them in a panel or longitudinal study could be an effective way of increasing online participation while also lowering costs [34, 53].
Millar and Dillman (2011) found that web response rates may increase if sequential designs offer the web op-tion first; this was also confirmed by the results of GEDA 2.0. Millar and Dillman’s experiments were con-ducted with a highly internet-literate population that had full access to the internet. Offering this mode as part of a concurrent design led to a lower response rate, whereas offering online participation followed by a paper questionnaire in sequential designs achieved similar re-sponse rates compared to the rere-sponses gained from a Table 4Socio-demographic characteristics of the achieved
samplesa
Concurrent mixed-mode design (n= 617)
Sequential mixed-mode design (n= 561)
p-value
Age (years)
Range 18–79 18–79
Median 51.0 51.0
Mean (SD) 51.0 (17.0) 50.1 (17.8) n.s.
Marital status (%)
Married and cohabitating 61.2 59.1
Separated/divorced/widowed 15.3 13.8
Single 23.5 27.1 n.s.
Household type (%)
One-person household 20.3 18.7 n.s.
Educational level (%)b
Low 20.4 20.6
Medium 51.6 51.4
High 28.0 28.0 n.s.
Equivalent income (€)
Range 92–6750 40–7333
Median 1333 1333
Mean (SD) 1527 (900) 1512 (891) n.s.
Equivalent income (%)c
< 60% of median income 24.1 26.3
60–150% of median 62.9 61.3
≥150% of median 12.9 12.3 n.s.
Employment status (%)
Working 58.0 60.0 n.s.
Migration background (%)
Yes 10.3 12.2 n.s.
n.s. not significant (p> 0.05);SDstandard deviatio a
No information was available for these parameters for the original gross sample b
Education level: CASMIN (Comparative Analysis of Social Mobility in Industrial Nations)
c
mail-only mode [24]. Millar and Dillman also suggest that sequential designs gain the highest level of online participation when reminder emails include a link to an online questionnaire in addition to postal contacts. Revilla (2010) found no differences between concurrent and sequential approaches that offered different modes as part of round four of the European Social Survey in the Netherlands [5]. In a study investigating an internet option provided as part of the American Community Survey [43], the sequential mixed-mode design with an online option achieved a higher response rate than the concurrent design when the time lag between the two contacts was short (2 weeks). The lowest response rates were observed in a sequential design with a time lag of 3 weeks. Technical reasons led us to opt for a three-week interval between the first invitation letter and a reminder offering another mode of participation. Therefore, choosing a shorter period between invitations and re-minders, as well as researching email addresses in ad-vance may improve response rates in sequential designs.
If concurrent designs are considered under the objective of gaining higher response rates (this is independent of participation mode and ignores survey costs), it may be worthwhile sending out paper questionnaires with all reminders.
In both designs, participation via CATI was extremely low; this was presumably caused by the survey’s procedure (respondents had to return their telephone number by post). This suggests that there is little reason to offer a telephone interview when using a sample from registry of-fices. This is especially the case when telephone numbers are unavailable beforehand, and respondents have to be contacted by post and asked to provide a telephone num-ber instead of being called directly.
the sequential design did not lead to significantly different samples. However, these results should be interpreted with caution given the low number of participants. The differ-ences between data collection modes have been published elsewhere [29].
The two designs led to slight and unexpected differ-ences in costs. We assumed that the sequential mixed-mode design would produce lower costs in all cases.
However, printing and postage costs were almost the same, whereas labour costs for data entry were about 40% lower. A reason for this was the low response rates generated by the first contact in the sequential design and by the study as a whole. The low response rate after the first contact meant that a large number of more ex-pensive envelopes containing the paper questionnaire had to be sent out for the sequential design. Another important aspect was the decision not to send follow-up paper questionnaires for the concurrent design. If we had also sent out the paper questionnaires with the first reminder, the postage and printing costs would have been much higher for the concurrent design. As expected, labour costs were lower for the sequential design because of the higher proportion of online questionnaires which meant less time had to be spent on data entry.
Overall, our results suggest that concurrent and se-quential mixed-mode designs are appropriate for studies of this size and that choosing either of these designs will have little effect on the outcome of a study. However, the higher general overhead costs associated with mixed-mode surveys [5] means that a single-mode SAQ-Paper design may be a better alternative for smaller surveys. Modelling these results against the real field conditions faced by future GEDA surveys (German health interview surveys with 20,000 respondents and an assumed response rate of 20%), led to estimates of slightly higher postage and printing costs when using the concurrent design, albeit with very little actual differ-ence between the two designs. However, a concurrent design may require a longer survey period due to the Table 5Missing values for health indicators by survey design
Concurrent mixed-mode design
Sequential mixed-mode design
n (%) n (%) p-value
Diabetes (12-month prevalence) 36 (5.8) 18 (3.2) 0.031
Hypertension (12-month prevalence)
40 (6.5) 18 (3.2) 0.009
Coronary heart disease (lifetime prevalence)
7 (1.1) 4 (0.7) n.s.
Chronic bronchitis (lifetime prevalence)
37 (6.0) 17 (3.0) 0.015
Obesity (BMI≥30) 10 (1.6) 18 (3.2) n.s.
Current depression 47 (7.6) 39 (7.0) n.s.
Mental well-being 30 (4.9) 32 (5.7) n.s.
Social support 9 (1.5) 10 (1.8) n.s.
Current smoking 13 (2.1) 11 (2.0) n.s.
At-risk alcohol consumption 53 (8.6) 39 (7.0) n.s.
Sport participation 13 (2.1) 3 (0.5) 0.020
Influenza vaccination (2011/2012) 20 (3.2) 10 (1.8) n.s.
n.snot significant (p> 0.05)
extra time it involves; time that has to be paid for. As such, the strongest argument for choosing the sequential design for survey fieldwork is that it is faster and, there-fore, more cost-effective in this regard than the concur-rent design.
The sequential design was also more successful in con-vincing people to participate online. This played a sig-nificant role in gaining higher quality data more quickly, with less logistical effort, and less labour time spent on data entry and validation. Taken together, these factors
8.6%
31.7%
6.5%
11.2%
5.0% 8.8%
44.9%
23.2%
26.3%
10.0%
20.7% 0.4%
1.5%
1.3%
0.0% 5.0% 10.0% 15.0% 20.0% 25.0% 30.0% 35.0% 40.0% 45.0% 50.0%
Mixed-Mode concurrent
Mixed-Mode sequential
Mixed-Mode concurrent
Mixed-Mode sequential
Mixed-Mode concurrent
Mixed-Mode sequential
SAQ-Web SAQ-Paper CATI
Fig. 4Timeline of valid questionnaires obtained by mixed-mode design and number of contacts. SAQ-Paper = self-administered paper questionnaire; SAQ-Web = self-administered web questionnaire; CATI = computer-assisted telephone interview; percentages according to mixed-mode-designs
Table 6Costs for the concurrent and the sequential mixed-mode designs in GEDA 2.0a
Concurrent mixed-mode design Sequential mixed-mode design
Number of mailings
Cost factors Number of
mailings
Cost factors
Small letter
Large letter
Printed questionnaire
Data entry
Small letter
Large letter
Printed questionnaire
Data entry
1st contact 3360 3360 3360 3360 3360
2nd contact 2786 2786 2991 2991 2991
3rd contact 2487 2487 2677 2677
Total letters 8633 5273 3360 3360 9028 6037 2991 2991
Valid questionnaires SAQ-Paper 482 482 264 264
Valid questionnaires SAQ-Web 124 290
Valid questionnaires (without CATI) 606 554
Cost analysis
Costs per unit 0.70€ 2.20€ 3.00€ 9 min 0.70€ 2.20€ 3.00€ 9 min
Postage and printing costs in€ 3691.10 7392.00 10 080.00 4225.90 6580.20 8973.00
Postage for received question. in€ 1060.40 580.80
Total postage and printing costs in€ 22 223.50 20
359.90
Total costs in working minutes 4338 2376
Total postage and printing costs per valid questionnaire in€
36.67 36.75
Total working time needed per valid questionnaire (in min)
7.2 4.3
a
reduce costs and time. Consistent with most other em-pirical results, the data quality of the online question-naires was better than the data gained from the paper questionnaires. In addition, the online questionnaires also showed a significantly lower rate of item non-response. Online questionnaires offer several ways to en-sure high data quality. Automated filters and complex routines can minimize the number of unanswered or in-correctly answered items. Plausibility checks are another means of improving data quality. If questions go un-answered, respondents can be interrupted by a popup (do-answer-check) asking whether the previous question was intentionally unanswered or accidently skipped. Plausibility checks can also be used to enforce limits on numeric questions. Such guided answers prevent errors and lead to more accurate data that requires less time and effort to be spent on data cleansing. In the GEDA 2.0 study, these technical measures were only used to a limited extent so as to exclude possible mode differences [29]. The data quality gained by the online question-naires was still clearly better than that of the paper ques-tionnaires. The American Community Survey also found better data quality when data was acquired online than through the use of paper questionnaires [39]. In addition, less time was needed for data preparation and quality assurance in the case of online questionnaires. Moreover, as there was no need for manual data entry, the likelihood of human error was drastically reduced. Data accuracy is an important benefit associated with web-based questionnaires; however, the costs of data cleaning were not included in the model calculation. These costs are hard to estimate, because data cleaning was undertaken using pooled data gained from both modes.
Based on these results and the experiences gained from other methodological studies, the implementation of an informed sequential design (when an opportunity to opt
for another mode is provided on first contact) may be the most appropriate choice for future GEDA waves. Tancreto et al. (2012) experimented with different strategies as part of a concurrent design where they differentiated between prominent and non-prominent choices for the online op-tion. They obtained slightly higher response rates when the choice of participation mode was displayed promently [43]. Therefore, the first invitation letter should in-clude a user name and password for participating via a web questionnaire, but should also state that in 2 weeks, the respondent will receive a paper version of the ques-tionnaire if he or she is unable or unwilling to use the internet. This approach could dramatically reduce costs and the duration of survey fieldwork in particular com-pared to a concurrent design. Moreover, response rates may also be higher than in the sequential mixed-mode de-sign put in place in GEDA 2.0.
Strengths and limitations
been a helpful way of comparing the two mixed-mode samples with a sample achieved in a single-mode design.
As sampling was based on data gained from registry offices and because the sample was limited to six sample points, it does not make sense to compare the response rates in this study to those of previous GEDA surveys. Previous studies employed population-based samples of telephone numbers drawn from directories alongside randomly generated telephone numbers. Telephone sampling is incompatible with samples based on ad-dresses held by German registry offices.
Other limitations concern the external validity of the results. The pilot study was conducted in a German set-ting, using registry-based samples of the adult popula-tion, and the results cannot simply be transferred to other countries, settings or target populations. In par-ticular, this applies to the cost analysis, which was based on German postage and personnel costs. Moreover, the relatively low overall response rate of 18.3% should be taken into account when considering the generalizability of our results. Systematic non-response may have led to selection bias, which could have affected our results. However, as the literature suggests no clear relation be-tween response rate and representativeness [54, 55], a low response rate does not necessarily lead to selection bias or to a lack of generalizability.
Conclusions
The results of this study contribute to the research on implementing mixed-mode designs in population-based public health surveys. We found that it was possible to effectively and efficiently combine Paper and SAQ-Web questionnaires, with comparable results between concurrent and sequential mixed-mode designs. The two designs were equivalent with regard to response rates and sample composition, but the sequential design showed advantages in item non-response and lower labour costs because of the higher share of web responses. These advantages increased with larger net samples and response rates that favoured the sequential design. For smaller sample sizes, single-mode surveys with paper questionnaires may be more appropriate due to the lower overhead costs. Finally, when large sample sizes are needed for population-based health interview surveys of adults in Germany, the sequential mixed-mode design tested for this study may offer a practical alternative to reducing costs and increasing timeliness, given the higher percentage of online participants (Additional file 2).
Additional files
Additional file 1: Table S1.Missing values for health indicators by survey design and mode of data collection. (PDF 26 kb)
Additional file 2: Figure A1.Model-adjusted prevalence rates (95% confidence intervals) for basic health indicators by mixedmode design, adjusted for age, sex, marital status, household type, education, income, employment status, and migration background. (TIFF 208 kb)
Abbreviations
AAPOR:American Association for Public Opinion Research; AUDIT-C: Alcohol Use Identification Test; BMI: Body Mass Index; CATI: Computer-assisted Telephone Interview; GEDA: German Health Update Study; OSS-3: Oslo Social Support Scale; PHQ-8: Patient Health Questionnaire Depression Scale; SAQ-Paper: administered Paper-and-Pencil Questionnaires; SAQ-Web: Self-administered Online Questionnaires; WHO-5: World Health Organization Well-Being Index
Acknowledgements
We would like to thank the study’s participants and all of our colleagues at the Robert Koch Institute who helped carry out the survey.
Funding
The GEDA 2.0 pilot study was funded by the German Federal Ministry of Health.
Availability of data and materials
The minimal data set underlying the findings is archived with the Health Monitoring Research Data Centre at the Robert Koch Institute (RKI) and can be accessed by all interested researchers on site. The Health Monitoring Research Data Centre is accredited by the German Data Forum according to uniform and transparent standards (http://www.ratswd.de/en/data-infrastructure/rdc). On-site access to the minimal data set is possible at the Secure Data Centre of the RKI’s Health Monitoring Research Data Centre, which is located at General-Pape-Straße 64 in Berlin, Germany. Requests should be submitted to Dr Ronny Kuhnert at the Robert Koch Institute, Health Monitoring Research Data Centre, General-Pape-Straße 64, 12101 Berlin, Germany (e-mail: [email protected]).
Authors’contributions
EM reviewed current research, performed the cost calculation, developed the discussion of the findings and contributed substantially to the draft manuscript. EvdL, JA, RS, JH and SM made significant contributions to the study’s conception, performed the statistical analyses, interpreted the data and drafted parts of the manuscript. PS, JA and MW mainly organized the implementation of the study, and its methodological and technical aspects in particular. CL was responsible for the study’s conception and design, and helped interpret the results and critically revised the manuscript. PK reviewed the cost analysis and also helped critically revise the manuscript. All authors reviewed, edited and approved the final manuscript.
Ethics approval and consent to participate
The study was approved by the German Federal Commissioner for Data Protection and Freedom of Information. Informed consent was obtained from all participants. Participants were also informed about the goals and contents of the study, about privacy and data protection and that their participation in the study was voluntary.
Consent for publication
Not applicable
Competing interests
The authors declare that they have no competing interests.
Publisher’s Note
Springer Nature remains neutral with regard to jurisdictional claims in published maps and institutional affiliations.
Author details 1
Received: 2 November 2016 Accepted: 20 October 2017
References
1. Groves RM, Lyberg L. Total survey error: past, present, and future. Public Opin Q. 2010;74:849–79.
2. Biemer PP. Total survey error: design, implementation and evaluation. Public Opin Q. 2010;74:817–48.
3. Bowling A. Mode of questionnaire administration can have serious effects on data quality. Am J Public Health. 2005;27:281–91.
4. Galea S, Tracy M. Participation rates in epidemiologic studies. Ann Epidemiol. 2007;17:643–53.
5. Revilla M. Quality in unimode and mixed-mode designs: a multitrait-multimethod approach. Surv Res Methods. 2010;4:151–64.
6. Lange C, Jentsch F, Allen J, Hoebel J, Kratz AL, von der Lippe E, et al. Data Resource Profile: German Health Update (GEDA) - the health interview survey for adults in Germany. International Journal of Epidemiology. 2015; 2015. doi: https://doi.org/10.1093/ije/dyv067.
7. Kurth B-M. Das RKI-Gesundheitsmonitoring–was es enthält und wie es genutzt werden kann. [english titel: the RKI health monitoring - what it contains and how it can be used]. Public Health Forum. 2012;20(4):e1-4–e3.
8. Lange C, Finger JD, Allen J, Born S, Hoebel J, Kuhnert R, Müters S, Thelen J, Schmich P, Varga M, et al. Implementation of the European health interview survey (EHIS) into the German health update (GEDA). Arch Public Health. 2017;75:40.
9. Hox JJ, De Leeuw ED, Zijlmans EAO. Measurement equivalence in mixed mode surveys. Front Psychol. 2015;6:87.
10. De Leeuw ED: To mix or not to mix data collection modes in surveys. J Off Stat 2005, 21:233-255.
11. De Leeuw ED, Hox J, Dillman D. Mixed-mode surveys: when and why. In: International handbook of survey methodology. Edited by De Leeuw ED, Hox J, Dillman D. New Yorck: Lawrence Erlbaum Assoc Inc; 2008:308–16. 12. De Leeuw ED: Mixed-mode surveys and the internet. Surv Pract 2013, 3. 13. McMorris BJ, Petrie RS, Catalano RF, Fleming CB, Haggerty KP, Abbott RD.
Use of web and in-person survey modes to gather data from young adults on sex and drug use: an evaluation of cost, time, and survey error based on a randomized mixed-mode design. Eval Rev. 2009;33:138–58.
14. Roberts C. Mixing modes of data collection in surveys: a methodological review. In: NCRM methods review papers, vol. NCRM/008. London: ESRC National Centre for Research Methods; 2007.
15. Couper MP. The future of modes of data collection. Public Opin Q. 2011;75:889–908.
16. Voogt RJ, Saris WE. Mixed mode designs: finding the balance between nonresponse bias and mode effects. J Off Stat. 2005;21:367. 17. Dillman DA, Phelps G, Tortora R, Swift K, Kohrell J, Berck J, Messer BL.
Response rate and measurement differences in mixed-mode surveys using mail, telephone, interactive voice response (IVR) and the internet. Soc Sci Res. 2009;38:1–18.
18. Greenlaw C, Brown-Welty S. A comparison of web-based and paper-based survey methods testing assumptions of survey mode and response cost. Eval Rev. 2009;33:464–80.
19. Link MW, Mokdad A. Can web and mail survey modes improve participation in an RDD-based National Health Surveillance? J Off Stat. 2006;22:293. 20. Dillman DA, Smyth JD, Christian LM. Internet, phone, mail, and mixed-mode
surveys: the tailored design method. 4th ed. New York: Wiley; 2014. 21. Baines AD, Partin MR, Davern M, Rockwood TH. Mixed-mode administration
reduced bias and enhanced poststratification adjustments in a health behavior survey. J Clin Epidemiol. 2007;60:1246–55.
22. Klausch T, Hox J, Schouten B. Selection error in single- and mixed mode surveys of the Dutch general population. J R Stat Soc: Ser (Stati Soc). 2015;178:945–61.
23. Medway RL, Fulton J. When more gets you less: a meta-analysis of the effect of concurrent web options on mail survey response rates. Public Opin Q. 2012;76:733–46.
24. Millar MM, Dillman DA. Improving response to web and mixed-mode surveys. Public Opin Q. 2011;75:249–69.
25. Olson K, Smyth JD, Wood HM. Does giving people their preferred survey mode actually increase survey participation rates? An experimental examination. Public Opin Q. 2012;76:611–35.
26. Jäckle A, Roberts C, Lynn P. Assessing the effect of data collection mode on measurement. Int Stat Rev. 2010;78:3–20.
27. Couper MP, Miller PV. Web survey methods introduction. Public Opin Q. 2008;72:831–5.
28. De Leeuw ED, Hox JJ. Internet surveys as part of a mixed mode design. Social and behavioral research and the internet: advances in applied methods and research strategies. New York: Taylor & Francis Group; 2011. p. 45–76. 29. Hoebel J, von der Lippe E, Lange C, Ziese T. Mode differences in a mixed-mode
health interview survey among adults. Arch Public Health. 2014.
30. van Gelder MMHJ, Bretveld RW, Roeleveld N: Web-based questionnaires: the future in epidemiology? Am J Epidemiol 2010, 172:1292-1298.
31. Börkan B. The mode effect in mixed-mode surveys mail and web surveys. Soc Sci Comput Rev. 2010;28:371–80.
32. Shih T-H, Fan X. Comparing response rates from web and mail surveys: a meta-analysis. Field Methods. 2008;20:249–71.
33. Schouten B, van den Brakel J, Buelens B, van der Laan J, Klausch T. Disentangling mode-specific selection and measurement bias in social surveys. Soc Sci Res. 2013;42:1555–70.
34. Bandilla W, Couper MP, Kaczmirek L. The effectiveness of mailed invitations for web surveys and the representativeness of mixed-mode versus internet-only samples. Surv Pract. 2014;7
35. Jäckle A, Lynn P, Burton J. Going online with a face-to-face household panel: effects of a mixed mode design on item and unit non-response. Surv res methods. 2015;9:57–70.
36. Turner S, Viera L, Marsh S. Offering a web option in a mail survey of young adults: impact on survey quality. Annual meeting of the American Association for Public Opinion Research. Chicago; 2010. http://www.websm. org/db/12/15548/Web%20Survey%20Bibliography/Offering_a_Web_Option_ in_a_Mail_Survey_of_Young_Adults_Impact_on_Survey_Quality/. 37. Schwartz B, Kliban K. The paradox of choice: why more is less. New York:
Ecco; 2004.
38. Sax LJ, Gilmartin SK, Bryant AN. Assessing response rates and nonresponse bias in web and paper surveys. Res High Educ. 2003;44:409–32.
39. Griffin DH, Fischer DP, Morgan MT. Testing an internet response option for the American community survey. In: 56th annual conference of American Association for Public Opinion Research. Montreal, Quebec, Canada; 2001. http://www.websm.org/db/12/1228/Web_Survey_Bibliography/Testing_an_ Internet_Response_Option_for_the_American_Community_Survey/?menu= 1&lst=&q=search_1_1111110_-1&qdb=12&qsort=1.
40. Hohwü L, Lyshol H, Gissler M, Jonsson SH, Petzold M, Obel C. Web-based versus traditional paper questionnaires: a mixed-mode survey with a Nordic perspective. J Med Internet Res. 2013;15:e173.
41. Vannieuwenhuyze J, Loosveldt G, Molenberghs G. A method for evaluating mode effects in mixed-mode surveys. Public Opin Q. 2010;74:1027–45. 42. Messer B, Edwards M, Dillman D. Determinants of item nonresponse to web
and mail respondents in three address-based mixed-mode surveys of the general public. Surv Pract. 2012;5. http://www.surveypractice.org/index.php/ SurveyPractice/article/view/45/html.
43. Tancreto JG, Zelenak MF, Davis M, Ruiter M, Matthews B. 2011 American community survey internet tests: results from first test in April 2011. In: American community survey research and evaluation report memorandum series. Washington D.C.: U.S: Census Bureau; 2012.
44. Häder S. Wer sind die Nonpubs? Zum Problem anonymer Anschlusse bei der Stichprobenziehung fur Telefonumfragen. ZUMA-Nachrichten. 1996;39:45–68.
45. American Association for Public Opinion Research (AAPOR). Standard definitions: final dispositions of case codes and outcome rates for surveys (revised 2011): Deerfield: AAPOR; 2011.
46. Brauns H, Scherer S, Steinmann S. The CASMIN educational classification in international comparative research. In: JHP H-Z, Wolf C, editors. Advances in cross-National Comparison: a European working book for demographic and socio-economic variables. Boston, MA: Springer US; 2003. p. 221–44. 47. World Health Organization. Obesity: preventing and managing the global
epidemic. Report of a WHO consultation. World Health Organ Tech Rep Ser. 2000;894:i-xii–1-253.
48. Cox B, van Oyen H, Cambois E, Jagger C, le Roy S, Robine JM, Romieu I. The reliability of the minimum European health module. Int J Public Health. 2009;54:55–60.
50. Bech P, Olsen LR, Kjoller M, Rasmussen NK. Measuring well-being rather than the absence of distress symptoms: a comparison of the SF-36 mental health subscale and the WHO-five well-being scale. Int J Methods Psychiatr Res. 2003;12:85–91.
51. Meltzer H. Development of a common instrument for mental health. In: Nosikov A, Gudex C, editors. EUROHIS: developing common instruments for health surveys. Amsterdam: IOS Press; 2003. p. 35.
52. Bush K, Kivlahan DR, McDonell MB, Fihn SD, Bradley KA. The AUDIT alcohol consumption questions (AUDIT-C): an effective brief screening test for problem drinking. Ambulatory care quality improvement project (ACQUIP). Alcohol use disorders identification test. Arch Intern Med. 1998;158:1789–95.
53. Cernat A, Lynn P. The role of email addresses and email contact in encouraging web response in a mixed mode design. In: Understanding Society at the Institute for Social and Economic Research, editor. Working Paper. Essex 2014.
54. Schouten B, Cobben F, Bethlehem J. Indicators for the representativeness of survey response. Surv Methodoly. 2009;35:101–13.
55. Groves RM, Peytcheva E. The impact of nonresponse rates on nonresponse bias: a meta-analysis. Public Opin Q. 2008;72:167–89.
• We accept pre-submission inquiries
• Our selector tool helps you to find the most relevant journal
• We provide round the clock customer support
• Convenient online submission
• Thorough peer review
• Inclusion in PubMed and all major indexing services
• Maximum visibility for your research
Submit your manuscript at www.biomedcentral.com/submit