The Thirty-Third AAAI Conference on Artificial Intelligence (AAAI-19)
Allocating Interventions Based on Predicted Outcomes: A Case Study on
Homelessness Services
Amanda Kube, Sanmay Das
Computer Science & Engineering and Division of Computational and Data Sciences
Washington University in St. Louis
{amanda.kube,sanmay}@wustl.edu
Patrick J. Fowler
Brown School and
Division of Computational and Data Sciences Washington University in St. Louis
Abstract
Modern statistical and machine learning methods are increas-ingly capable of modeling individual or personalized treat-ment effects. These predictions could be used to allocate dif-ferent interventions across populations based on individual characteristics. In many domains, like social services, the availability of different possible interventions can be severely resource limited. This paper considers possible improvements to the allocation of such services in the context of home-lessness service provision in a major metropolitan area. Us-ing data from the homeless system, we use a counterfactual approach to show potential for substantial benefits in terms of reducing the number of families who experience repeat episodes of homelessness by choosing optimal allocations (based on predicted outcomes) to a fixed number of beds in different types of homelessness service facilities. Such changes in the allocation mechanism would not be without tradeoffs, however; a significant fraction of households are predicted to have a higher probability of re-entry in the op-timal allocation than in the original one. We discuss the effi-ciency, equity and fairness issues that arise and consider po-tential implications for policy.
Introduction
Homelessness represents a long-standing problem with con-siderable individual and social costs. Homeless services co-ordinated at the community level (i.e, homeless system) struggle to keep up with demand for housing assistance, and little evidence supports the accuracy of current deci-sion making in the allocation of limited homeless services (Brown et al. 2018; Fowler et al. 2017; Shinn et al. 2013). Advances in machine learning and AI techniques have made it possible to apply learning algorithms to social problems ranging from police patrol to poaching. Many of these so-lutions have had success in mitigating the problem to which they were applied (McCarthy, Vayanos, and Tambe 2017; Mukhopadhyay et al. 2016, e.g.). In this paper, we test the feasibility of data-driven approaches to inform policies that guide homeless service delivery. Specifically we ask the question of whether one can use individual predictions of success for certain types of homeless services to improve outcomes across the population.
Copyright c⃝2019, Association for the Advancement of Artificial Intelligence (www.aaai.org). All rights reserved.
Ethics and fairness: Since we are considering a prob-lem of allocating scarce, shared societal resources using al-gorithmic approaches, it is important to foreground the dis-cussion of ethical issues and fairness concerns. The use of techniques from artificial intelligence and machine learn-ing (and more broadly, algorithmic approaches) in differ-ent societal contexts have increasingly raised concerns re-garding fairness, accountability, and transparency (O’Neil 2016). In a number of situations, data-driven allocations have unintentionally introduced systematic biases that per-petuate inequities, such as racial disparities in credit lending, hotspot policing, and crime sentencing (Ensign et al. 2017; Pleiss et al. 2017; Corbett-Davies et al. 2017). The complex-ity involved in the development of decision algorithms has called into question the ability to design adequate protec-tions against systematic misuses. In response to these types of concerns, the European Union recently issued the “Gen-eral Data Protection Regulation” (GDPR), which imposes restrictions on how individual data can be used for algo-rithmic decision making in ways that “significantly affect” users. The GDPR coincides with a broader argument for
not just full transparency, but ratherhuman interpretability
regarding how decisions are derived from algorithmic ap-proaches to ensure adequate assessment of fairness.
However, requirements for human interpretability could also diminish the potential of AI to solve societal problems. Algorithmic approaches generate novel solutions that may not correspond to human intuition; requirements for full ex-plainability of these complex processes limits the inherent value of applications to thorny social problems. In a recent
on both efficiency and equity considerations.
Resource allocation for social services: A key differ-ence in making resource allocation decisions on the basis of predictions in the social services setting, when predic-tions are being made based on observational data, is that the importance of causal modeling is magnified. As op-posed to the types of problems that Kleinberg et al. (2015) call “prediction policy problems”, or for example using ma-chine learning predictions of default to manage risk (Bu-taru et al. 2016), we need useful counterfactual estimates of the effects of different interventions in order to even de-fine the resource allocation problem. There has been sig-nificant recent progress in causal modeling from a ma-chine learning perspective (Johansson, Shalit, and Sontag 2016, e.g.). For our work we use Bayesian additive regres-sion trees (BART) (Chipman, George, and McCulloch 2007; Chipman et al. 2010), which have the benefit of providing coherent probabilistic estimates of heterogeneous treatment effects. Thus, it allows us to predict individual outcomes un-der counterfactual allocations.
While there is a long history of mechanism design re-search on assignment problems, school allocation, organ al-location, refugee matching, etc. (Kominers, Teytelboym, and Crawford (2017) provide an excellent recent introduction to market design), and much recent interest in the AI and broader computer science community in mechanism design
for social good1, there has been limited prior work on
home-lessness specifically. The most relevant study is that of Az-izi et al. (2018), who consider allocation policies specifi-cally for homeless youth. They formulate a dynamic allo-cation problem between arriving homeless youth and two types of housing resources (rapid rehousing and permanent supportive housing) in order to fairly and efficiently allocate youth to these resources; our focus moves beyond accurate screening to forecast response to multiple interventions us-ing counterfactual approaches. Ours is one of the first stud-ies to consider using machine-learning based estimates of counterfactual outcome probabilities to estimate the value of, and thus inform, allocation decisions for homeless ser-vices. We present this work as a proof-of-concept, based on a real administrative dataset across the whole range of home-less populations in a metro area, to address the following
question:By optimizing allocations based on predicted
out-comes, how much could we potentially improve outout-comes, and what would be the distributional effects of these im-provements?
Problem setup: Homelessness providers coordinate community-wide services that vary in level of intensity to meet household needs. In the US, services range from time-limited nonresidential supports to ongoing rental assistance with intensive case management (United States Congress 2009). At any given time, the homeless system allocates many households to many interventions, each subject to ca-pacity constraints. Fundamentally, homeless services aim to stabilize households and reduce future demand for assis-tance. One commonly used metric of successful services
1
For example, see the ACM EC workshops on Mechanism De-sign for Social Good in 2017 and 2018.
tracks the number of households that use additional home-less services within two years of initial contact; counts are generated from administrative data that record entries and exists across homeless services (HUD 2012). However, rou-tine capacity constraints make it challenging to measure suc-cess, since those in need may not be able to receive services. In this work, we take advantage of unique local adminis-trative records to assess whether households reenter home-less assistance within two years of initial contact, regardhome-less of whether they actually use the services. The data available
to us links homeless service records with requestsfor
as-sistance through a regional homeless hotline. We build and evaluate counterfactual models (using BART) for whether a household would have re-entered the homeless system if signed to a different intervention, and solve a capacitated as-signment problem in order to minimize the number of house-holds re-entering the system within two years, subject to ca-pacity constraints on each intervention.
Preview of results: Using administrative data on a weekly basis over the course of 166 weeks, we find that the BART model is well-calibrated. It predicts (out-of-sample), in expectation, 2227 (43.72%) of households would re-enter the system, and 2193 (43.04%) actually did. In the optimized assignment we find, the BART model predicts that only 1624 households (31.88%) would re-enter the system. Thus, there may be substantial benefits achievable (by this re-entry metric) from improving the combined prediction-allocation mechanism. However, these benefits do not come without tradeoffs. They are not even close to pareto-improving. In fact, as many households increase their probability of re-entry, according to the predictions, as those that decrease their probability of re-entry. We also formulate and solve a constrained version of the allocation problem, which guar-antees that no household increases their probability of re-entry by more than 5 percentage points in the new allocation. In this case, 37.38% of households are predicted to re-enter.
Implications:Our work is intended as a proof of concept and a case study. We bring data to bear on the question of how much AI techniques can improve social service provi-sion, with full awareness that the precise results presented may depend on specific modeling choices, and the reliabil-ity of the counterfactual estimates. We expect this work to contribute to the emerging dialogue on intervening based on machine learning predictions. It is very important to con-sider fairness, ethics, and the long-term dynamics of systems that use these kinds of predictive modules. At the same time, the current state of practice in social services allocation is far from evidence-based; therefore, not engaging these ques-tions with actual data and estimates could be leading to sig-nificant societal harm.
Background and Data
estimate that more than 550,000 people experienced home-lessness in the United States on a single night in January, 2016 (Henry et al. 2016), and 1.4 million people used home-less services at some point during the year (Solari et al. 2016). Families with children under 18 years of age com-prised 35% of the homeless population. Experiences of homelessness and associated turmoil carries life long impli-cations, as well as significant social costs (Khadduri et al. 2010; Culhane, Park, and Metraux 2011).
The homeless system represents the primary community-wide response to housing crises. Funds allocated by Congress on an annual basis support the delivery of five types of homeless assistance. Service types vary in intensity, and relatedly, availability. The most intensive service -Permanent Supportive Housing - provides long-term rental assistance plus comprehensive case management to address barriers to stability, such as mental health and substance abuse treatment; it is reserved for the highest risk households and consumes the greatest amount of financial resources. Transitional Housing also offers comprehensive case man-agement but only up to 24 months in congregate settings. Rapid Rehousing allows up to 24 months of rental assistance without additional intensive case management. At the end of two years, households in Transitional Housing or Rapid Rehousing either move on their own or step-up to Perma-nent Supportive Housing, if available. Emergency Shelters offer immediate accommodations for those with no other place to go, and typically serve a large number of house-holds for a brief period of time. Shelters are intended to sta-bilize households and divert high-risk families to the longer-term housing interventions. Finally, Homelessness Preven-tion provides households at imminent risk for homeless-ness with short-term and non-reoccurring assistance to mit-igate housing crises. Local non-profit provider networks de-termine the delivery of day-to-day services within general structures determined by federal funding priorities.
Despite substantial investments, homeless rates remain stubbornly high in the United States. An enormous chal-lenge is that of matching service types to need. While fed-eral guidelines mandate that local agencies provide services based on risk assessments (United States Congress 2009), existing tools fail to discern high and low risk households beyond chance (Brown et al. 2018; Shinn et al. 2013). Homeless service providers have limited evidence for adapt-ing responses to household characteristics. Moreover, there are no tools that assess the impact of service matches on
overall system performance in reducing reentries.2
Algorithmic approaches offer substantial promise for ad-dressing the optimization of homeless service delivery. Administrative records systematically track service usage and household characteristics over time, and provide rich sources of information from which to glean insights into service improvements. Therefore, potential exists to evalu-ate improvements in prediction that support decision
mak-2
Annual evaluations of homeless system performance monitor rates of return to the homeless system within 24 months; future federal funding depends in part on demonstrating trends toward reductions in reentries.
ing. However, as mentioned above, the application of data-driven approaches for delivery of scarce resources to address homelessness requires careful consideration of fairness. The feasible application of any algorithms must be transparent and assess unintended sources of bias (O’Neil 2016).
Data Collection
Data for the project come from the homeless management information system (HMIS) of a major metropolitan area from 2007 through 2014. The HMIS records all housing ser-vices provided to individuals and families seeking federally funded homelessness assistance. Local service providers en-ter information on requests and receipt of services in real time through a web-based platform in accordance with fed-eral mandates for collection of universal elements. A local non-profit organization contracted with the homeless sys-tem hosts the platform and provides support, including user training, technical assistance, and active quality control.
Records provide information on the characteristics and services delivered to households in contact with the home-less system. Household-level characteristics includes an ar-ray of information on demographics, housing risk assess-ments, and eligibility determinations. Services include en-try and exit dates from the five federally defined types of homeless assistance: homelessness prevention, emergency shelter, rapid rehousing, transitional housing, and permanent supportive housing. In addition, the metropolitan area coor-dinates requests for assistance through a homeless hotline, and household-level data record information on every call, including dates and referral for services. Household identi-fiers allow linkages of information across time. Data sharing agreements with regional homeless systems allow access to de-identified records in accordance with the relevant Institu-tional Review Board.
Data Cleaning and Feature Selection
For this project, we extract data provided by 75 different homeless agencies and link participants across programs by a unique, anonymous identification number. We then aggre-gate data by household using a unique household identifica-tion number. This results in a dataset of households contain-ing household characteristics available upon entry into the system, as well as information on all entries and exits from different homeless services. Permanent supportive housing is meant as an intervention that households transition into after a certain period of time or the conclusion of a particu-lar intervention, and is meant for those who need continuing support. Because of the nature of this intervention and the fact that we focus on first entries into the homeless system, we exclude permanent supportive housing from our analy-ses.
homeless services. We consider households to have exited from the system when the time between leaving one service and entering another exceeds one day. Our analyses include households who entered the homeless system after the start of 2007 and exited before the end of 2012 to provide a min-imum two-year follow-up for all households.
Since the data captures homeless services across time, it contains both time-invariant (e.g., race, gender, ethnicity) as well as time-variant (e.g., monthly income, age) features. We select values of time-variant features that are collected at the time of first entry into the homeless system and have ade-quate amounts of available data for use in our model. Most of the variables we selected were categorical, and missing values are treated as a separate category in these cases.
Data Characteristics
The dataset includes records on 7474 households. Of these, 3216 (43.03%) reentered the homeless system within two years of exiting. Table 1 shows the number of households assigned to each service type, as well as the percentage reen-tries within 2 years for each intervention. Of the 3216 who reentered, 1522 (47.33%) were placed in a subsequent ser-vice, while 1694 (52.67%) called the hotline for assistance but by the end of the two year period had not been placed in another service.
A single feature vector consists of covariate data for head-of-household, spouse, and children (e.g. race, gender, and disability information) as well as which service type the household was assigned to. The target variable, or label, is a binary indicator of whether or not they reentered the home-less system within 2 years of exiting. Table 2 shows a sum-mary and examples of the features included.
Analyzing Interventions
The application requires a method that can handle the chal-lenges of counterfactual inference using observational data, while simultaneously providing a well-grounded probabilis-tic model. Bayesian nonparametric modeling for causal in-ference has a number of advantages that fit this application (Chipman et al. 2010; Hill 2011; Johansson, Shalit, and Son-tag 2016). These models provide robust estimates of treat-ment effects using observational data like administrative ser-vice records. They can handle a large number of features or predictors, as well as complex data that include interac-tions and nonlinearities seen in studies of housing assistance in child welfare. We use BART (Bayesian Additive Regres-sion Trees), an ensemble model that outperforms propensity score and nearest neighbor matching algorithms for causal inference on observational data, especially when the data are complex (Hill 2011). BART can also explicitly address het-erogeneous response to interventions based on empirically identified features in the data, generating individual treat-ment effect estimates (or counterfactual predictions) in ad-dition to population-level ones.
Building the Model
BART (Chipman, George, and McCulloch 2007; Chipman et
al. 2010) models the data by approximatingf(x) =E(Y|x)
as a sum of binary regression trees. The sum-of-trees model includes trees of different sizes and allows BART to incor-porate both additive and interaction effects of various orders. BART uses a regularization prior to restrain the effect of each tree and then uses a Bayesian backfitting MCMC al-gorithm to draw samples from the posterior distribution. At the start of the MCMC draws, a chain of single-node trees is instantiated. During each iteration, each tree can increase or decrease its number of nodes or swap decision rules between a parent node and a child node. Then, BART computes a new
sample from the approximated posterior distributionf∗as a
sum of the results from the current set of trees. These poste-rior samples consist of 1000 post-burn-in samples for each observation. Using BART to model the data produces a set
of posterior drawsfor each household in the dataset,
allow-ing population-wide as well as household-specific inference. Model fitting and counterfactual inference were done using
the R packageBayesTreewritten by the model’s creators
(Chipman et al. 2010).
Population Treatment Effects
The key decision variable is the choice of intervention to which a household should be allocated. For the larger enter-prise proposed in this work to make sense, it is important that different interventions actually have different effects. While Table 1 shows apparent differences in the probability of reentry based on intervention, these differences could be due to unobserved variables or selection bias because of the non-random provision of services. Therefore, we start by system-atically investigating the differential effects of these housing interventions (homelessness prevention, emergency shelter, rapid rehousing, and transitional housing) on the probability of reentry into homeless services within two years.
We compare service types by doing pairwise inference. We select data for each pair and build a BART model based on this data. We use BART to approximate the posterior dis-tribution of reentry based on this model for the factual ser-vice type as well as the counterfactual (if all covariates re-main the same but service type changes). Then, we take the mean and 2.5% and 97.5% quantiles of the difference be-tween counterfactual samples and factual samples in order to find treatment effects and 95% estimated credible intervals for service type. We do this for all pairs of service types as well as for homelessness prevention compared to any other service type.
Service Type Number Assigned Percent Reentered
Emergency Shelter 2897 56.20
Transitional Housing 1927 40.22
Rapid Rehousing 589 53.48
Homelessness Prevention 2061 24.16
Total 7474 43.03
Table 1: Summary of assignment to services across the dataset as well as reentry statistics for each type of service
Type Number Examples
Binary Features 3 Gender, Spouse Present, HUD Chronic Homeless
Non-Binary Categorical Features 61 Veteran Status, Disabling Condition, Substance Abuse
Continuous Features 4 Age, Monthly Income, Calls to Hotline, Duration of Wait
Total Features 68
Table 2: Summary of features
Optimal Allocation Using Estimated
Personalized Treatment Effects
In order to frame the optimal allocation problem, we need two main sets of variables estimated from the data. First are the actual predictions of probability of reentry for house-holds given they are placed in each of the possible inter-ventions. For this, we use out-of-sample BART predictions. Second are the capacities of the different interventions -that is, the number of beds available at a given time. In or-der to estimate these, we aggregate data on a weekly basis, and match the number of entering households into the in-terventions to the capacities of those inin-terventions in that week. One week is granular enough to give some flexibil-ity to the optimizer, while also not leading to waits that are outside the tolerance of the system. We note here that we solve the problem in a static manner every week, al-though there could, of course, be interesting dynamic match-ing issues at play (Akbarpour, Li, and Oveis Gharan 2017; Anshelevich et al. 2013).
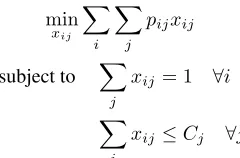
The Optimization Problem
Let xij be a binary variable representing whether or not
householdiis placed in interventionj. Then, the Integer
Pro-gramming problem is given by
min
xij ∑
i ∑
j
pijxij
subject to ∑
j
xij = 1 ∀i
∑
i
xij ≤Cj ∀j
wherepijis the probability of householdireentering if they
are placed in interventionjandCj is the capacity of
inter-ventionj.
We use this IP framework and Gurobi optimization soft-ware to find an optimal allocation for households who
en-tered the system during each week.3Only households who
3
This is essentially a capacitated version of the assignment
entered the homeless system between October, 2009 (after initial implementation of the rapid rehousing intervention) through December, 2012 were included in the optimization resulting in 166 separate weeks optimized.
Over the 166 weeks, 2193 out of 5095 households (43.04%) actually reentered the homeless system. Using BART predictions to estimate how many households would reenter in expectation produces an estimate of 2227 house-holds (43.72%), suggesting that the predicted reentry prob-abilities given by BART are reliable. Using these predicted probabilities to find an optimal allocation, predicted reen-tries reduce to 1624 households (31.88%). Thus, the optimal allocation framework reduces the predicted number of reen-tries into the homeless system by 27.08% over this period, a truly substantial potential improvement in outcomes.
Fairness Considerations
An immediate question is whether the optimal allocation is capturing some inherent inefficiency in the allocation sys-tem, and is therefore pareto-improving or at least improving allocations for a substantial portion of the population. This turns out to not be the case. In the optimal allocation, 1690 (33.17%) individual households are allocated to a service in which they have a lower probability of reentry than the service in which they actually participated. Another 1743 (34.21%) are allocated to the same service they were origi-nally assigned. Importantly, 1662 (32.62%) households are
allocated to a service in which they have a higher
proba-bility of reentry. Therefore, the optimal number of expected reentries is achieved by, in effect, hurting as many house-holds as it helps in the original allocation. At the same time, the benefits to those who are helped are so strong that they outweigh the costs to those households who are hurt in an additive welfare model. Figure 1 quantifies this by showing
Differences in probability of reentry between the original allocation and the optimal allocation
Frequency
−0.15 −0.10 −0.05 0.00 0.05 0.10 0.15
0
100
200
300
400
Figure 1: Histogram of improvement in reentry probability under the unconstrained optimized allocation (the 1743 indi-viduals whose probability of reentry was unchanged are not included)
the distribution of changes in the probability of reentry be-tween the two allocations.
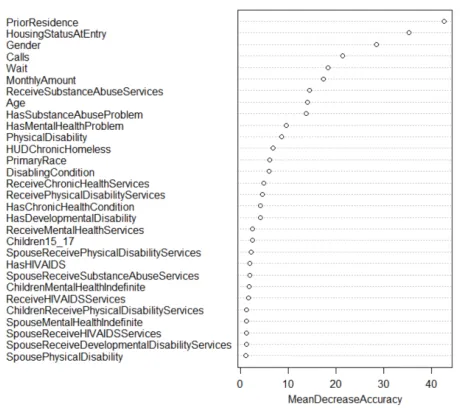
To further explore differences between those who bene-fit from the optimal allocation and those who are predicted to do worse, we used a random forest to predict whether a household will have a higher or lower probability of reen-try after the optimal allocation using all original features and ignoring service type. We then were able to get mea-sures of variable importance from the random forest model. Figure 2 shows the “mean decrease in accuracy” measure (a standard permutation test for random forest feature im-portance) for the 30 most influential features. This analysis shows that the two most influential variables for deciding which households will have a lower probability of reentry and which will have a higher probability are prior residence and housing status at entry. Table 3 shows summary statistics for a few of the most influential features for the group who improved, the group who was harmed, and the group who did not change. We used Student’s t-tests for difference in means to assess whether values of Calls Before Entry, Wait Before Entry, Monthly Income, and Age of Head of House-hold for the group who improved and the group who was harmed were significantly different. We found that all dif-ferences were significant with p-values less than 0.002.
Perhaps the most striking fact to emerge from this analysis is that the optimal allocation seems to help those who stand out as being more in need. Households with lower monthly incomes, longer waits and fewer calls to the hotline before being placed, and those who are have more serious substance abuse problems are more likely to be placed in interventions that are better for them in expectation. This suggests an abil-ity to improve upon the allocation rules currently used by the homeless system. One possible explanation is that in the current system, it seems inappropriate to assign people who are in more need to homelessness prevention. However, as
Figure 2: Plot of the mean decrease in accuracy of features for predicting whether the optimal allocation will increase or decrease a household’s probability of reentry
our results suggest, homelessness prevention is more effec-tive on average than any other service.
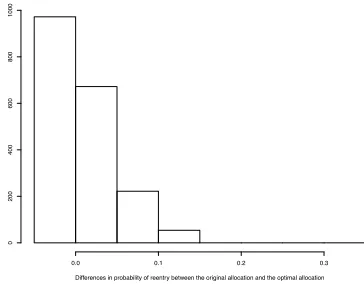
Constraining Increased Probability of Reentry
It is possible that the inefficiency of the original allocation is in part due to humans making decisions in the interests of equity. One way to potentially deal with fairness concerns like these is to make them explicit in the optimization. As an example, we consider what happens if we add a constraint that prevents any household from suffering too high a pre-dicted cost from the change in allocation:
∑
j
pijxij ≤ ∑
j
pijyij+ 0.05∀i
where eachyij is a binary variable representing whether or
not householdiwas originally placed in interventionj. This
constraint keeps households from being allocated to a ser-vice in which their predicted probability of reentry is more than 5 percentage points higher than that of the service they participated in originally.
Continuous Feature Mean (SD) for Group Who Improved Mean (SD) for Group Who Was Harmed Mean (SD) for Group Who Did Not Change
Calls Before Entry 8.74 (12.25) 4.81 (8.45) 7.61 (12.09)
Wait Before Entry 449.41 (546.49) 389.24 (544.59) 416.94 (542.51)
Monthly Income 848.95 (1043.23) 1410.10 (2404.61) 1058.143 (1297.56)
Age of Head of Household 41.04 (12.35) 44.57 (12.58) 42.29 (12.77)
Categorical Feature Values Percentage of Population Percentage Who Improved Percentage Who Was Harmed Percentage Who Did Not Change
Prior Residence Emergency Shelter 7.83 47.62 21.55 30.83
Staying or living in a family member’s room, apartment or house 5.65 33.68 31.25 35.07 Place not meant for habitation 7.50 47.64 31.94 20.42 Rental by client no ongoing housing subsidy 13.03 2.71 60.39 36.90 Owned by client no ongoing housing subsidy 10.56 0.37 63.94 35.69
Missing 38.55 44.86 17.46 37.68
Housing Status At Entry Homeless 20.01 25.68 9.93 8.26
At imminent risk of losing housing 1.28 1.07 38.45 19.28 At-risk of homelessness - prevention programs only 0.08 0.06 13.90 9.01
Stably Housed 0.46 0.53 4.03 2.01
Client doesn’t know 78.16 72.66 33.69 61.45
Gender Male 41.32 35.25 33.92 30.83
Female 58.68 31.71 31.71 36.59
Head of Household Has Substance Abuse Problem No 68.24 30.54 35.06 34.40
Alcohol abuse 6.24 36.79 28.30 34.91
Drug abuse 12.89 38.05 28.31 33.79
Both alcohol and drug abuse 9.93 40.32 27.47 32.21
Missing 2.69 41.61 21.17 37.23
Table 3: Summary statistics for the most influential features for determining which households will benefit from the optimal allocation (due to the large number of prior residence categories, those making up less than 5% of the population were omitted from the table)
Differences in probability of reentry between the original allocation and the optimal allocation
Frequency
0.0 0.1 0.2 0.3
0
200
400
600
800
1000
Figure 3: Histogram of improvement in reentry probability under the constrained optimized allocation (the 3175 indi-viduals whose probability of reentry was unchanged are not included)
the new allocation – in fact Figure 3 shows that the majority that do worse suffer very small penalties.
Discussion
This paper tests the feasibility of using data-driven coun-terfactual approaches to inform policies that guide homeless service provision. We analyze the potential for different allo-cation mechanisms to improve outcomes using counterfac-tual estimates of probability of reentry into the system. We estimate that optimal assignments, done on a weekly basis, could reduce the number of reentries into the system sig-nificantly. However, a significant number of households are also hurt by the changed allocation (albeit less than the oth-ers are helped). Thus, data-driven benefits for the homeless system as a whole do not necessarily improve outcomes for all. In an attempt to reduce the harmful effects to part of the population, we impose an additional constraint to pre-vent households from suffering too much of an increase in
the probability of reentry, satisfying a notion of approximate fairness (assuming the original allocation is fair). This still reduces the number of reentries into the system when com-pared to the actual allocation, but including the constraint reduces the overall benefits from optimizing the assignment of households to interventions.
It is critical that fairness and justice considerations be thoroughly analyzed and addressed before algorithmic allo-cations are implemented. One potential solution is allowing workers to override certain allocation decisions. This idea has previously been adopted as part of a screening instru-ment used in New York City (Shinn et al. 2013). Shinn and colleagues also mention that analysis of the reasons behind these overrides can help to inform future models of this type. The addition of potential override reasons to an allocation model could help to increase fairness, tune future versions of the model, as well as make the transition to an allocation program smoother by allowing homeless service workers to maintain control over allocations.
The findings must be considered in context of study lim-itations. The observational nature of the data makes it diffi-cult to rule out all potential confounding variables that we were not aware of or to which we did not have access. How-ever, the dataset included all variables measured consistently by the HMIS for which there was enough available data.
Acknowledgments
We are grateful for support from NSF awards 1527037 and 1560191. We appreciate the assistance of Municipal Infor-mation Systems Inc. (MISI) for coordinating data access, as well as the numerous local homeless providers who gra-ciously contributed insights for the study.
References
Akbarpour, M.; Li, S.; and Oveis Gharan, S. 2017. Thick-ness and information in dynamic matching markets. Work-ing paper. Initial version appeared at ACM Conference on Economics and Computation (EC-14).
Anshelevich, E.; Chhabra, M.; Das, S.; and Gerrior, M. 2013. On the social welfare of mechanisms for repeated
batch matching. InProceedings of the AAAI Conference on
Artificial Intelligence, 60–66.
Azizi, M. J.; Vayanos, P.; Wilder, B.; Rice, E.; and Tambe, M. 2018. Designing fair, efficient, and interpretable poli-cies for prioritizing homeless youth for housing resources. InProceedings of the International Conference on the Inte-gration of Constraint Programming, Artificial Intelligence, and Operations Research. To appear.
Brown, M. M.; Cummings, C.; Lyons, J.; Carri´on, A.; and Watson, D. P. 2018. Reliability and validity of the vulner-ability index and service prioritization decision assistance
tool (VI-SPDAT) in real-world implementation. Journal of
Social Distress and the Homeless. Advance online publica-tion.
Butaru, F.; Chen, Q.; Clark, B. J.; Das, S.; Lo, A. W.; and Siddique, A. R. 2016. Risk and risk management in
the credit card industry. Journal of Banking and Finance
72:218–239.
Chipman, H. A.; George, E. I.; McCulloch, R. E.; et al. 2010.
Bart: Bayesian additive regression trees. The Annals of
Ap-plied Statistics4(1):266–298.
Chipman, H. A.; George, E. I.; and McCulloch, R. E. 2007.
Bayesian ensemble learning. Advances in Neural
Informa-tion Processing Systems19:265–272.
Corbett-Davies, S.; Pierson, E.; Feller, A.; Goel, S.; and Huq, A. 2017. Algorithmic decision making and the cost
of fairness. InProceedings of the 23rd ACM SIGKDD
In-ternational Conference on Knowledge Discovery and Data Mining, 797–806. ACM.
Culhane, D. P.; Park, J. M.; and Metraux, S. 2011. The patterns and costs of services use among homeless families.
Journal of Community Psychology39(7):815–825.
Ensign, D.; Friedler, S. A.; Neville, S.; Scheidegger, C.; and Venkatasubramanian, S. 2017. Runaway feedback loops in
predictive policing.arXiv preprint arXiv:1706.09847.
Fowler, P. J.; Wright, K.; Marcal, K. E.; Ballard, E.; and Hovmand, P. 2017. Capability traps impeding homeless services: A community based system dynamics evaluation. Working paper.
Henry, M.; Watt, R.; Rosenthal, L.; and Shivji, A. 2016. The 2016 Annual Homelessness Assessment Report (AHAR) to
Congress: Part 1 Point-in-Time Estimates of Homelessness. The Department of Housing and Urban Development.
Hill, J. L. 2011. Bayesian nonparametric modeling for
causal inference. Journal of Computational and Graphical
Statistics20(1):217–240.
HUD. 2012. Homeless emergency assistance and rapid tran-sition to housing: Continuum of care program; interim final
rule. Federal Register77(147):”45422–45467”.
Johansson, F.; Shalit, U.; and Sontag, D. 2016. Learning
rep-resentations for counterfactual inference. In International
Conference on Machine Learning, 3020–3029.
Khadduri, J.; Leopold, J.; Sokol, B.; and Spellman, B. 2010.
Costs Associated with First-Time Homelessness for Families and Individuals. Dept. of Housing and Urban Development. Kleinberg, J.; Ludwig, J.; Mullainathan, S.; and Obermeyer,
Z. 2015. Prediction policy problems. The American
Eco-nomic Review105(5):491–495.
Kominers, S. D.; Teytelboym, A.; and Crawford, V. P. 2017.
An invitation to market design. Oxford Review of Economic
Policy33(4):541–571.
McCarthy, S. M.; Vayanos, P.; and Tambe, M. 2017. Stay-ing ahead of the game: Adaptive robust optimization for
dy-namic allocation of threat screening resources. In
Proceed-ings of the 26th International Joint Conference on Artificial Intelligence, 3770–3776. AAAI Press.
Mukhopadhyay, A.; Zhang, C.; Vorobeychik, Y.; Tambe, M.; Pence, K.; and Speer, P. 2016. Optimal allocation of police patrol resources using a continuous-time crime model. In
International Conference on Decision and Game Theory for Security, 139–158. Springer.
O’Neil, C. 2016. Weapons of Math Destruction: How Big
Data Increases Inequality and Threatens Democracy. New York, NY, USA: Crown Publishing Group.
Pleiss, G.; Raghavan, M.; Wu, F.; Kleinberg, J.; and
Wein-berger, K. Q. 2017. On fairness and calibration. InAdvances
in Neural Information Processing Systems, 5684–5693. Shinn, M.; Greer, A. L.; Bainbridge, J.; Kwon, J.; and Zuiderveen, S. 2013. Efficient targeting of homelessness
prevention services for families. American Journal of
Pub-lic Health103(S2):S324–S330.
Solari, C.; Shivji, A.; de Sousa, T.; Watt, R.; and Silverbush, M. 2016. The 2016 Annual Homelessness Assessment Re-port (AHAR) to Congress: Part 2 Estimates of Homelessness in the United States. The Department of Housing and Urban Development.
United States Congress. 2009. Homeless emergency assis-tance and rapid transition to housing act.
Weinberger, D. 2018. Don’t make artificial intelligence