Volume 2010, Article ID 525783,10pages doi:10.1155/2010/525783
Research Article
Ageing Voices: The Effect of Changes in Voice Parameters on
ASR Performance
Ravichander Vipperla, Steve Renals, and Joe Frankel
The Center for Speech Technology Research, School of Informatics, University of Edinburgh, Edinburgh EH8 9AB, UK
Correspondence should be addressed to Ravichander Vipperla,[email protected]
Received 29 May 2009; Revised 10 November 2009; Accepted 4 January 2010
Academic Editor: Vijay Parsa
Copyright © 2010 Ravichander Vipperla et al. This is an open access article distributed under the Creative Commons Attribution License, which permits unrestricted use, distribution, and reproduction in any medium, provided the original work is properly cited.
With ageing, human voices undergo several changes which are typically characterized by increased hoarseness and changes in articulation patterns. In this study, we have examined the effect on Automatic Speech Recognition (ASR) and found that the Word Error Rates (WER) on older voices is 10% absolute higher compared to those of adult voices. Subsequently, we compared several voice source parameters including fundamental frequency, jitter, shimmer, harmonicity, and cepstral peak prominence of adult and older males. Several of these parameters show statistically significant difference for the two groups. However, artificially increasing jitter and shimmer measures do not effect the ASR accuracies significantly. Artificially lowering the fundamental frequency degrades the ASR performance marginally but this drop in performance can be overcome to some extent using Vocal Tract Length Normalisation (VTLN). Overall, we observe that the changes in the voice source parameters do not have a significant impact on ASR performance. Comparison of the likelihood scores of all the phonemes for the two age groups show that there is a systematic mismatch in the acoustic space of the two age groups. Comparison of the phoneme recognition rates show that mid vowels, nasals, and phonemes that depend on the ability to create constrictions with tongue tip for articulation are more affected by ageing than other phonemes.
1. Introduction
Older people form an important user group for a variety of spoken dialogue systems. Systems with speech-based interactions can be particularly useful for older people with mobility restrictions and visual impairment. One of the main challenges in developing such systems is to build Automatic Speech Recognition (ASR) systems that give good performance on older voices.
With ageing, several changes occur in the human speech production mechanism consisting of the lungs, vocal cords, and the vocal cavities including the pharynx, mouth, and nose.
In the respiratory system, loss of elasticity [1], stiffening
of the thorax, reduction in respiratory muscle strength
[2], and loss in the diaphragm strength [3] are the most
significant changes. This leads to a reduction in forced expiratory volume and lung pressure in older people, as a result of which there is a decline in the amount of air that
moves in and out and the efficiency with which it moves
[4,5].
Changes in the larynx that occur during old age, such
as stiffening of the cartilages [6] to which the vocal cords
are attached and degeneration of intrinsic muscles [7],
reduce the ease of vocal fold adjustments during phonation
[8]. Increase in the stiffness of vocal cord cover is also
observed, leading to instability of the vocal fold vibrations
[7]. Thickening of laryngeal epithelium progressively with
age has been reported [9] which may contribute to the
lowering of fundamental frequency and increased harshness observed in older voices.
Changes observed in the vocal cavity include degener-ation of pharyngeal muscles, decline in salivary function,
loss of tongue strength and tooth loss [4,10]. Degenerative
changes are also observed in the temporomandibular joint which controls the jaw movement during speech production
[11]. These changes could considerably affect the articulation
been observed in older speakers [12], which may affect the resonance patterns in older speakers resulting in reduction of articulatory precision.
There is, however, a large variability in the extent and the rate at which voices age. Vocal ageing is not only dependent on chronological age, but also on several other factors that influence voice such as lifestyle, medical condition, smoking habits, and profession of the person.
Although there have been numerous studies on the
effects of ageing on voice, there has been limited work
to understand how these changes affect the performance
of Automatic Speech Recognition (ASR) systems. Higher Word Error Rates (WERs) of about 9–12% absolute in older voices as compared to adult voices have been reported in
[13,14]. In a study of speech recognition for the children
and older people [15], it was found that the WERs increased
dramatically for voices above 70 years of age.
Apart from the difference in acoustics, older people also appear to differ in linguistic characteristics when interacting
with Spoken Dialogue Systems (SDS) [16]. They tend to use
a lot of words compared to younger adults in their queries
and talk to systems as if they were humans [17]. This kind
of interaction style also needs to be accommodated into
the design of ASR systems [18] by appropriate language
modeling targeted towards the user age group.
The speech production mechanism can be viewed as a source filter model, where the glottal excitation represents the source and the vocal tract acts as the filter modifying the excitation to generate the desired sounds. In this article, we focus on the voice parameters that capture the source characteristics of the speech and attempt to understand the
effect of changes in these parameters on ASR accuracies. We
have compared several important voice characteristics such as the fundamental frequency, jitter, shimmer, harmonicity, and cepstral peak prominance of adult and older voices and wherever the measures differ significantly, we analysed the effect of changes in these parameters on ASR performance. We have also compared the average likelihoods of the phonemes and phoneme error rate to find out if the drop in ASR performance with ageing is due to changes in articulation patterns of a subset of the phonemes.
The organisation of the rest of this article is as follows. In Section 2, the ASR experimental setup is described and the ASR performance on adult and older voices are compared. Voice parameters of the two age groups are
compared and their effect on ASR performance is analysed
inSection 3. InSection 4, the likelihood scores and phoneme error rates for the two age groups are compared. The
results are discussed inSection 5followed by conclusions in
Section 6. Wherever suitable, the results have been shown in graphs and the relevant numbers are tabulated in the Appendix.
2. ASR Performance
2.1. Corpus. Most of the speech corpora used in ASR research have inadequate representation of older voices. The Supreme Court of the United States (SCOTUS) speech
corpus [19] was found appropriate for our experiments as
it has sufficient speech data from healthy older and adult voices. One advantage of this corpus for ASR experiments is that the recording setup for the court proceedings has remained the same over a period of time and hence the variations in noise and microphone characteristics are minimal. The other advantage is that the language used in the Supreme Court is formal and is fairly similar across all the speakers.
The SCOTUS corpus has been made public under
the Oyez project (http://www.oyez.org/). Each court case
recording’s duration is about one hour and consists of speech from the advocates and judges arguing the case. These recordings were archived on reel-to-reel tapes, which were later digitized and made public.
The recordings from later half of 1990s until 2005 have been used in our experiments. In all, the experimental corpus contains 534 recordings. It consists of speech from 10 Judges over several years and about 500 advocates. The birth dates of the Judges are known and hence their age at the time of an argument can be precisely calculated. The birth dates of the advocates are not easily available, hence wherever the birth dates were not available, their age has been approximated by using the year of their law graduation and assuming their age at graduation to be 25.
In order to obtain the sentence boundaries and speaker turn alignments in each of these one-hour-long audio recordings, forced alignment was performed on each record-ing usrecord-ing acoustic models trained on 73 hours of meetrecord-ings data recorded by the International Computer Science Insti-tute (ICSI), 13 hours of meeting corpora from the National Institute of Standards and Technology (NIST) and 10 hours
of corpora from Interactive Systems Laboratory (ISL) [20].
Using this corpus, we have built a state of the art ASR system using the Hidden Markov Model Toolkit (HTK)
(HTK version 3.4http://htk.eng.cam.ac.uk/).
2.2. Feature Extraction. The SCOTUS corpus in MP3 for-mat was first converted to 16 kHz wav forfor-mat and then parametrised using perceptual linear prediction (PLP) Cep-stral features. A window size of 25 ms and frame shift of 10 ms were used for feature extraction. Energy along with 1st and 2nd order derivatives were appended giving a 39-dimensional feature vector.
Cepstral means and variances were computed for each speaker in each recording. These were then used to normalise the feature vectors to minimise any channel introduced effects.
All speakers Male Female 0
10 20 30 40 50 60
Wo
rd
er
ro
r
ra
te
(%
)
Adult voices
Adult voices using MLLR Adult voices using VTLN
Older voices
Older voices using MLLR Older voices using VTLN Figure1: Comparison of WER on adult and older voices.
The acoustic models have been trained as cross-word context-dependent triphone Hidden Markov Models
(HMM) [21], each state modeled as 18 components Gaussian
Mixture Model (GMM) for all speech phones and 36 com-ponents GMM for nonspeech (sil & short pause) models, respectively.
2.4. Language Models. The language models were con-structed from the transcripts of 260 United States Supreme Court recordings from the 1970s comprising of about 2.5
million words. Back offbigram language models [22] were
constructed from this data. The vocabulary consists of 23445
words. The pronunciations used in the AMI vocabulary [20]
were used for those vocabulary words common to AMI and the pronunciations for the rest of the vocabulary words were
generated using the Festival speech synthesis system [23].
2.5. Test Utterances. For theadulttest set, speech utterances from 27 speakers (23 Males and 4 Females) in an age range
of 30–45 (Average: 41.3) were chosen. For theoldertest set,
speech data from 12 speakers (10 Males and 2 Females) in the age range of 60–85 (Average: 68.4) were used. The speaker set used for testing is disjoint from the training set speakers. 10 utterances (about 130 seconds on average) for each test speaker were kept aside for speaker adaptation and
the remaining utterances formed the test set. In all theadult
test set comprises of 4323 utterances (12.5 hours) and the
oldertest set comprises of 6410 utterances (18 hours). The
perplexity [22] of the language model on theadulttest set is
178.3 with Out Of Vocabulary (OOV) rate of 3.8% and on theoldertest set is 169.7 with OOV rate of 4.3%.
2.6. ASR Word Error Rates. The ASR word error rates on
adult and older test sets are seen in Figure 1. The results
show a significant difference of 10% absolute higher WERs for older voices as compared to adult voices. The WERs difference for males is 8.7% absolute while for females it is 13.7%. The differences in WERs are statistically significant withP < .001 using the Mann-Whitney test [24].
Speaker adaptation and speaker normalisation
tech-niques are often used to improve ASR performance [25].
We have used the standard Maximum Likelihood Linear
Regression (MLLR) mean adaptation [26] to see if speaker
adaptation can alleviate age-induced errors in ASR. Using the adaptation set of 10 utterances for each speaker, MLLR transforms were computed for each speaker and used in decoding the test utterances. One of the main sources of interspeaker variability in acoustic features is the variation in vocal tract dimensions. Vocal Tract Length Normalisation (VTLN) is a standard approach used to overcome this variability. Vocal tract length normalised acoustic models were constructed using an iterative approach as described
in [27]. Using the normalised models, warping factors were
estimated for each of the test speakers from the adaptation set utterances.
From Figure 1, we observe that though speaker adap-tation and speaker normalisation improve the recognition performance marginally, the gap between the WERs for adult and older voices is not bridged. The results for females may
not be a true representation of the difference as the sample
set is very small, but overall the difference in WERs seems to
be large enough for investigation into the possible causes.
3. Voice Parameter Analysis
Since the number of female speakers in the corpus is very small, we used only the male speakers test set for voice analysis. This also helps to keep the analysis free from gender-related effects. We have analysed and compared the samples of phoneme “aa” from adult and older male speakers.
Voice analysis is typically carried out on sustained vowel pronunciations in a noise-free recording environment. However the SCOTUS corpus is spontaneous speech with a considerable amount of background noise. Being spon-taneous in nature, the corpus also does not have sustained vowel pronunciations with durations over few seconds. Most of the samples of the vowels are typically a fraction of a second long and are part of a longer utterance. In order to pick the best available instances of the phoneme “aa” from the speech the following procedures were used.
(1) Each utterance was force aligned to triphone tran-scription, in order to determine the frame boundaries and the likelihood of each triphone in the utterance. (2) All the triphone samples with the centre phoneme
“aa” were selected.
(3) Out of the selected samples, the ones with negative log likelihood greater than a threshold of 1000 were rejected.
In all, 2970 samples of “aa” from 23 adult male speakers and 2105 samples from 10 older male speakers were used for voice analysis. Several voice parameters such as the fundamental frequency, jitter, shimmer, and harmonicity measures were computed for the selected samples using
“Praat” [28].
Apart from these parameter computations on sustained vowels, using complete speech utterances cepstral peak prominence measures and speaking rates were computed and analysed.
Each of the following subsections deals with one voice
parameter analysing if there is a significant difference in the
parameter value between adult and older speakers. Wherever the difference is significant, we artificially modify those parameters in clean speech to analyse the effect on ASR performance.
3.1. Fundamental Frequency (F0). Among the several
param-eters affected by ageing, the fundamental frequency F0 has
been one of the most extensively studied. There is no general
agreement on the trend of changes in F0 due to ageing.
While results reported in [29,30] indicate that theF0reduces
significantly by about 40–60 Hz for both males and females
above 60 years of age, the results reported in [4,31] suggest
thatF0decreases in females after menopause but in males,
it decreases till a certain age around 60 years and increases again.
The results of the analysis of fundamental frequency
are tabulated in Table 1. We observe that the fundamental
frequencies for older voices are about 15 Hz (10%) lower
than those of adult male voices. The differences in F0
measures are statistically significant atP < .001 using
Mann-Whitney rank sum test.
In order to understand the effect of reduction in F0
on ASR performance, we artificially reduce the F0 by 10%
and compare the WERs of the original waveforms and modified waveforms. The factor of 10% was used to reflect the difference in adult and older voices. For this experiment,
the ASR system is the same as that described inSection 2.
We use 400 utterances from 8 adult speakers (4 Males and 4 Females) as the test set. For each waveform, the pitch tier is calculated using using Praat. The frequencies are then scaled to 0.9 of their original value. Using the new pitch tier, the waveforms are resynthesized using pitch synchronous
overlap and add (PSOLA) method [32]. Figure 2shows an
example of the waveforms andF0contours before and after
pitch manipulation.
The word error rates before and after reduction in
pitch are given in Table 2. The WER increases by 1.1%
absolute to 33.2% and is statistically significant with P <
.001 using the Matched pair sentence segment word error
(MAPSSWE) test [33]. In order to be able to attribute the
increase in WER to the change in fundamental frequency and not to the resynthesis process, we repeated the resynthesis process described above without modifying the pitch tier. The WER for the resynthesized waveforms is 32.0 and the difference with respect to the original waveform is
statistically insignificant with P = .61 using MAPSSWE
test.
1.819 1.9 1.98 2.061
−22 22
×10−2
Time (s)
A
m
plitude
(a) Original: Waveform
1.819 1.9 1.98 2.061
−22 22
×10−2
Time (s)
A
m
plitude
(b)F0Modified: Waveform
1.819 1.9 1.98 2.061
50 80 110 140 170 200
Time (s)
F0
(Hz)
(c) Original:F0contour
1.819 1.9 1.98 2.061
50 80 110 140 170 200
Time (s)
F0
(Hz)
(d) Modified:F0contour Figure2: Modification inF0.
Table1:F0Analysis.
F0 Adult Males Older Males P-value
Mean Std Mean Std
MedianF0 144.4 44.3 128.2 45.4 <.001
MeanF0 143.9 43.2 128.0 44.6 <.001
Table2: Word Error Rate with artificial reduction inF0.
Word Error Rate (WER) %
Original Reduced pitch P-value Without VTLN 32.1 33.2 <.001 with VTLN 28.8 29.5 <.01
We also perform VTLN calculating the warping factors for each speaker separately for the two sets. Using VTLN, the
difference in WER is reduced to 0.7% absolute at P < .01
using MAPSSWE test.
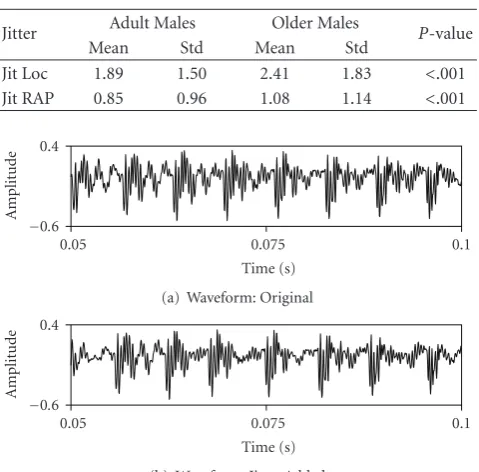
Table3: Jitter analysis.
Jitter Adult Males Older Males P-value Mean Std Mean Std
Jit Loc 1.89 1.50 2.41 1.83 <.001 Jit RAP 0.85 0.96 1.08 1.14 <.001
0.05 0.075 0.1
−0.6 0.4
Time (s)
A
m
plitude
(a) Waveform: Original
0.05 0.075 0.1
−0.6 0.4
Time (s)
A
m
plitude
(b) Waveform: Jitter Added Figure3: Artificial increase in Jitter.
fold vibrations. It correlates with the hoarseness in voice. Increased jitter with age has been observed in both males and females [4,34].
For our analysis, the following Jitter measurements as
defined in Praat [28] were computed.
(i)Jitter Local (Jit Loc)is the percentage ratio of average absolute distance between consecutive periods to the average period.
(ii)Jitter Relative Average Perturbation (Jit RAP) is the ratio of average absolute difference between a period and the average of it and its two neighbours, to the average period.
Since the durations of the analysed segments of speech is small, jitter measures that are averaged over larger number of cycles have not been compared.
The variations of each of these jitter measurements are
shown inTable 3. The changes are statistically significant at
P < .001 using Mann-Whitney rank sum test.
In order to understand the effect of increased jitter on ASR performance, we artificially introduce jitter into the 400 test waveforms from 8 speakers.
Pulse positions representing the glottal closures are extracted from the speech utterances. Each pulse position
PPoldis then perturbed to get a new pulse positionPPnewas follows
PPnew=PPold+r∗α∗Tavg, (1)
where−0.5 ≤ r ≤ 0.5 is a uniformly distributed random
variable,αis a factor controlling the maximum perturbation
allowed as a fraction of the average periodTavg.
Table4: WER: Artificial increase in jitter.
Word Error Rate (WER) %
Original α=0.05 α=0.10 32.1 32.2 (P=.62) 32.4 (P=.17)
Table5: Shimmer analysis.
Shimmer Adult Males Older Males P-value Mean Std Mean Std
Shim Loc 10.73 5.22 11.33 5.27 <.001 Shim APQ3 4.65 2.70 4.93 2.88 <.001
Using these new pulse positions, the waveform is resyn-thesized by pitch synchronous overlap and add method to get
a waveform with increased jitter.Figure 3shows an example
of the waveforms before and after artificial increase in jitter.
Maximum temporal perturbations of 5% (α = 0.05)
and 10% (α = 0.10) were introduced into the waveforms.
Table 4shows the ASR WERs on the original waveforms and
the waveforms with increased jitter. With α = 0.10, the
waveforms sound very hoarse, yet the change in WER with increased jitter is statistically insignificant (using MAPSSWE test) and the ASR system performance is seen to be quite robust to jitter variations.
3.3. Shimmer. Shimmer is a measure of variability of the peak-to-peak amplitude of the signal. This measure also correlates with hoarseness in voice. Shimmer has been
found to have a strong correlation with age [29]. Amplitude
perturbations have been reported to increase during old age in [4,34,35].
For our study, the following Shimmer measures were computed using Praat.
(i)Shimmer Local (Shim Loc)is the percentage ratio of the average absolute difference between the tudes of consecutive periods to the average ampli-tude.
(ii)Shimmer Three point Amplitude Perturbation Quo-tient (Shim APQ3)is the average absolute difference between the amplitude of a period and the average of the amplitudes of its neighbours, divided by the average amplitude.
Table 5shows that the shimmer measures for older males are higher compared to the adult males and the results are
statistically significant (withP < .001 using Mann-Whitney
rank sum test).
We artificially introduce shimmer in the test waveforms
to understand the effect of increased shimmer on ASR
performance. Pulse positions representing glottal closures are extracted for each test waveform. From the location of the pulse positions, the voiced and unvoiced segments in speech
are determined. To simulate shimmer effects, the speech
samplesxoldbetween two adjacent pulses in voiced segment
are scaled to obtainxnewas follows
1.913 1.943
−24
−−16 8 0 8 16
×10−2
Time (s)
A
m
plitude
(a) Waveform: Original
1.913 1.943
−24
−−16 8 0 8 16
×10−2
Time (s)
A
m
plitude
(b) Waveform: Shimmer Added Figure4: Artificial increase in Shimmer.
Table6: WER: Artificial increase in shimmer.
Word Error Rate (WER) %
Original α=0.05 α=0.10 32.1 32.1 (P=.65) 32.1 (P=.13)
where−0.5 ≤ r ≤ 0.5 is a uniformly distributed random
variable which is fixed for all the speech samples between two
adjacent pulses, andαis a factor controlling the maximum
perturbation allowed.
An example of the waveform before and after artificial
introduction of shimmer is seen inFigure 4. (Examples of the
original and modified waveforms can be accessed fromhttp:
//homepages.inf.ed.ac.uk/s0680896/atypicalSpeech/) Table 6 shows that perturbations in amplitude between
adjacent periods do not affect the ASR accuracies
signifi-cantly.
3.4. Harmonicity. Another voice quality associated with ageing is breathiness. Breathiness is thought to arise due to incomplete glottal closure during closed phase of the phonatory cycle. The nearly sinusoidal shape of the breathy glottal waveforms is responsible for the increase in the
relative amplitude of the first harmonic [36]. Breathy signals
tend to have more high frequency energy than normally
phonated signal [37]. Breathy speech also tends to be less
periodic, especially in the mid and high frequencies where
aspiration noise is large [38].
Harmonic-to-Noise Ratio (HNR) measures the signal-to-noise ratio in a periodic waveform and acts as a good indicator of voice quality. It is computed as the ratio of the noise to the energy of the signal in the periodic part of the
signal [39]. An increase in Noise-to-Harmonic Ratio (NHR)
values in older voices has been reported in [29].
The results of the analysis of autocorrelation (Autocorr)
and NHR in our experiments are tabulated inTable 7.
0 0.01 0.02 0.03 0.04 0.05 0.06 0.07 0.08 0.09 0.1
−1.5
−1
−0.5 0 0.5 1 1.5
Time (s)
A
m
plitude
Waveform
(a)
0 500 1000 1500 2000 2500 3000 3500 4000 4500 5000
−50 0 50 100
Frequency (Hz)
M
ag
nitude
(dB)
Spectrum
(b)
0.005 0.01 0.015 0.02
−20 0 20 40
Cepstral peak CPP=27.3−10.6
=16.7dB
Regression line
Quefrency (s)
Cepst
ral
mag
nitude
(dB)
Cepstrum
(c)
Figure5: Illustration of Cepstral Peak Prominence.
A measure that correlates well with breathiness in voice is Cepstral Peak Prominence (CPP) proposed by Hillenbrand
and Houde [36]. The cepstrum is a Fourier analysis of
the logarithmic amplitude spectrum of a signal. When the log amplitude of the spectrum contains regularly spaced harmonics, the Fourier analysis of the spectrum then captures the periodicity in the spectrum and will show a peak at a quefrency corresponding to the spacing between the harmonics. The cepstral peak reflects both the level of harmonic structure in the signal and the overall amplitude of the signal. To normalise for overall amplitude, a linear regression line is calculated relating quefrency to cepstral magnitude. The CPP measure is the difference in amplitude (in dB) between the cepstral peak and the value of the
regression line at the cepstral peak (illustrated inFigure 5).
CPP is computed on frames of 10 ms and averaged over all the frames in an utterance. CPP values for breathy voices are lower than those for normal voice since the cepstral peak is expected to be smaller in breathy voices due to loss of periodic structure in higher frequencies of the spectrum.
Table7: Harmonicity analysis.
Harmonicity Adult Males Older Males P-value Mean Std Mean Std
Autocorr 0.85 0.08 0.85 0.09 .61
NHR 0.21 0.15 0.21 0.16 .79
CPP 10.81 0.83 10.69 0.82 <.001 CPPS 2.71 0.43 2.69 0.40 <.05
are applied. First the cepstrum is averaged across time by replacing an unsmoothed cepstrum at a time frame with the average of itself and the adjacent cepstral frames. A second level of smoothing is then applied by a running average of the cepstral magnitude across quefrency for each cepstral frame. We computed CPP and CPPS for all the test utter-ances of adult and older speech and the average values
are shown in Table 7 (The program cpps.exe available at
http://homepages.wmich.edu/∼hillenbr/ has been used for the computation of CPP and CPPS measures).
It is observed that the differences in the harmonicity measures of adult and older voices are statistically insignifi-cant (by Mann Whitney rank sum test). Though the changes in CPP and CPPS measures are found to be statistically significant, the actual difference in the values is very small.
CPPS, which has been reported [36] to be better correlated
with perceived breathiness in voice than CPP, differs only by a value of 0.02 for the two age groups. This coupled with the comparative results of NHR suggests that the difference in breathiness chracteristics of adult and older test sets used in
our experiments do not differ much.
4. Phoneme Acoustic Likelihoods and
Phoneme Recognition Rates
From the results inSection 3, most of the changes in voice
source parameters seem to have a negligible effect on the ASR performance. The changes in the articulation pattern
during old age could be a strong factor that affects the
ASR performance. It is hence of interest to see if ageing
affects the recognition performance of certain phonemes
more than others. Comparing the average log likelihood of each phoneme for adult and older speech is likely to give a good indication of the mismatch between the features.
In order to compare the likelihoods, all the test utterances
(of adult and older male voices) as described in Section 2
were first force aligned to the triphone transcription. The left and right contextcs in the triphones were stripped and the average negative log likelihood per frame for the centre phoneme for each age group was computed.
Figure 6shows that the likelihood scores for older voices are consistently lower than those of adult voices for all the
phonemes. The difference is statistically significant atP < .01
for all phonemes except “oy” for which it is insignificant. We also observe that the variations in likelihood scores for each phoneme of older voices are higher than those for adult voices indicating a larger variability in the pronunciations of all phonemes.
Table8: Comparison of Word Error Rate on adult and older voices. (seeFigure 1).
Word Error Rate (WER) %
Adult voices Older voices P-value
Overall 30.4 40.4 <.001
Male 30.1 38.8 <.001
Female 32.4 46.1 <.001
Table 9: Comparison of Word Error Rate using MLLR speaker adaptation on adult and older voices. (seeFigure 1).
Word Error Rate (WER) %
Adult voices Older voices P-value
Overall 29.6 38.7 <.001
Male 29.5 38.1 <.001
Female 30.0 41.0 <.001
Table10: Comparison of Word Error Rate using Vocal Tract Length Normalisation on adult and older voices. (seeFigure 1).
Word Error Rate (WER) %
Adult voices Older voices P-value
Overall 28.7 38.6 <.001
Male 28.7 37.9 <.001
Female 28.2 41.3 <.001
These results indicate that there is a mismatch in the acoustic models (which are trained on speech dominated by adult voices) and feature space of older voices. These results
are consistent with the findings in [13] where for an older
test set, acoustic models trained on older voices resulted in about 3–5% absolute improvement in WER over acoustic models trained on younger adult speech. The mismatch in the acoustic space of younger and older people has also been
exploited in speaker age group classification tasks [40,41].
To get a picture of the ASR accuracies for individual phonemes for the two age groups, we trained monophone models, each phoneme modeled as a three-state HMM with 18 Gaussian components per state. A phone loop decoder was used to generate the phoneme sequence hypothesis for the test utterances of the two groups. Percentages of correct
recognition for each phoneme is shown inFigure 7.
We observe that the phonemes that are most affected are “aa”, “ae”, “ao”, “aw”, and “er” with over 10% drop in the recognition rates. These phonemes form the mid vowels where the tongue hump position is located in the central region of the mouth and the jaw is lowered relatively more than that for other phonemes. “hh” is a whisper sound which also has over 10% lower recognition rates for older voices. The nasals (“m”, “n”, “ng”) have about 3–5% decrease in recognition rates. The phonemes in which the tongue forms a constriction near the upper teeth (“t”, “th”, “r”, and “l”) have a drop of around 4% in the recognition rates. The other
phonemes that have a drop of around 5% are the affricate
aa ae ah ao aw ax ay b ch d dh eh er ey f g hh ih iy jh k l m n ng ow oy p r s sh t th uh uw v w y z zh 0
10 20 30 40 50 60 70 80 90
N
egati
ve
log
lik
elihood
(per
fr
ame)
Adult males Older males
Figure6: Average phoneme negative log likelihood per frame.
aa ae ah ao aw ax ay b ch d dh eh er ey f g hh ih iy jh k l m n ng ow oy p r s sh t th uh uw v w y z zh 0
10 20 30 40 50 60 70 80 90 100
Cor
re
ct
(%
)
Adult males Older males
Figure7: Phoneme recognition (% Correct).
These results suggest that certain phonemes that are mainly dependent on the pronounced jaw movement and certain tongue movements (creating a constriction with mid-dle of the tongue and the tongue tip) for clear articulation are
the worst affected in terms of ASR accuracy.
5. Discussion
Many of the voice analysis measures reported in this article are somewhat higher than the published values in diagnostic medical research. This is due to the fact that we have not used sustained vowel pronunciations in clean recording con-ditions, but extracted sustained phones from spontaneous
speech. Due to chunking, there is also a co-articulation effect
at the beginning and the end of each analysed phone sample. However the same procedure has been applied to both adult and older voices in similar recording environments to analyse the differences between the two groups. Indeed our analysis is relevant in this context as it is made on natural speech which is the typical input to ASR systems.
Jitter and Shimmer measures have been extensively studied and have been used by researchers in age recognition from voice. From our experimental results too, we observe a clear increase in jitter and shimmer values for older voices. These measures can work well for the detection of older voices. In automatic speech recognition, the human speech production mechanism is seen as a source filter model,
where vocal fold vibrations act as source forcing air out of the vocal tract channel to generate speech. Front end feature extraction techniques in ASR such as perceptual linear prediction used in our experiments are quite robust and suppress the variations in the source characteristics.
Language modeling plays a significant role in the per-formance of ASR systems and hence needs to be taken in account when comparing ASR performances. However due to the nature of the corpus (being court case arguments), linguistic characteristics do not vary much across speakers.
The results of the phoneme likelihood scores indicate that there is a mismatch in the acoustic space of adult and older voices. Training acoustic models for a particular age group are likely to improve the ASR accuracies for that group but are likely to degrade the performance for another age group. A suitable solution in such a scenario, where speakers from different age groups form the users of an ASR system, is to train gender and age group specific acoustic models and to allow the system to pick the acoustic model that maximises the likelihood score as the user speaks.
6. Conclusion
Table11: Likelihood scores (Negative log likelihood per frame) and Correct recognition percentages of all the phonemes (see Figures6
and7).
Phoneme
Negative Log Likelihood Correct (%) Adult Older
Adult Older Mean Std Mean Std
aa 65.7 7.1 67.0 7.1 67.5 52.8 ae 66.9 6.9 67.7 7.2 53.2 41.5 ah 68.0 6.0 69.2 6.7 56.8 59.3 ao 66.7 6.7 67.9 6.9 69.3 58.6 aw 65.5 6.1 66.2 6.7 73.2 57.5 ax 67.3 5.9 68.6 6.2 46.6 46.8 ay 66.1 7.0 66.6 7.2 76.1 73.9 b 66.0 6.2 67.8 7.4 67.5 68.0 ch 66.4 5.9 67.3 5.4 76.2 73.3 d 67.7 6.1 69.1 6.7 48.3 50.3 dh 67.4 5.7 69.2 6.1 61.2 60.8 eh 66.7 6.5 67.3 7.0 54.7 54.8 er 66.0 6.4 67.8 6.8 67.8 57.6 ey 63.3 6.6 64.4 6.9 79.3 78.4 f 62.4 5.8 64.4 6.3 83.8 79.4 g 68.2 5.9 70.2 6.1 67.9 73.3 hh 67.8 6.0 69.7 6.5 70.3 59.5 ih 67.8 6.1 68.7 6.3 50.7 49.2 iy 65.7 6.5 66.3 6.9 74.0 71.6 jh 68.0 5.2 68.8 5.6 73.1 67.7 k 67.1 5.7 69.4 6.5 69.7 70.1 l 66.9 6.2 68.7 7.0 64.3 60.2 m 65.2 6.2 67.2 6.7 76.2 73.1 n 66.5 6.3 67.6 6.7 65.7 61.7 ng 65.8 6.1 67.3 6.8 78.1 72.6 ow 67.3 6.6 68.4 7.2 67.8 70.4 oy 67.7 5.4 67.8 5.3 82.4 81.9 p 64.8 5.5 66.2 6.3 72.3 70.6 r 67.5 6.5 68.5 6.9 64.0 60.1 s 64.8 5.9 66.4 6.5 80.1 80.1 sh 62.4 5.8 63.6 6.0 82.1 83.8 t 67.5 6.2 69.0 6.8 41.3 37.1 th 66.1 6.3 68.4 6.6 54.4 50.0 uh 69.6 6.2 70.2 6.5 74.4 74.5 uw 65.7 6.5 67.8 7.2 69.9 68.7 v 64.9 5.8 66.0 6.2 63.9 62.2 w 67.5 6.2 68.9 7.1 81.1 79.0 y 66.7 6.6 68.1 7.0 78.5 77.7 z 66.6 5.7 68.0 6.0 72.4 68.0 zh 64.3 5.8 66.1 6.5 80.2 80.0
jitter and shimmer measures show statistically significant differences in adult and older voices. Even though older voices show increased Jitter and Shimmer, these measures do not appear to effect the ASR performance significantly. Average phoneme likelihood scores indicate that older voices are not as well matched to the acoustic models as adult
voices. This could possibly be overcome by the selection of training data targeted towards the domain of older speakers. Phoneme accuracy results also indicate that mid vowels, nasals, and phonemes requiring constriction with the tongue tip are more affected than other phonemes as a result of ageing.
Appendix
Results tables for the graphs in various sections of this article
are listed in Tables8,9,10, and11.
Acknowledgments
This research was funded by SFC SRDG grant—HR04016: MATCH (Mobilising Advanced Technologies for Care at Home). This work has made use of the resources pro-vided by Edinburgh Compute and Data Facility (ECDF) (http://www.ecdf.ed.ac.uk/). The ECDF is partially
sup-ported by the eDIKT initiative (http://www.edikt.org.uk/).
The authors would like to thank Dr. Maria Wolters for reviewing the article and providing suggestions for improve-ment.
References
[1] D. A. Mahler, R. A. Rosiello, and J. Loke, “The aging lung,”
Clinics in Geriatric Medicine, vol. 2, no. 2, pp. 215–225, 1986. [2] J. Kahane, “Anatomic and physiologic changes in the aging
peripheral speech mechanism,” in Aging Communication Processes and Disorders, pp. 21–45, Grune & Stratton, New York, NY, USA, 1981.
[3] K. Tolep, N. Higgins, S. Muza, G. Criner, and S. G. Kelsen, “Comparison of diaphragm strength between healthy adult elderly and young men,”American Journal of Respiratory and Critical Care Medicine, vol. 152, no. 2, pp. 677–682, 1995. [4] V. Linville, Vocal Aging, Singular Thomson Learning, San
Diego, Calif, USA, 2001.
[5] L. O. Ramig, S. Gray, K. Baker, et al., “The aging voice: a review, treatment data and familial and genetic perspectives,”
Clinical Linguistics and Phonetics, vol. 53, no. 5, pp. 252–265, 2001.
[6] F. P. Paulsen and B. N. Tillmann, “Degenerative changes in the human cricoarytenoid joint,”Archives of Otolaryngology, Head & Neck Surgery, vol. 124, no. 8, pp. 903–906, 1998.
[7] M. T. Rodeno, J. M. S´anchez-Fern´andez, and J. M. Rivera-Pomar, “Histochemical and morphometrical ageing changes in human vocal cord muscles,”Acta Oto-Laryngologica, vol. 113, no. 3, pp. 445–449, 1993.
[8] M. Hirano, S. Kurita, and S. Sakaguchi, “Ageing of the vibra-tory tissue of human vocal folds,”Acta Oto-Laryngologica, vol. 107, no. 5-6, pp. 428–433, 1989.
[9] K. Sato and M. Hirano, “Age-related changes of elastic fibers in the superficial layer of the lamina propria of vocal folds,”
Annals of Otology, Rhinology and Laryngology, vol. 106, no. 1, pp. 44–48, 1997.
[10] P. Rother, B. Wohlgemuth, W. Wolff, and I. Rebentrost, “Morphometrically observable aging changes in the human tongue,”Annals of Anatomy, vol. 184, no. 2, pp. 159–164, 2002. [11] B. Weinstein, “The biology of aging,” inGeriatric Audiology,
[12] S. A. Xue and G. J. Hao, “Changes in the human vocal tract due to aging and the acoustic correlates of speech production: a pilot study,”Journal of Speech, Language, and Hearing Research, vol. 46, no. 3, pp. 689–701, 2003.
[13] A. Baba, S. Yoshizawa, M. Yamada, A. Lee, and K. Shikano, “Acoustic models of the elderly for large-vocabulary contin-uous speech recognition,”Electronics and Communications in Japan, Part II, vol. 87, no. 7, pp. 49–57, 2004.
[14] R. Vipperla, S. Renals, and J. Frankel, “Longitudinal study of ASR performance on ageing voices,” inProceedings of the 9th Annual Conference of the International Speech Communication Association (INTERSPEECH ’08), pp. 2550–2553, Brisbane, Australia, September 2008.
[15] J. G. Wilpon and C. N. Jacobsen, “A study of speech recognition for children and the elderly,” inProceedings of the IEEE International Conference on Acoustics, Speech and Signal Processing (ICASSP ’96), vol. 1, pp. 349–352, Atlanta, Ga, USA, 1996.
[16] S. M¨oller, F. G¨odde, and M. Wolters, “Corpus analysis of spo-ken smarthome interactions with older users,” inProceedings of the 6th International Language Resources and Evaluation (LREC ’08), Marrakech, Morocco, May 2008.
[17] M. Wolters, K. Georgila, S. MacPherson, and J. Moore, “Being old doesn’t mean acting old: older users’ interaction with spoken dialogue systems,” ACM Transactions on Accessible Computing, vol. 2, no. 1, pp. 1–39, 2009.
[18] R. Vipperla, M. Wolters, K. Georgila, and S. Renals, “Speech input from older users in smart environments: challenges and perspectives,” inProceedings of the 5th International Con-ference on Universal Access in Human-Computer Interaction (UAHCI ’09), vol. 5615 ofLecture Notes in Computer Science, pp. 117–126, Springer, San Diego, Calif, USA, 2009.
[19] J. Yuan and M. Liberman, “Speaker identification on the SCOTUS corpus,” inProceedings of Acoustics, pp. 5687–5690, 2008.
[20] T. Hain, L. Burget, J. Dines, et al., “The 2005 AMI system for the transcription of speech in meetings,” inProceedings of the Rich Transcription (RT ’05), vol. 3869 ofLecture Notes in Computer Science, 2005.
[21] L. R. Rabiner, “Tutorial on hidden Markov models and selected applications in speech recognition,”Proceedings of the IEEE, vol. 77, no. 2, pp. 257–286, 1989.
[22] D. Jurafsky and J. H. Martin,Speech and Language processing: An Introduction to Natural Language Processing, Computa-tional Linguistics, and Speech Recognition, Prentice Hall, Upper Saddle River, NJ, USA, 2nd edition, 2008.
[23] P. Taylor, A. W. Black, and R. Caley, “The architecture of the Festival speech synthesis system,” in Proceedings of the 3rd ESCA Workshop on Speech Synthesis, pp. 147–151, 1998. [24] H. Mann and D. Whitney, “On a test whether one of two
random variables is stochastically larger than the other,”The Annals of Mathematical Statistics, vol. 18, pp. 50–60, 1947. [25] M. Gales and S. Young, “The application of hidden Markov
models in speech recognition,” Foundations and Trends in Signal Processing, vol. 1, no. 3, pp. 195–304, 2007.
[26] C. J. Leggetter and P. C. Woodland, “Maximum likelihood linear regression for speaker adaptation of continuous density hidden Markov models,”Computer Speech and Language, vol. 9, no. 2, pp. 171–185, 1995.
[27] G. Garau, S. Renals, and T. Hain, “Applying vocal tract length normalization to meeting recordings,” inProceedings of the 9th European Conference on Speech Communication and Technology (INTERSPEECH ’05), pp. 265–268, 2005.
[28] P. Boersma and D. Weenink, “Praat: doing phonetics by computer (Version 5.0.36) [Computer program],” October 2008,http://www.praat.org/.
[29] S. A. Xue and D. Deliyski, “Effects of aging on selected acoustic voice parameters: preliminary normative data and educational implications,”Educational Gerontology, vol. 27, no. 2, pp. 159– 168, 2001.
[30] W. Endres, W. Bambach, and G. Fl¨osser, “Voice spectrograms as a function of age, voice disguise, and voice imitation,”
Journal of the Acoustical Society of America, vol. 49, no. 6, pp. 1842–1848, 1971.
[31] S. Sch¨otz and C. M¨uller, “A study of acoustic correlates of speaker age,” inSpeaker Classification II, pp. 1–9, Springer, Berlin, Germany, 2007.
[32] E. Moulines and F. Charpentier, “Pitch-synchronous wave-form processing techniques for text-to-speech synthesis using diphones,”Speech Communication, vol. 9, no. 5-6, pp. 453– 467, 1990.
[33] L. Gillick and S. J. Cox, “Some statistical issues in the comparison of speech recognition algorithms,” inProceedings of the IEEE International Conference on Acoustics, Speech and Signal Processing (ICASSP ’89), vol. 1, pp. 532–535, May 1989. [34] L. A. Ramig and R. L. Ringel, “Effects of physiological aging on selected acoustic characteristics of voice,”Journal of Speech and Hearing Research, vol. 26, no. 1, pp. 22–30, 1983. [35] M. Bruckl and W. Sendlmeier, “Aging female voices: an
acoustic and perceptive analysis,” in Proceedings of ISCA Tutorial and Research Workshop on Voice Quaility Functions, Analysis and Synthesis (VOQUAL ’03), pp. 163–168, Geneva, Switzerland, 2003.
[36] J. Hillenbrand and R. A. Houde, “Acoustic correlates of breathy vocal quality: dysphonic voices and continuous speech,”
Journal of Speech, Language, and Hearing Research, vol. 39, no. 2, pp. 311–321, 1996.
[37] R. J. Klich, “Relationships of vowel characteristics to listener ratings of breathiness,”Journal of Speech and Hearing Research, vol. 25, no. 4, pp. 574–580, 1982.
[38] J. Hillenbrand, R. A. Cleveland, and R. L. Erickson, “Acoustic correlates of breathy vocal quality,” Journal of Speech and Hearing Research, vol. 37, no. 4, pp. 769–778, 1994.
[39] P. Boersma, “Accurate short-term analysis of the fundamental frequency and the harmonics-to-noise ratio of a sampled sound,”Proceedings of the Institute of Phonetic Sciences, pp. 97– 110, 1993.
[40] C. M¨uller and F. Burkhardt, “Combining short-term cepstral and longterm prosodic features for automatic recognition of speaker age,” inProceedings of the 8th Annual Conference of the International Speech Communication Association (INTER-SPEECH ’07), pp. 2277–2280, 2007.