University of New Orleans Theses and
Dissertations Dissertations and Theses
5-16-2003
Data Visualization for the Benchmarking Engine
Data Visualization for the Benchmarking Engine
Sudha Joish
University of New Orleans
Follow this and additional works at: https://scholarworks.uno.edu/td
Recommended Citation Recommended Citation
Joish, Sudha, "Data Visualization for the Benchmarking Engine" (2003). University of New Orleans Theses and Dissertations. 19.
https://scholarworks.uno.edu/td/19
This Thesis is protected by copyright and/or related rights. It has been brought to you by ScholarWorks@UNO with permission from the rights-holder(s). You are free to use this Thesis in any way that is permitted by the copyright and related rights legislation that applies to your use. For other uses you need to obtain permission from the rights-holder(s) directly, unless additional rights are indicated by a Creative Commons license in the record and/or on the work itself.
DATA VISUALIZATION FOR THE BENCHMARKING ENGINE
A Thesis
Submitted to the Graduate Faculty of the
University of New Orleans
in partial fulfillment of the
requirements for the degree of
Master of Science
in
The Department of Computer Science
by
Sudha Joish
B.Tech., University of Madras, India, 2001
This thesis is dedicated to the
proposition that
the harder you work, the luckier you get.
TABLE OF CONTENTS
TABLE OF CONTENTS...iii
ACKNOWLEDGEMENTS...iv
LIST OF FIGURES ... v
LIST OF TABLES...vi
ABSTRACT...vii
Chapter 1. INTRODUCTION... 1
1.1. Background... 1
1.2. Objectives ... 2
1.3. Overview ... 2
Chapter 2. CONCEPTS OF CHARTVISIO ... 3
2.1. Levels of users ... 3
2.2. Problem Definition ... 4
2.3. ChartVisio solution to the problem... 5
Chapter 3. ARCHITECTURE AND DESIGN ... 7
3.1. Technical Architecture ... 7
3.2. Basic Technology ... 8
3.3. Functional Architecture ... 9
3.4. Mapping data from tables to charts ... 11
Chapter 4. USER INTERFACE DESIGN ... 14
4.1. View saved charts... 14
4.2. Design new charts... 17
Chapter 5. IMPLEMENTATION ... 28
5.1. JSP Components ... 28
5.2. Java Servlet Components... 34
Chapter 6. CONFIGURATION FILES AND UTILITY CLASSES ... 42
6.1. Configuration files... 42
6.2. Utility classes... 43
7. CONCLUSION... 47
GLOSSARY ... 48
REFERENCES ... 50
VITA... 52
ACKNOWLEDGEMENTS
My gratitude and thanks are due to my advisor, Dr Markus Montigel, for his continual guidance, interest and helpful suggestions in the formation and completion of this project.
I have received invaluable support from my husband, Rajesh Joish, who believed in me as I slogged along and encouraged me when I felt lost.
My thanks also go out to my friend and colleague, Sudhindra Sharatkumar, for his help and cooperation throughout the project.
And I would also like to thank my family for being there for me always.
LIST OF FIGURES
Figure 2.1. User roles in the application ... 3
Figure 2.2. Tables and their relationship... 4
Figure 2.3. Chart generated using Chart Visio for the given problem ... 6
Figure 3.1. Technical architecture of the application... 8
Figure 3.2. Functional architecture of the application ... 10
Figure 3.3. Tables and their relationship... 11
Figure 3.4. Chart generated using ChartVisio for the given problem ... 13
Figure 4.1. Snapshot of Charting.jsp component... 14
Figure 4.2. Snapshot of LoadChart.jsp component... 15
Figure 4.3. Sequence involved in viewing a saved chart ... 16
Figure 4.4. Snapshot of Charting.jsp component... 17
Figure 4.5. Snapshot of NewChart.jsp component ... 18
Figure 4.7. Snapshot of PickTable2.jsp component... 20
Figure 4.8. Snapshot of PickRecords.jsp component... 21
Figure 4.9. Snapshot of BadQuery.jsp component ... 22
Figure 4.10. Snapshot of ProcessQuery.jsp component... 23
Figure 4.11 Snapshot of PickXAxis.jsp component ... 25
Figure 4.12 Snapshot of OptionsPage.jsp component ... 26
Figure 4.13 Sequence Diagram in creation of new charts ... 27
Figure 5.1. Example of an XML created using StoreChartServlet ... 36
Figure 5.2. Sequence diagram describing the interaction amongst internal components ... 41
Figure 6.1. Example of a DB_config.properties file... 42
Figure 6.2. Example of an XML_config.properties file... 42
Figure 6.3. Example of a Logger_config.properties file... 43
Figure 6.4. Sample code to create SessionController instance ... 44
Figure 6.5. Sample code with get ( ) and set ( ) methods in SessionController ... 44
Figure 6.6. Sample code to set an attribute value ... 45
Figure 6.7. Sample code to get an attribute value... 45
LIST OF TABLES
Table 2.1. Result of a sample problem... 5
Table 3.1. Sample data for table Ships... 11
Table 3.2. Sample data for Equipment... 12
Table 3.3. Sample data for Equipment Hours... 12
ABSTRACT
In today’s information age, data collection is not the ultimate goal; it is simply the first step in extracting knowledge-rich information to shape future decisions. In this thesis, we present ChartVisio - a simple web-based visual data-mining system that lets users quickly explore databases and transform raw data into processed visuals. It is highly interactive, easy to use and hides the underlying complexity of querying from its users. Data from tables is internally mapped into charts using aggregate functions across tables. The tool thus integrates querying and charting into a single general-purpose application.
ChartVisio has been designed as a component of the Benchmark data engine, being developed at the Computer Science department, University of New Orleans. The data engine is an intelligent website generator and users who create websites using the Data Engine are the site owners. Using ChartVisio, owners may generate new charts and save them as XML templates for prospective website surfers. Everyday Internet users may view saved charts with the touch of a button and get real-time data, since charts are generated dynamically. Website surfers may also generate new charts, but may not save them as templates.
As a result, even non-technical users can design and generate charts with minimal time and effort.
Chapter 1. Introduction
ChartVisio is a simple web-based visual data-mining system [5] that presents data to users in a graphical format. Users can interactively specify the “search query” and ChartVisio communicates information back to the user through graphs or charts. The process of querying is totally transparent to end-users. It is a tool to extract rich knowledge from huge data collections and present it to the end-user in an easy-to-assimilate form. An additional advantage of manufacturing data in the form of a visual may lead to detection of trends, relationships, exceptions and patterns in the data, if any. These observations may be key in the future decision making processes. Thus, charts are vital for effective data discovery.
1.1 Background
This project is a component of the Web-based Benchmark data engine being developed at the Computer Science Department, University of New Orleans. The highlight of the website generator is its ability to dynamically generate new websites, based on a number of parameters given by the creator of the website. In effect, even users with a non-technical background can create their own websites in minimum amount of time. To start with, this engine was used for the maritime industry, where several shipping companies can create their own websites. They can also upload their data, for example, data pertaining to performance of ships, life & failure of individual parts, mean time before failure of equipment.
1.2 Objectives
The objective of this project was to design and integrate ChartVisio with the Benchmarking engine in such a way that the creator of a website will be able to use this visual data analysis tool to create new chart templates. From then on, each time end-users (either the creator of the website or a regular Internet user) logs onto the website, they can get real-time representation of data in the form of charts from templates stored earlier. The application must combine features such as simplicity, user autonomy, reusability and reliability, thus making it a very powerful tool to visually represent data.
Hence, a website will have its own charting application that users may very easily ‘self-service’ to see comparisons, performance and other interesting metrics in the data.
1.3 Overview
The remaining chapters are organized as follows:
Chapter 2. Concepts of ChartVisio
ChartVisio is an application that helps users to build dynamic charts easily. With the help of a few interactive steps, the users can specify the information to be represented on the chart. Based on user requirements, records are extracted from the database and displayed in the form of a chart. We assume that the database is populated.
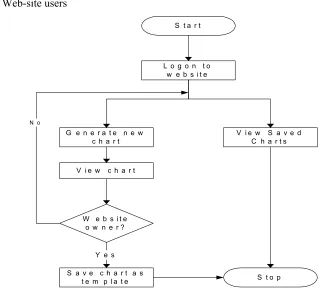
2.1. Levels of users
The application is aimed at two levels of users, namely: • Web-site creators or owners
• Web-site users
L o g o n t o w e b s i t e
S t a r t
G e n e r a t e n e w c h a r t
V i e w S a v e d C h a r t s
W e b s i t e o w n e r ?
S a v e c h a r t a s t e m p l a t e
Y e s
S t o p V i e w c h a r t
N o
Web-site owners or creators are a group of users who can create new websites using the benchmarking engine. They own and manage data online. Such users will be allowed to create new charts and save them as templates for the future. The saved templates are stored as XML [3] files.
Web-site users on the other hand, belong to the larger group of everyday Internet users who can access saved chart templates and generate the charts at real-time. They may also generate new charts but will not be authorized to store them.
2.2. Problem Definition
Let us consider the following scenario: Users have a large database and need to represent a sub-set of data in a chart. The process involved in doing that is:
• Search the database to decide what data needs to be represented on chart • Form an SQL query to extract required data from database
• Use commercial software (Example: Microsoft Excel) to plot a graph for extracted data
This procedure assumes that end-users are familiar with SQL and mandates them to employ other available software to generate charts. This is time-consuming and requires extensive technical support for dumb-users.
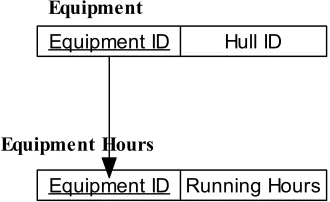
Let us consider an example from a sample maritime industry database to explain the problem better. Figure 2.2 presents the tables that are being employed to explain the example. Users need to know how much each Equipment has been ‘used’. That is, the running hours clocked by each equipment. This mapping is not stored in a single table that it can be extracted in a 1-step process. It requires extensive querying using SQL and can get extremely frustrating for non-technical users. Table 2.1 shows the result for this problem for 14 randomly chosen equipments.
Equipment ID Hull ID
Equipment
Equipment ID Running Hours Equipment Hours
Further more, what happens if users want to get a comparison-based answer? For example, what is the mean of all running hours or what is the minimum of all running hours? There is additional burden on users to know how to use aggregate functions in SQL.
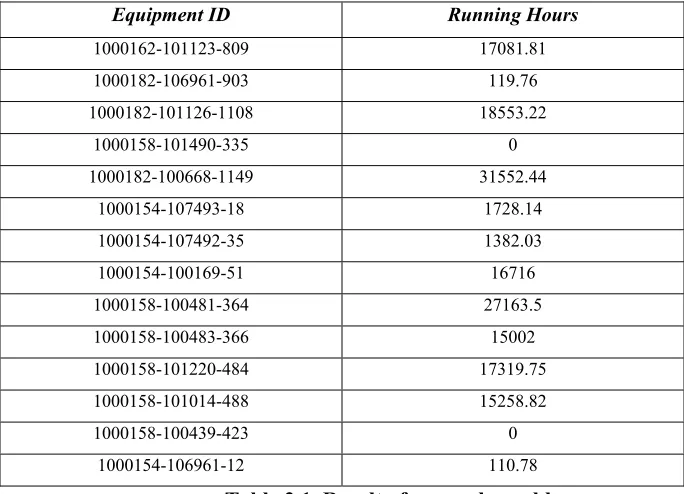
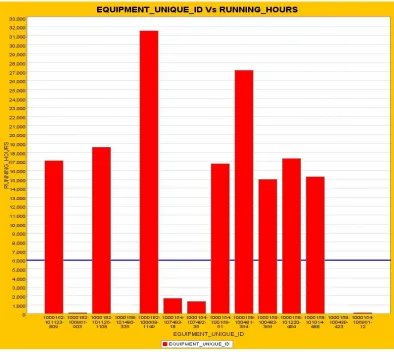
It is very hard to manually read through the numbers in Table 2.1 and come to an understanding about the running hours clocked by equipments. This problem grows as the number of records increase. So, users are forced to opt for a graphical representation to get easy-to-understand results. This adds an overhead on users to familiarize themselves with commercial products that draw charts. The entire process of querying the database and importing data to commercially available charting software to draw charts can lead to immense wastage of effort and time.
Table 2.1. Result of a sample problem
Equipment ID Running Hours
1000162-101123-809 17081.81 1000182-106961-903 119.76 1000182-101126-1108 18553.22
1000158-101490-335 0 1000182-100668-1149 31552.44
1000154-107493-18 1728.14 1000154-107492-35 1382.03 1000154-100169-51 16716 1000158-100481-364 27163.5 1000158-100483-366 15002 1000158-101220-484 17319.75 1000158-101014-488 15258.82 1000158-100439-423 0 1000154-106961-12 110.78
2.3. ChartVisio solution to the problem
ChartVisio navigates users in a sequence of interactive steps and accepts the coordinates for X-axis and Y-axis. Extensive use of graphical components in the application guide users in selecting records for the chart, that even non-technical users need not have any SQL background to build queries. Internally, the application builds appropriate queries based on users’ selection, queries the database, extracts results and displays them to users. Hence, using ChartVisio, mere touch of a few buttons can generate and display charts.
Website owners or creators also have the option of saving charts as templates for future use. For all users who log on to the website, they may select a chart from the given list of stored charts. Based on their selection, a chart is generated at real-time using its template stored earlier and displayed to users instantly.
Chapter 3. Architecture and Design
This chapter describes the technology, architecture and design decisions of the application.
3.1. Technical Architecture
System architecture is a vital component of an application design. Architecture translates the logical design of the application to a structure that defines the interaction of entities in the system. Client/ Server architecture [11] is preferred over the others because of the following reasons:
• User queries can be processed with ease, without actual file transfer [10] • Graphical user interfaces are supported [10]
• High performance and scalability [11]
• Provide flexible and robust infrastructures [12]
•
Multiple users can access the same application data [11]The architecture is based on a three-tier model in which business rules are segregated from the client [11]. Each component has its own assigned specific purpose as explained below:
• Client - Web-based clients like Web browsers
This is a front-end client that provides through a graphical user interface for the application.
• Application Server - Servlet engine Apache-Tomcat 4.1.18 [17] This business-services tier integrates business rules and processes.
Tomcat was chosen as the middle tier server but it could have been any other Servlet container that supports Java Servlets and Java Server Pages (JSP) specification. All Servlets and JSPs are deployed to the Tomcat server, which was configured to work as a standalone Web server.
• Database Server - Oracle 9i database server [18]
Oracle was chosen for the database server as Oracle is a reference, but it could have been any other relational database server.
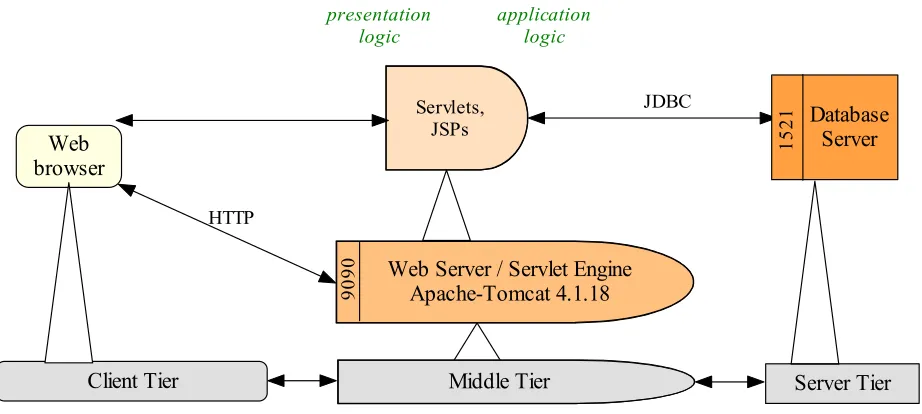
Figure 3.1 presents the three-tier architecture [10] implemented for the charting application and the technology involved. Servers are denoted by rectangles. Clients are represented by rectangles with rounded corners and double-headed arrows denote the Client-Server relation. [9] The Middle Tier components are clients and servers, while the Client Tier components are pure clients and the Server Tier components are pure servers. Also, the set of building blocks of the architecture include Web Server, Database Server, and the Web browser. The triangles represent sustainment relation, which can be defined as the relationship between two individual building blocks. As an example from figure 3.1, the Web Server sustains Servlets and JSPs.
Server Tier
Servlets, JSPs
Middle Tier
Web Server / Servlet Engine Apache-Tomcat 4.1.18 90 90 Web browser Client Tier presentation logic application logic Database Server 15 21 JDBC HTTP
Figure 3.1. Technical architecture of the application
3.2. Basic Technology
The components and technology involved in this application include:
• Servlets [1] have been used to enable dynamic processing and interaction with the Server. A Servlet is a Java program that runs on the Web Server side. It provides a component-based, server and platform-independent method for building Web-based applications with access to all Java API. With Servlets, customization of content, function and appearance of web pages is possible. • JSPs [2] have been used for dynamic interaction with the clients. Presentation logic resides here
and JSPs are part of the Web front end. Like Servlets, they enable server and platform-independent applications.
• JFreeChart library [19] has been used to display & generate charts. JFreeChart is a freely available Java class library. The advantage of using this library is that it was written entirely in Java and can run on all Java 2 platforms from JDK 1.3 onwards [6]. This library has several interesting features that can be easily incorporated into both stand-alone Java applications and Servlets [1].
• XML (eXtensible Markup Language) [8] has been used to achieve interoperability and to store data using a standardized format. The application saves user charts as XML files. The cohesive integration of Java and XML adds flexibility and eases communication between heterogeneous systems [7].
3.3. Functional Architecture
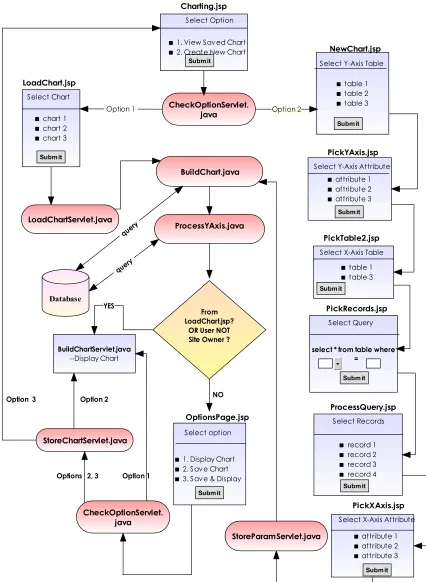
Figure 3.1 shows where the components are deployed in the architecture and which tier sustains each component. Figure 3.2 demonstrates the relation and interaction amongst all the components involved in the system.
1. View Saved Chart 2. Create New Chart
chart 1 chart 2 chart 3 BuildChartServlet.java --Display Chart CheckOptionServlet. java Charting.jsp LoadChart.jsp LoadChartServlet.java BuildChart.java ProcessYAxis.java Select Option Select Chart table 1 table 2 table 3 NewChart.jsp
Select Y-Axis Table
attribute 1 attribute 2 attribute 3
PickYAxis.jsp
Select Y-Axis Attribute
table 1 table 3 Select X-Axis Table
PickTable2.jsp
select * from table where = PickRecords.jsp Select Query Submit Submit Submit Submit Submit Submit record 1 record 2 record 3 record 4 ProcessQuery.jsp Select Records Submit Database attribute 1 attribute 2 attribute 3 PickXAxis.jsp
Select X-Axis Attribute
Submit StoreParamServlet.java
From LoadChart.jsp?
OR User NOT Site Owner ?
Option 1
query
query
1. Display Chart 2. Save Chart 3. Save & Display
OptionsPage.jsp Select option Submit NO Option 2 YES CheckOptionServlet. java StoreChartServlet.java
Options 2, 3 Option 3
Option 1
Option 2
3.4. Mapping data from tables to charts
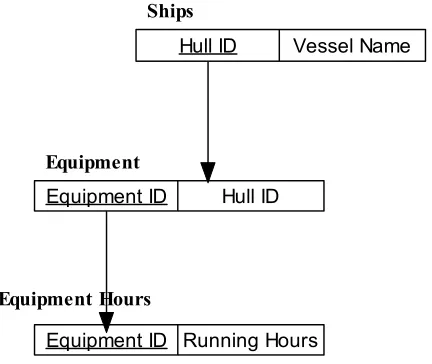
Let us consider an example from a sample maritime industry database to explain how information across tables is mapped into data for charts. Figure 3.3 presents a list of tables that are being employed to explain the example. Let the problem be that users need to know how much each vessel has been used. That is, the running hours clocked by each ship. As we can see from Figure 3.3, this mapping is stored over three tables.
Hull ID Vessel Name
Ships
Equipment ID Hull ID
Equipment
Equipment ID Running Hours Equipment Hours
Figure 3.3. Tables and their relationship
Tables 3.1, 3.2 and 3.3 present sample data from tables Ships, Equipment and Equipment Hours respectively. (Note: Tables 3.2 and 3.3 present only a very small sub-set of data due to space constraints.)
In the proposed example, we need to ‘connect’ tables Ships and Equipment Hours to draw a chart that represents ‘Vessel Name’ versus ‘Running Hours’. From Figure 3.3, it is evident that the two tables are related through another table, namely, Equipment.
Hull ID Vessel Name
1000182 Wave Iris
1000154 Wave Athene
1000158 Wave Demeter
1000162 Wave Erida
Equipment ID Running Hours 1000154-106961-12 110.78 1000154-100012-4 0 1000154-107492-35 1382.03 1000158-100012-301 0 1000158-100481-364 27163.50 1000158-101220-484 17319.75 1000162-101123-809 17081.81 1000162-100012-598 0 1000182-101126-1108 18553.22 1000182-101126-108 0 T H
Equipment ID Hull ID
1000154-106961-12 1000154 1000154-100012-4 1000154 1000154-107492-35 1000154 1000158-100012-301 1000158 1000158-100481-364 1000158 1000158-101220-484 1000158 1000162-101123-809 1000162 1000162-100012-598 1000162 1000182-101126-1108 1000182 1000182-101126-108 1000182
Table 3.2. Sample data for Equipment Table 3.3. Sample data for Equipment Hours
There are over a thousand unique equipments in table Equipment (from which a small sub-set of data has been presented here) for all the four vessels (in table Ships). Also, equipments have their individual ‘Running Hours’ (in table Equipment Hours and the table has over 800 records).
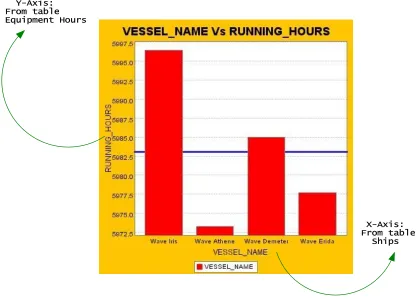
The process involved in obtaining Running Hours for each vessel is: • Get all equipments for a vessel (from table Equipment)
• Get ‘Running Hours’ for each equipment (from table Equipment Hours)
• Calculate aggregate group function (Example: Mean, Maximum, Minimum) over all ‘Running hours’
• Save ‘Running hours’, ‘Vessel Name’ mapping
Y-Axis: From table Equipment Hours
X-Axis: From table Ships
Chapter 4. User Interface Design
This chapter describes the steps users need to take to view saved charts and to create new charts. Also, the user interface design is explained here.
4.1. View saved charts
All references to ‘Users’ in this section can imply both website owners or creators and everyday Internet users, unless specified otherwise.
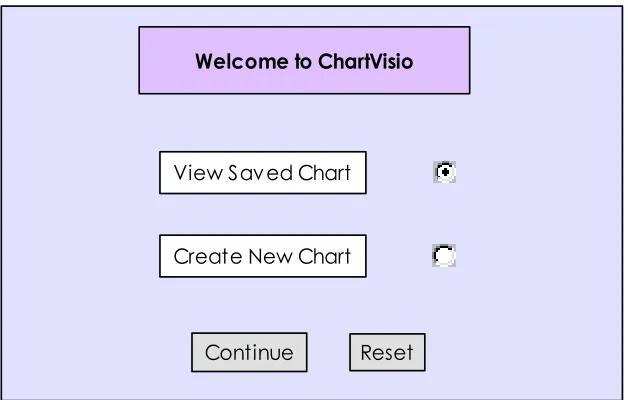
Step 1: Users choose between view a saved chart or create a new chart
Component Name: Charting.jsp
This is the first screen of the application. Users are presented with two options: • View saved charts
• Create a new chart
This component was developed using Java Server Page (JSP) technology.
Continue Reset View Saved Chart
Create New Chart
Welcome to ChartVisio
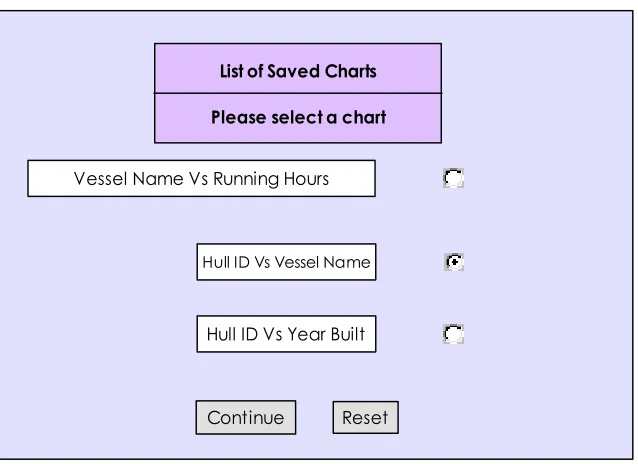
Step 2: Users select the chart that they wish to see displayed
Component Name: LoadChart.jsp
This screen is loaded if users selected to view a saved chart in Charting.jsp. In this screen, users are presented with a list of charts that have been stored in the system. Users may select any one chart and proceed to the next screen where the chart is built dynamically and displayed on the browser.
The screen has been built using Java Server Pages (JSP) technology.
Continue Reset
Hull ID Vs Vessel Name
Vessel Name Vs Running Hours List of Saved Charts
Please select a chart
Hull ID Vs Year Built
Figure 4.2. Snapshot of LoadChart.jsp component
Charting.jsp
-- Users select either to View Saved Chart or Create a New
Chart
Start
View Saved Chart ?
LoadChart.jsp
-- Display list of saved charts
User Selects a chart
BuildChartServlet.java
-- Display chart
End Yes
4.2. Design new charts
All references to ‘Users’ in this section can imply both website owners or creators and everyday Internet users, unless specified otherwise.
Step 1: Users choose between view a saved chart or create a new chart
Component Name: Charting.jsp
This is the first screen of the application. Users are presented with two options: • View saved charts
• Create a new chart
This component was developed using Java Server Page (JSP) technology.
Continue Reset View Saved Chart
Create New Chart
Welcome to ChartVisio
Figure 4.4. Snapshot of Charting.jsp component
Step 2: Users select Chart type & table for Y-Axis attribute:
Component Name: NewChart.jsp
In the previous step, users selected the option to create a new chart. In this step, users can specify the attributes of their chart.
In a Vertical bar chart, X-Axis is the domain axis, containing non-numeric data and Y-Axis is the range axis, containing the values corresponding to the x-axis. The XY chart on the other hand, has numeric values on both the axes.
Users are presented with a list of tables in the database. They are allowed to choose a table, which would contain the attribute for Y-axis (of the chart). This component was developed using Java Server Page (JSP) technology. Front-end validation is being performed using Java Script.
Continue Reset SHIPS
SHIPS_SYSTEM
Step 2: Select Chart Type & table for Y-Axis attribute
EQUIPMENT_HOURS
EQUIPMENT
FAILURE_REPORT Select Chart Type
XY Chart Vertical Chart
Selections made so far:
1. Create a new chart
Figure 4.5. Snapshot of NewChart.jsp component
Step 3: Users select the Y-Axis attribute & aggregate function to be used:
Component Name: PickYAxis.jsp
In previous step, users chose a table, containing the attribute for Y-axis. In this screen, we present users with a list of numeric attributes (attribute of the type “NUMBER”), from the above-mentioned table. We only present numeric attributes because, Y-axis represents a “value” for each X-axis element.
used from a drop-down list. The choices would be Mean, Maximum and Minimum. By default, the “Mean” option is selected in the drop-down list.
This component was developed using Java Server Page (JSP) technology. Front-end validation is being performed using Java Script.
Continue Reset SYSTEM_HSC NUMBER
Step 3: Select Y-axis attribute & aggregate function to be used
Attribute
Aggregate Function
Minimum Mean
Maximum
Data Type Select
HULL_ID NUMBER
Selections m ade so far:
1. Create a new chart 2. Y-axis table: SHIPS_SYSTEM
Figure 4.6. Snapshot of PickYAxis.jsp component
Step 4: Select table for X-Axis attribute
Component Name: PickTable2.jsp
In the previous step, users chose the attribute for the Y-axis of the chart. In this step, we present the user with options to select a table for X-axis attribute (of the chart).
This component was developed using Java Server Page (JSP) technology. Front-end validation is being performed using Java Script.
Continue Reset
Step 4: Select table for x-axis attribute
SHIPS SHIPS_SYSTEM
Selections made so far:
1. Create a new chart 2. y-axis table: SHIPS_SYSTEM 3. y-axis: HULL_ID
Figure 4.7. Snapshot of PickTable2.jsp component
Step 5: Build query to view records of x-axis table
Component Name: PickRecords.jsp
In the previous step, users chose the table for X-axis attribute of the chart. In this step, we present users with text boxes to generate a “select” query. The query is of the form:
“Select * from table where criterion”. To fill the criterion, users are presented with: • Drop-down list containing the attributes of the table
• Drop-down list containing the operators • Text box to enter criterion string
Continue
Step 5: Form query to view records of SHIPS
*
Select SHIPS where
VESSEL_NAME 1 HULL_ID
YEAR_BUILT
<= =
>=
1
Reset HULL_ID NUMBER
Attribute Data Type
YEAR_BUILT NUMBER VESSEL_NAME VARCHAR2
from
Selections made so far:
1. Create a new chart 2. y-axis table: SHIPS_SYSTEM 3. y-axis: HULL_ID
4. x-axis table: SHIPS
Figure 4.8. Snapshot of PickRecords.jsp component
Step 6A: Re-enter query if it was wrong in the previous step
Component Name: BadQuery.jsp
Continue
Step 5: Form query to view records of SHIPS
*
Select SHIPS where
VESSEL_NAME 1 HULL_ID
YEAR_BUILT
<= =
>=
1
Reset HULL_ID NUMBER
Attribute Data Type
YEAR_BUILT NUMBER VESSEL_NAME VARCHAR2
from
Selections made so far:
1. Create a new chart 2. y-axis table: SHIPS_SYSTEM 3. y-axis: HULL_ID
4. x-axis table: SHIPS 5. Invalid Query
select * from SHIPS where
HULL_ID = '100' is anINVALID query. Please enter a new query
Figure 4.9. Snapshot of BadQuery.jsp component
This component was developed using Java Server Page (JSP) technology. Front-end validation is being performed using Java Script.
Step 6B: Users select records in the x-axis table
Component Name: ProcessQuery.jsp
the data to be shown along the X-axis. (Note: If the query was invalid, users are taken back to BadQuery.jsp. This component was described under the previous sub-heading.)
To help users in selecting records, ChartVisio displays the X-axis table with records filtered by the criteria specified by the users. A pseudo column “Row ID” is shown next to each record. When a user selects records, the system keeps track of the row ids of the selected records.
Continue
Step 6: Select Records for X-axis from table: SHIPS Reset 100 1990 HULL_ID YEAR_BUILT 200 1994 300 1992
Enter Row ID Range: TO
Select Row ID
Reset Choice Row ID 3 1 2 0 400 1996 VESSEL_NAME Victoria Black Swan Sea W olf
Glorious
Select Options:
1. Enter range of Row IDs
2. Enter indiv idual Row IDs - separate two Row IDs by a space 3. Select check boxes to mark selection
Figure 4.10. Snapshot of ProcessQuery.jsp component
Users may select the data to be presented on the X-axis using any of the following methods:
2) Specify individual Row Ids – If users do not want a sequential range of records, they may choose Row Ids randomly and enter them in the text area provided. Now, each of the Row Ids specified will be a part of the chart.
3) Select Check Box next to each record – If users do not wish to use methods 1 or 2, then they may specify their choice of X-axis data by clicking on the check box provided next to each record. Every checked record will be considered as an element in the X-axis.
This component was developed using Java Server Page (JSP) technology. Front-end validation is being performed using Java Script.
Step 7: Users select the X-Axis Label and Marker Line
Component Name: PickXAxis.jsp
In the previous step, the user has chosen the data to be displayed along the X-axis of the chart. In this step, the users are presented with a list of attributes from the X-axis table (selected by the user in PickTable2.jsp), and the users may choose any one. The attributes presented to the user depends on the chart type selected by the user in step 1:
If the user chose XY-Chart, only numeric attributes are displayed.
If the user chose Vertical chart, only non-numeric attributes are displayed.
ChartVisio also offers users the option of specifying a “Marker” line to their chart. The marker could be either a “standard” or a level to be attained. For example, it could be an average /maximum /minimum value of a set of values.
Users may choose to draw a marker line on their charts by selecting any of the options (like MEAN, MAX, MIN) from the “Marker Line” drop down list. If the users choose “NONE” from list, the chart would not have a marker line.
Continue Reset VESSEL_NAME VARCHAR2
Step 7: Select X-axis label & marker line
Attribute
Draw Marker Line
Data Type Select
DESC VARCHAR2
None
Minimum Mean
Maximum All Records
Selected Records
Selections made so far:
1. Create a new chart 2. Y-axis table: SHIPS_SYSTEM 3. Y-axis: HULL_ID
4. X-axis table: SHIPS
5. Query: select * from SHIPS where 1=1 6. Select records
Figure 4.11 Snapshot of PickXAxis.jsp component
The screen has been built using Java Server Pages (JSP) technology and validation has been done using Java Script.
Step 8: Users specify if they wish to save the new chart
Component Name: OptionsPage.jsp
In the previous step, users selected the attribute for X-Axis. With that, users completed specifying attributes for the new chart. Here, users select what they wish to do with the new chart. The options are:
• Display Chart • Save Chart
• Save & Display chart
Continue Reset Display chart
Save chart
Step 8: Do you wish to save the chart?
Display & Sav e chart
Figure 4.12 Snapshot of OptionsPage.jsp component
The screen has been built using Java Server Pages (JSP) technology.
user = website owner? Build Chart Servlet --Display Chart Start
New Chart ?
NewChart.jsp
1. Users select Chart Type 2. Users select Y-Axis Table
PickYAxis.jsp
1. Users select Y Axis Attribute 2. Users select Aggregate Function
PickTable2.jsp
-- Users select Table for X-Axis
PickRecords.jsp
-- Users build query to view selected records of x-axis table
PickXAxis.jsp
1. Users select label for X-Axis 2. Users select Marker
1. Display Chart? 2. Save Chart? 3. Save and Display
Chart?
Display Chart
Store Chart Servlet
-- save chart template as XML file
Option 2, Option 3 Save & Display
Charting.jsp
1. View Saved Chart 2. Create new Chart
Yes
ProcessQuery.jsp --Users select records for the x-axis
End
Save Chart
NO
ChooseOptions.jsp
--display options to save chart
YES
Chapter 5. Implementation
The components used in the application can be classified into: • JSPs
• Servlets
JSPs [2] have been used wherever there was a need for dynamic interaction with clients. JSPs formed the web-front end. JSPs were used to present information and options to users and also to accept user choices.
Servlets [1] have been used to enable dynamic interaction with the Server. They were employed to do the core processing to generate and display charts.
5.1. JSP Components
Component: Charting.jsp
Processing Detail: Users are allowed to view a saved chart or create a new chart. Users are presented
with radio buttons to help them make their selection. The ‘View Saved Chart’ option is selected by default.
This is the first screen of the application. When users click on ‘Continue’ after making their selection, the JSP form is submitted to CheckOptionServlet.
Component: NewChart.jsp
Processing Detail: Users are navigated to this screen if they selected ‘Create a new chart’ option in
Charting.jsp. Here, Users are allowed to choose the chart type and the table for the Y-axis attribute in this screen. ChartVisio calculates the master-detail relationship of every table with every other table in the database and stores it in two hash tables:
These tables will be of use in the later stages and their use will be described when appropriate. Master-Child and Child-Master hash table values are stored in session. When users click on ‘Continue’ after entering chart type and table for Y-axis, the JSP form is submitted and users are taken to PickYAxis.jsp.
Validation Description: When users click on ‘Continue’, a Java Script function is called. This function checks if users have selected a table from the list as the Y-axis table before allowing them to the next stage (PickYAxis.jsp). An alert is raised if the form is not filled completely. Hidden fields on the form are set with values for ‘yAxisTable’ and ‘chartType’.
Component: PickYAxis.jsp
Processing Detail: This JSP is loaded when users submit NewChart.jsp. Table for Y-Axis is extracted
from Http Request and saved the table name is in session. Users are allowed to choose the attribute for Y-axis and select the aggregate function to be used.
Why would users need to choose an aggregate Function?
For each X-axis element, there may be multiple values for the Y-axis attribute. To be able to plot these values as one point on the graph, we need to group these values into a single value using an aggregate function. To facilitate aggregate function selection, the users are presented with a drop down list, consisting of Mean (default option), Maximum, and Minimum as options.
Let us consider the following example. In the “Failure_Report” table, there are multiple failure instances for a Ship X. If the user would like to see a chart for Ship X Vs Failure_Hours for Ship X, all the Failure_Hours for Ship X need to be grouped as one value and then plotted on the chart as a single value.
When users click on ‘Continue’ after selecting attribute for Y-axis and aggregate function, the JSP form is submitted and users are taken to PickTable2.jsp.
Component: PickTable2.jsp
Processing Detail: This JSP is loaded when users submit PickXAxis.jsp. Y-Axis attribute and aggregate
function are extracted from Http Request and are saved in the session.
Here, users are allowed to choose the table for the X-axis attribute. Using the hash tables populated in NewChart.jsp, ChartVisio displays only the master tables of the table selected as the Y-Axis table.
Why does the X-Axis table need to be a master table of the Y-Axis table?
ChartVisio allows its users to select the Y-Axis attribute, Axis attribute and the records for X-Axis. Data for Y-Axis is extracted from the database using data from X-X-Axis. For this, there needs to be at least a single common attribute between the X-Axis table and Y-Axis table. It is more interesting to select only the parent tables of the y-axis tables. Here, we do not restrict ourselves to the first level of master tables; we consider all possible parent tables of the y-axis table.
When users click on ‘Continue’, after selecting table for X-axis attribute, the JSP form is submitted and users are taken to PickRecords.jsp.
Validation Description: When users click on ‘Continue’, a Java Script function is called. This function checks if users have selected a table from the list as the X-axis table before allowing them to the next stage. An alert is raised if the form is not filled completely. A hidden field on the form is set with values for ‘xAxisTable’.
Component: PickRecords.jsp
Processing Detail: This JSP is loaded when users submit PickTable2.jsp. Table for X-axis attribute is
extracted from Http Request and is saved in the session.
Here, the users are presented with a skeleton to build a query. This is vital because we would not want to show all records of the table on the screen. Instead, we provide the users with a query box from where they can restrict the number of records.
For this, users are presented with a query box in the following format: “Select * from xAxisTable where <attribute> <operator> <criterion>”.
text area provided. If the attribute selected in the <attribute> list happens to be of a data type other than ‘NUMBER’, users will need to enter their criteria in single-quotes. After entering the attribute, criterion and operator, users may press on “Set Query” button to submit the query to ChartVisio.
When users click on ‘Set Query’ button after selecting attribute, operator and criterion, a Java script function is called. This function sets hidden fields for each of the user selections and the JSP form is submitted and users are navigated to ProcessQuery.jsp.
Component: ProcessQuery.jsp
Processing Detail: This JSP is loaded when users click the ‘Set Query’ button in PickRecords.jsp. Incase of an invalid query, the bad query is set in session and using Http Response.redirect, users are taken to BadQuery.jsp. If the query is valid, users are presented with the records and means to select records.
Here, we process the query entered by users in PickRecords.jsp and check if the query is valid. If the query is valid, then ChartVisio presents users with the records returned by the query in a tabular format.
A pseudo column “Row ID” is shown next to each record. When a user selects records, the system keeps track of the row ids of the selected records.
Users may select the data to be presented on the X-axis using any of the following methods:
1) Enter the range of Row Ids – Users are presented with two text boxes where they need to enter the initial Row Id and the final Row Id of records to be selected to be a part of the X-Axis. Users need to select the appropriate radio button in order to enter row ids using this method.
2) Specify individual Row Ids – Users are presented with a text area, where they may enter individual Row Ids in any order. Individual Row Ids may be separated by a space. Users need to select the appropriate radio button in order to enter row ids using this method.
3) Select Check Box next to each record – Users also have the choice of clicking on the check-box next to each record to select a record for the X-Axis of the chart.
How does ChartVisio remember each record?
We know each record based on the row ids selected by the users. But row id is a pseudo column and we need to know the primary key attribute values for SQL to query the records from the database.
In order to accomplish the above goal, this component retrieves X-Axis table name from the session and finds out the table’s primary key and its data types. The data type is required because, incase the primary key attribute is not of the type number, then, the value for that attribute needs to be in single quotes in the SQL query that we are going to build.
For every record, the primary key values are added to a Vector. When users click on a particular record, the record’s primary key value is extracted from the vector and stored in a hidden field on the form. This hidden field is edited and updated each time a record is selected. When users submit the form, these values are sent to the next page in Http Request.
For example: Attributes ‘HULL_ID [NUMBER]’ and ‘SYSTEM_HSC [VARCHAR2]’ together form the key of the table, SHIPS_SYSTEM. The key of the table is added to a Vector and stored in session. If users select a record that is described as: HULL_ID = 1000082 and SYSTEM_HSC = ‘404’, then, ChartVisio remembers this record as 100082&’404’. If users select another record that is described as: HULL_ID = 100054 and SYSTEM_HSC = ‘504’, then ChartVisio updates the value as: 100082&’404’ 100054&’504’. Thus, a space character is used as delimiter to separate two individual records and ampersand [‘&’] symbol separates individual key values.
This raw structure will be processed in the next screen and stored in more meaningful data structure.
When users click on ‘Continue’, the JSP form is submitted and users are taken to PickXAxis.jsp. In case of an invalid query from PickRecords.jsp, the illegal query is stored in Http Request and users are redirected back to PickRecords.jsp.
Component: PickXAxis.jsp
Processing Detail: This JSP is loaded when users submit ProcessQuery.jsp. X-axis records described by
their keys are extracted from Http Request and are processed here. Key elements are now stored in a vector containing vector of records.
Here, the users are presented with a list of attributes of the X-Axis table. The attributes depend on the chart type selected by the user in step 1 in NewChart.jsp:
If the chart type was XY-Chart, only numeric attributes are displayed.
If the chart type was Vertical chart, only non-numeric attributes are displayed.
Users are provided with a radio button next to each attribute from which users may select any one.
ChartVisio also provides an option of including a “Marker Line” in the chart. A “Marker line” is a horizontal line drawn parallel to the X-axis at a certain Y-Axis value decided by the user. The marker value could be the Average, Maximum or Minimum of all the records in the database or just the selected records in ProcessQuery.jsp
A text box is presented to the users where they can enter the chart’s title. If the text box is left blank, the component sets the title as: axisX Vs axisY, where axisX and axisY refer to the x-axis and y-axis attributes respectively.
When users click on ‘Continue’ after selecting label for x-axis of the chart, title and marker line, the JSP form is submitted and users are taken to BuildChart.java
Validation Description: When users click on ‘Continue’ after selecting X-axis table name and marker
values, a Java Script function is called. The function checks if users have selected an attribute from the list as the X-axis label before letting users proceed to the next stage. An alert is raised if the form is not filled completely. Hidden fields on the form are set with values for ‘marker for’, marker type and x-axis label.
Component: BadQuery.jsp
Validation Description: This is similar to the validation description of PickRecords.jsp.
Component: ErrorPage.jsp
Processing Detail: Users are navigated to this screen when they randomly access any screen of the
application, without following the sequence. Here, users are presented with a link that will take them to the first page of the application. Users will need to click on the link to Charting.jsp to start afresh.
Component: LoadChart.jsp
Processing Detail: This JSP is loaded when users select ‘View Saved Charts’ option on Charting.jsp.
This component is involved in retrieving all the .xml files saved in the directory specified for saved charts. (Note: This information is stored in xml_config.properties file and this component is explained in Chapter 6) Users are presented with a list of charts that are available and users may select any one of them and click on ‘Continue’.
After users select one of the charts and click on ‘Continue’, the form is submitted to LoadChartServlet.java.
5.2. Java Servlet Components
Component: StoreParamServlet.java Processing Detail:
This servlet is called from PickXAxis.jsp when users click on ‘Continue’ button. X-axis attribute, chartTitle, markerFor and yMarker are extracted from HttpRequest and stored in the session. This is an internal servlet and hence, does not form a user screen.
This servlet simply does get ( ) and set ( ) methods for attributes in Http request. Using the Request Dispatcher class, control is now transferred to BuildChart.java
Component: StoreChartServlet.java
Processing Detail: This servlet is called from CheckOptionServlet.java. (Note: If users select ‘save chart’ or ‘save & display chart’ in CheckOptions.jsp, then, StoreChartServlet.java is called.)
This is an internal servlet and hence, does not form a user screen. This servlet extracts the following information from session:
• X-axis attribute, Y-axis attribute • Key Vector, Key value Vector
• Chart title, chart type (vertical chart / XY-chart)
• Ymarker (marker line options: none / mean / min / max) • markerFor (marker over all records / selected records) • ySelectType (for the aggregate function)
• Except for Key Vector and Key value vector, all the other bits of information are of the data type ‘String’ and are single-valued. [Jdom.jar] [20] offers java-centric solution for creating and manipulating XML files. Using the jdom API, an XML file is created with each of the string data as an individual ‘Element’. Extra processing is done to traverse through each of the vectors (namely, the key vector and the key value vector) and represent the vector elements in XML format.
The XML file is saved as: ‘%chart_title%.xml’ in the directory specified in the XML_Config.properties file. (Note: Chapter 5 talks about the configuration files)
This component imports [org.jdom.*] and [org.jdom.output.*] [20].
X-axis attribute, chartTitle, markerFor and yMarker are extracted from HttpRequest and stored in the session. An example of an XML file created using the StoreChartServlet in Figure 5.1.
If users selected the ‘save chart’ option in CheckOptions.jsp, using the Request Dispatcher class, control is transferred to Charting.jsp
<?xml version="1.0" encoding="UTF-8"?> <CHART_DATA> <X_AXIS_TABLE>SHIPS</X_AXIS_TABLE> <Y_AXIS_TABLE>SHIPS_SYSTEM</Y_AXIS_TABLE> <X_AXIS>VESSEL_NAME</X_AXIS> <Y_AXIS>HULL_ID</Y_AXIS> <CHART_TYPE>1</CHART_TYPE>
<CHART_TITLE>VESSEL_NAME Vs HULL_ID</CHART_TITLE> <Y_MARKER>1</Y_MARKER> <MARKER_FOR>0</MARKER_FOR> <Y_SELECT_TYPE>1</Y_SELECT_TYPE> <KEY_LIST> <KEY_LIST_ITEM> HULL_ID </KEY_LIST_ITEM> </KEY_LIST> <QUERY_LIST> <QUERY_LIST_ITEM> <ATTR_LIST> <ATTR_LIST_ITEM>1000182</ATTR_LIST_ITEM> </ATTR_LIST> </QUERY_LIST_ITEM> <QUERY_LIST_ITEM> <ATTR_LIST> <ATTR_LIST_ITEM>1000154</ATTR_LIST_ITEM> </ATTR_LIST> </QUERY_LIST_ITEM> <QUERY_LIST_ITEM> <ATTR_LIST> <ATTR_LIST_ITEM>1000158</ATTR_LIST_ITEM> </ATTR_LIST> </QUERY_LIST_ITEM> <QUERY_LIST_ITEM> <ATTR_LIST> <ATTR_LIST_ITEM>1000162</ATTR_LIST_ITEM> </ATTR_LIST> </QUERY_LIST_ITEM> </QUERY_LIST> </CHART_DATA>
Component: LoadChartServlet.java
Processing Detail: This servlet is called from LoadChart.jsp when users select which chart they wish to see and click on ‘Continue’ button. This is an internal servlet and hence, does not form a user screen.
This component reads from the selected XML file and extracts the following information: • X-axis table, Y-axis table
• X-axis attribute, Y-axis attribute • Key Vector, Key value Vector
• Chart title, chart type (vertical chart / XY-chart)
• Ymarker (marker line options: none / mean / min / max) • markerFor (marker over all records / selected records • ySelectType (for the aggregate function)
This detail is now fed into session using the SessionController class. (Note: This is a utility class and will be explained in the next chapter).
Using the Request Dispatcher class, control is now transferred to BuildChartServlet.java where the chart will be displayed.
Component: BuildChart.java
Processing Detail: This servlet can be called from:
• StoreParamServlet (Note: StoreParamServlet is called when users click on the ‘Continue’ button in PickXAxis.jsp during new chart creation)
• LoadChartServlet (Note: LoadChartServlet is called via LoadChart.jsp when users select ‘View Saved Chart’ in Charting.jsp)
This is an internal servlet and hence, does not form a user screen. Here, we check if the table for x-axis attribute and the table for y-x-axis attribute are the same; and process the attributes accordingly.
Attribute for X-axis, chart title, marker type and ‘marker for’ are retrieved from Http request and are saved in session. Keys and Record Value vectors (saved in session in ProcessQuery.jsp) are retrieved from session.
= axisX. Using this as the query, the record corresponding to this criterion is retrieved from the database. This record would be an element for the x-axis of the chart. Each x-record is loaded into the Vector xRecords. If there are multiple occurrences of the same x-record element in the vector, duplicate elements are combined using the aggregate function (selected by user in PickYAxis.jsp) and the vectors are updated with accordingly.
If the y-axis table were to be the same as the x-axis table, then the criterion would be the same to retrieve a y-axis record. If a query results in more than 1 record being selected, the aggregate function (selected by the user in PickYAxis.jsp) is used to group multiple values into a single record. Each y-record is loaded into the Vector yRecords.
At the end of processing, a Request Dispatcher object is created for the current servlet context and Http request and Http response are packed in it. If the table selected for Y-axis is the same as the table for X-axis, request dispatcher is sent to BuildChartServlet.java. If the table selected for Y-axis is different from that of the X-axis table, request dispatcher is sent to ProcessYAxis.java
Component: ProcessYAxis.java
This servlet is called from BuildChart.java only if users select a table for Y-axis that is different from the X-axis table.
This servlet is deployed only if the Y-axis table is different from that of X-axis table. Here, the aim is to retrieve Y-axis records and load them into a Vector yRecords and move on to building the chart as the next step. The process is very similar to that employed in BuildChart.java to process X-axis records.
Keys and Record Value vectors (saved in session in ProcessQuery.jsp) are retrieved from session. The foreign key attributes are extracted from the session Note: They are the attributes that “link” the X-axis table and Y-X-axis table. They were calculated and put into session in PickRecords.jsp. So, link attributes would be present in both X-axis and Y-axis tables.
yRecords. If the query returns more than 1 element, the records are combined using the aggregate function (selected by user in PickYAxis.jsp) and the vectors are updated accordingly.
Also, if the user has selected the option of including a marker line (Users are presented with this option in PickXAxis.jsp), this component calculates where the marker line needs to be drawn. Finally, yRecords Vector and marker line value are stored in session.
At the end of processing, a Request Dispatcher object is created for the current servlet context; Http request and Http response are packed in it and is sent to BuildChartServlet.java.
Component: BuildChartServlet.java
Processing Detail: This is an internal servlet and hence, does not form a user screen. This servlet can be called from one of the following components:
• BuildChart.java – if users are creating a new chart and x-axis and y-axis tables correspond to the same table
• ProcessYAxis.java – if users are creating a new chart and y-axis table is different from that of the x-axis table
• LoadChartServlet.java – if users are viewing a saved chart
This component extracts the following information from session: • axisX – name of the x-axis attribute
• axisY – name of the y-axis attribute • chartTitle – title of the chart
• markerValue – value at which the marker line needs to be drawn (This will contain “NONE” if there was marker line was not included by the user in PickXAxis.jsp)
• xRecords – vector that contains all x-axis records (Calculated in BuildChart.java based on users’ selection of records in ProcessQuery.jsp)
This component imports the java chart library files, namely, com.jrefinery,chart.* [20] and com.jrefinery.input.* [20]. ChartVisio employs utilities described in the library to ‘draw’ its charts. How the utilities work to draw charts is beyond the scope of this discussion.
Using the values for x-axis and y-axis records, this component builds a ‘chart’ object (native to the Chart library) and the chart is created as a .jpeg file and is displayed on the browser.
OptionsPage.jsp
1. Display Chart 2. Save Chart
3. Save & Display Chart
ProcessYAxis.java
1. Find how y-axis table is related to x-axis table
2. Form query to retrieve y-records using the link attributes from Step 1
3. Load records into Vector and store in session
BuildChart.java
1. Build criterion & query to get x-axis records 2. Load records into Vector and store in session
3. If x-axis table == y-axis table, load y-records and store in session
Is x-axis table = y-axis table?
No
Loading chart from XML file or user NOT website
owner?
No Yes
BuildChartServlet.java
- display chart Yes
Charting.jsp
- first page where user selects to create a new chart or view a saved chart
Start
--Chart detail from Load saved chart or New chart creation
End
CheckOptionServlet.java
-- checks option and redirects control
StoreChartServlet.java
- save chart as an XML file
Save Chart
Save & Display
Option 1
Options 2, 3
Chapter 6. Configuration files & utility classes
6.1. Configuration files
Configuration files lend portability to the application. ChartVisio makes use of the following configuration files:
• DB_config: parameters related to database connection, user name and password • Logger_config: parameters related to where the logger files need to be generated • XML_config: parameters related to where the charts need to be stored
An example of the configuration file containing database and connection related information is presented in Figure 6.1.
#Sample db_config.properties file
dbHost=carrolton.cs.uno.edu dbPort=1521
dbName=dbrs login=test_user pwd=test_password owner=chart_user
Figure 6.1: Example of a DB_config.properties file
An example of the configuration file containing information related to where XML files need to be stored is presented in Figure 6.2.
## file_path for Store Chart file_path=C:\\Saved_Charts\\
## phile_path for Load Chart
phile_path=file://c:/Saved_Charts/
An example of the configuration file for Logger information is shown in Figure 6.3.
#Logger_Config.properties file for LOGGER class
# Enter the number of log generation files you want here Log.Generation.Count=1
# Enter the max size of the log file here. # eg: Value in 1K bytes (i.e 10 = 10K)
Log.Max.Size=32
# Specify what kind of messages you want to log: # INFO / TRACE / ERROR / ALL / INFO, TRACE
Log.Filter=ALL
# Specify the Directory to place the log file Log.Path=C:\\Tomcat4.1\\Charting\\logs
Figure 6.3. Example of a Logger_config.properties file
6.2. Utility classes
Component: SessionController.java
A detailed description of SessionController.java component contained in the architecture is presented here.
Processing Detail: All components described in Chapter 4 and 5 make use of the SessionController class. Whenever any object needs to be stored in session for use by other classes, a get ( ) and set ( ) method is described for that object in SessionController.java. An instance of SessionController class is created only in the first JSP file that stores something in session, namely, PickYAxis.jsp.
// Code from PickYAxis.jsp
HttpSession session2 = request.getSession ( true ) ;
SessionController sc = new SessionController ( ) ;
// End of code
Figure 6.4. Sample code to create SessionController instance
PickYAxis.jsp stores the value for yAxisTable, which is the name of the table from which the y-axis attribute is selected.
Figure 6.5 describes the get ( ) and set ( ) methods in SessionController.java.
// Code from SessionController.java
private String yAxisTable ;
/* Get & Set methods for elements of X-Axis */
public void setYAxisTable ( String value ) {
yAxisTable = value ; }
public String getYAxisTable ( ) {
return yAxisTable ; }
// End of code
Figure 6.5. Sample code with get ( ) and set ( ) methods in SessionController
// Code from PickYAxis.jsp
//set value of yAxisTable in SessionController instance sc.setYAxisTable ( yAxisTable ) ;
//store ‘sc’ instance in session sc.setAttribute ( “sc”, sc ) ;
// End of code
Figure 6.6. Sample code to set an attribute value
If another JSP - PickRecords.jsp needs to retrieve the value of yAxisTable, it would simply extract the SessionController instance from session and extract yAxisTable value from that instance.
// Code from PickRecords.jsp
HttpSession session = request.getSession ( true ) ;
SessionController sc = null ;
String yAxisTable = “” ;
sc = ( SessionController ) session.getParameter ( “sc” ) ;
yAxisTable = sc.getYAxisTable ( ) ;
// End of code
Figure 6.7. Sample code to get an attribute value
Component: Logger.java
Processing Detail: All components described in Chapters 4 and 5 make use of the Logger class.
Logger.java acts as a tool to log information. This is transparent to the end-users. Only the owners of the web site will have access to this and they are allowed to log information, error and trace. The names of the log files are of the format “current-date-time.log”.
• Generation.Count – Number of log files to be generated • Max.Size – Maximum size of each file
• Filter – What to log? Information, Error, Trace or All • Log.Path – Where to place the log files
The owners of the web site may edit this configuration file to set the parameters.
Component: TableManager.java
Processing Detail: All components described in Chapters 3 and 4 make use of TableManager.java when
they need to do database calls. Various functions have been defined here. The external components that need to perform database operations need to simply call these functions. Database connection is established here.
The database operations supported by TableManager are:
• Select (table, criterion, attribute)
This function returns the result of select operation. The function formats a query in the form:
“Select <attribute> from <table> where <criterion>” and executes the query. Result of the query is returned in a Vector data structure.
• Row_Count (table)
This function formats a query as:
“Select count (*) from <table>” and executes the query. The total number of records in the result set is returned as an int.
Component: LoadRelation.java
Processing Detail: ProcessYAxis.java (described in Section 5.2) makes use of this class when the
7. Conclusion
ChartVisio plays a vital role in visual data mining [5]. It is simple to use, highly interactive and acts as a reliable tool to quickly explore data by representing the database as a visual. It is purely a web-based application and can be efficiently accessed from anywhere, anytime.
ChartVisio hides the underlying complex mechanisms from its users, except where it is absolutely appropriate and necessary to expose them. Hence, it enables even non-technical users to query into a database and generate charts with minimal effort and time.
The application is built on three-tier client-server architecture [10]. This ensures scalability, high performance and supports multiple-user environments. It is also very system-independent. This gives it advantages such as portability and wide application.
Users (website creators or owners and everyday Internet users) can draw simple charts to represent numerical data and get comparison-oriented results. Website owners have the option of saving charts as templates for future use. This is of tremendous significance when website owners or creators wish to show statistics like performance and make it available ready-made of the web. This allows prospective website surfers to view stored charts with the touch of a button and also get real-time data, since charts are generated dynamically.
Attribute for the Y-axis of the chart can be from a table selected from a set of all possible children tables of the X-axis table. There can be any number of steps dividing X-axis and Y-axis tables. Data from tables is mapped into data for charts using aggregate group functions, which are computed across the n-step division between the two tables. This provides users with a larger space to select axes of the chart.
Glossary
Apache Jakarta
Apache Jakarta is a significant open-source Servlet/JSP development project. Apache is heavily committed to supporting Java: there are a lot of sub-projects and at the heart of them is the Tomcat Servlet container module for the Apache Web server. Tomcat is the reference implementation for both Servlets and Java Server Pages.
Document Object Model (DOM)
DOM is a way of making XML data accessible to Java. DOM uses a tree-based parser that goes through the XML original and makes the contents available via Java methods.
Document Type Definition (DTD)
The purpose of a DTD is to define the legal building blocks of an XML document. It defines the document structure with a list of legal elements. The DTD can be used to verify the validity of an XML document.
Hyper Text Markup Language (HTML)
HTML is a format for encoding hypertext documents that may contain text, graphics, and references to programs and other hypertext documents. HTML consists of normal text and special codes (tags), which tell a Web browser how to display text.
Hyper Text Transfer Protocol (HTTP)
HTTP is the underlying protocol used by the Web to format and transmit messages. It determines the actions Web servers and browsers should take in response to various commands. HTTP is the protocol used between Tomcat server and clients.
Java
Java was designed to be completely object-oriented programming language developed by Sun. It is highly portable and includes features such as inheritance and polymorphism; and supports concurrent programming.
Java 2 Platform Enterprise Edition (J2EE)
J2EE defines the standard for developing multi-tier enterprise applications. J2EE supports the feature "Write Once, Run Anywhere" portability. J2EE adds full support for Enterprise Java Beanscomponents, JDBC API for database access, Java Servlets API, Java Server Pages and XML technology. J2EE simplifies enterprise applications by basing them on standardized, modular components. It includes specifications to ensure portability of applications across systems capable of supporting J2EE.
JDBC