R E S E A R C H
Open Access
Complement activation in multiple sclerosis
plaques: an immunohistochemical analysis
Gillian Ingram
1†, Sam Loveless
2†, Owain W Howell
3, Svetlana Hakobyan
2, Bethan Dancey
2, Claire L Harris
2,
Neil P Robertson
1, James W Neal
2and B Paul Morgan
2*Abstract
Introduction:Inflammation and complement activation are firmly implicated in the pathology of multiple sclerosis; however, the extent and nature of their involvement in specific pathological processes such as axonal damage, myelin loss and disease progression remains uncertain. This study aims to bring clarity to these questions.
Results:We describe a detailed immunohistochemical study to localise a strategically selected set of complement proteins, activation products and regulators in brain and spinal cord tissue of 17 patients with progressive multiple sclerosis and 16 control donors, including 9 with central nervous system disease. Active, chronic active and chronic inactive multiple sclerosis plaques (35 in total) and non-plaque areas were examined.
Multiple sclerosis plaques were consistently positive for complement proteins (C3, factor B, C1q), activation products (C3b, iC3b, C4d, terminal complement complex) and regulators (factor H, C1-inhibitor, clusterin), suggesting continuing local complement synthesis, activation and regulation despite the absence of other evidence of ongoing inflammation. Complement staining was most apparent in plaque and peri-plaque but also present in normal appearing white matter and cortical areas to a greater extent than in control tissue. C1q staining was present in all plaques suggesting a dominant role for the classical pathway. Cellular staining for complement components was largely restricted to reactive astrocytes, often adjacent to clusters of microglia in close apposition to complement opsonised myelin and damaged axons.
Conclusions:The findings demonstrate the ubiquity of complement involvement in multiple sclerosis, suggest a pathogenic role for complement contributing to cell, axon and myelin damage and make the case for targeting complement for multiple sclerosis monitoring and therapy.
Keywords:Multiple sclerosis, Demyelination, Complement, Immunology, Histology, Immunohistochemistry
Introduction
Multiple sclerosis (MS) is a chronic neuroinflammatory disease characterised by well demarcated white matter (WM) plaques of demyelination with varying degrees of axonal loss [1]. It is widely accepted that the disease process is initiated by adaptive immunity through infil-tration of activated T cells into the CNS with associated up-regulation of proinflammatory mediators. However, the lack of lymphocyte recruitment after the initial re-lapsing phase of disease indicates that other factors drive pathology in late stage disease and there is increasing
evidence implicating plasma cells and innate immunity in progressive disease [2].
Complement plays a central role in the innate immune system, providing an important defence against infection and immune complex disease. The system consists of approximately 30 circulating and membrane expressed proteins and is predominantly activated via the classical, alternative pathway or lectin pathways. These converge on a common effector pathway with formation of mem-brane attack complex (MAC) (which disrupts and forms pores in the phospholipid bilayer of a target cell), opso-nins (molecules that enhance the ability of macrophages and neutrophils with complement receptors to phagocyt-ose material - C3b, iC3b, C4b etc.) and anaphylatoxins (peptides that induce local and systemic inflammatory responses, increasing the permeability of blood vessels * Correspondence:[email protected]
†Equal contributors 2
Institute of Infection and Immunity, School of Medicine, Cardiff University, Cardiff, UK
Full list of author information is available at the end of the article
and attracting neutrophils through their chemotactic properties - C3a, C4a and C5a). Inappropriate activation of complement is normally prevented by complement inhibitors. A role for the complement system in MS has been established and is reviewed in Ingram 2010 [3]. Evi-dence implicating complement in MS came from studies measuring complement proteins in MS CNS tissue, plasma and CSF [4-6]. Numerous immunohistochemistry studies described the presence of complement proteins in and around areas of pathology in MS WM; however, ana-lyses were generally limited to one or a few complement proteins and small numbers of cases [7-13]. Together, the published studies do not build consensus on whether complement protein immunoreactivity is a consistent fea-ture in MS, which areas of the CNS demonstrate immu-noreactivity, or which complement proteins and pathways are involved. This is likely due to studies including tissue from different stages of the disease, limited numbers of patients examined and variability in quality of detection reagents used. The cumulative evidence suggests that only tissues from cases with established and progressive disease demonstrate consistent complement staining [11]. In addition very few studies have attempted to define underpinning mechanisms of complement involvement in MS and its contribution to the various components of demyelination and axonal damage. A notable exception was a study by Prineas who showed abundant C3d deposition on myelin in areas of pathology and suggested a direct role as an opsonin driving immune response to myelin antigens [9].
The paucity of robust data and the lack of consensus noted above provoked us to look again at complement proteins in MS CNS tissue. We describe a systematic immunohistochemical analysis of the presence and localisation of key complement components, activation products, regulators and receptors in tissue from well-documented progressive MS. We find that the presence of complement proteins and activation products in and around areas of pathology is a consistent feature of pro-gressive MS, although the extent varies between individ-uals. We note in particular, universal C1q staining indicative of classical pathway activation, and consistent staining for complement activation products, including in most cases the terminal complement complex (TCC), indicating activation to completion. These data bring clarity to a confused field, establish the significance of complement in the pathology of progressive MS and provide an evidence base for targeting complement in diagnosis, monitoring and therapy of MS.
Materials and methods
Cases
Archival blocks comprising 10% formalin-fixed, paraffin-embedded CNS tissue obtained at autopsy from 17
clinically and neuropathologically validated MS cases and 16 controls, including 9 controls with other CNS in-flammatory and non-inin-flammatory diseases (labelled neurological controls) were used in this study (patient and control details in Table 1). Tissue was obtained from cerebral cortex from all cases and controls, and from spinal cord from 11 cases and 8 controls. MS and non-neurological control tissue was provided by the UK MS Tissue Bank, Imperial College London. Neuroinflamma-tory disease control tissue was from the Thomas Willis Brain Bank, Oxford University and Brains for Dementia Research, Brain Bank, IOP, King’s College London. In each case clinical and demographic details and interval between death and tissue collection were provided. Ethical approval was gained from the South East Wales Research Ethics Committee (10/WSE02/4).
Histological staining and lesion characterisation
Paraffin wax tissue sections 4 microns in thickness were cut and stained with Luxol fast blue (LFB) to assess presence of myelin and identify areas of demyelinated plaque, peri-plaque and normal-appearing WM. This allowed identification of lymphocytes, plasma cells and foamy macrophages containing myelin degradation products (also positive with anti-MOG staining). Areas selected as normal-appearing WM were at least 1 cm away from the edge of the demyelinating plaque. Cor-tical grey matter (GM) was identified adjacent to and sometimes continuous with the peri-plaque; the GM areas showed neither meningeal inflammation nor peri-vascular inflammatory cells.
Anti-HLA-DR antibody was used to identify microglia and anti-MOG antibody to detect myelin. MS lesions were classified as either classical active (profound in-flammation with microglia and macrophages containing myelin degradation products) or slowly expanding (cen-tral profound axonal loss with loss of macrophages, with a rim of activated microglia and moderate inflammation) [14]. Slowly expanding lesions were further subdivided into either chronic active (residual plaque centre inflam-mation and profound microglial inflaminflam-mation at the plaque border) or chronic inactive (immunologically si-lent lesion centre with a well demarcated lesion border showing only mild inflammation) (examples shown in Figure 1) [14]. Spinal cord sections were also analysed for plaque subtype according to this classification. To ensure accuracy of lesion classification, all sections were assessed by three independent trained observers (JWN; OWH; GI); inter-observer concordance was 100%.
Immunohistochemistry
Paraffin wax sections were de-paraffinated using xylol and rehydrated in serial aqueous dilutions of ethanol (100%, 96%, 70%, 0%). For antigen retrieval, sections
Ingramet al. Acta Neuropathologica Communications2014,2:53 Page 2 of 15
were either heated in citraconic anhydride (pH 7.4; 45 mins at 100°C) or immersed in protein kinase 20μg/ml (20 mins at 37°C; for primary antibody B7 only). Prior to staining, sections were blocked in 10% normal goat serum. To ensure optimal consistency, staining was per-formed using an autostainer (DAKO EnVision™+ System). Endogenous peroxidase was blocked by 10 mins incuba-tion in 3% H2O2. Primary antibodies, including antigen target, clone, concentration, dilution and source, are listed in Additional file 1: Table S1. Appropriate secondary
antibodies were from Dako and DAB chromogen was used for visualisation.
Double labelling was performed with two peroxidase
steps according to the manufacturer’s recommended
protocols (www.vectorlabs.com, A guide to multiple antigen labelling); blocked sections were incubated for 1 hour with the first primary antibody followed by 30 mins with the appropriate peroxidase-labelled secondary antibody and then stained using Vector SG peroxidase substrate kit (Vector Laboratories, www.vectorlabs.com).
Table 1 Patient clinical characteristics details
Case number Disease status Age at death Sex Death to TPT DD Cause of death
MS055 SPMS 47 F 15 32 Pneumonia
MS058 SPMS 51 F 15 21 MS
MS061 PRMS 56 F 6 >15 Adenocarcinoma
MS064 SPMS 66 M 56 28 Pneumonia
MS128 SPMS 78 F 22 50 Pneumonia
MS179 SPMS 70 F 20 25 Pneumonia
MS306 SPMS 78 M 17 42 Clostridium difficile diarrhoea
MS307 SPMS 55 M 19 20 MS
MS312 SPMS 68 F 24 23 Urinary sepsis
MS372 SPMS 82 F 7 46 Pneumonia
MS383 PPMS 42 M 17 8 Pneumonia
MS24 PPMS 71 F 96 22 Pneumonia
MS160 SPMS 44 F 18 16 Pneumonia
MS225 SPMS 79 F 23 32 MS, Diabetes mellitus, deep vein thrombosis
MS230 SPMS 42 F 31 19 MS
MS234 SPMS 39 F 15 15 Pulmonary embolism/Pneumonia
MS377 SPMS 50 F 22 23 Pneumonia
C21 C 91 F 127 N/A Pneumonia
C29 C 71 M 33 N/A Abdominal haemorrhage
C23 NC 93 F 51 N/A Alzheimer’s disease
C36 C 68 M 30 N/A Cryptogenic fibrosing alveolitis
C37 C 84 M 5 N/A Pneumonia, bladder cancer
C38 C 85 M 27 N/A Ischaemic heart disease
C39 C 82 M 21 N/A Myelodysplastic syndrome
C40 NC 86 F 29 N/A Acute cortical ischemic infarction
C41 C 54 M 20 N/A Lung cancer
NP7407-2 NC 93 F 24 N/A Acute cortical ischemic infarction
1228/91-b NC 88 F 24 N/A Acute cortical ischemic infarction
A140_07 NC 81 F 17 N/A Alzheimer’s disease
A173_08 NC 85 F 30 N/A Alzheimer’s disease
A192_2 NC 96 F 19 N/A Alzheimer’s disease
B5046-15 NC 42 M 72 N/A Herpes simplex encephalitis
B5125-9 NC 54 M 96 N/A Herpes simplex encephalitis
Sections were subsequently blocked for 10 mins with 10% normal goat serum, incubated for 1 hour with the second primary antibody and for 30 mins with the peroxidase-labelled secondary antibody which was visua-lised with DAB chromogen. In this system the peroxid-ase substrate yields a grey stain and the DAB label a brown stain, enabling the two primary antibodies to be visualised on the same slide in different colours. The
sections were dehydrated prior to permanent mounting in DPX.
For immunofluorescence, sections were stained se-quentially for complement and cell specific markers at room temperature, according to published protocols [15]. When two monoclonal antibodies of different IgG isotypes were tested (HLA-DR (IgG1) and complement activation product iC3b (IgG2a), for example), then Figure 1Plaque morphology in MS cases.Paraffin wax sections stained with LFB(A1, B1 and C1)and anti-HLA DR(A2, B2 and C2)showing an active (A1-A2; case MS160_S3), chronic active (B1-B2; case MS225_S13) and chronic inactive plaque (C1-C2; case MS61_B). The active plaque shows profound inflammation with anti-HLA-DR immunopositive microglia (A2and inset) and foamy macrophages containing myelin degradation products demonstrated using LFB (inset inA1). The chronic active plaque shows little inflammation in the centre of the plaque (insets inB1andB2) but abundant anti-HLA-DR immunopositive microglial at the plaque border(B2). The chronic inactive plaque shows an immunologically silent lesion centre (inset inC1andC2) and a well demarcated lesion border showing only mild inflammation (C2and inset) Scale bars are shown inB2and are applicable for all plates and inserts.
Ingramet al. Acta Neuropathologica Communications2014,2:53 Page 4 of 15
subtype selective goat anti-mouse IgG1-Cyanine 2 con-jugate (Stratech Scientific, Newmarket, UK), and biotin-linked goat anti-mouse IgG2a (Abcam, Cambridge, UK) and streptavidin- Alexa 594 (Life Technologies, Paisley, UK), were applied sequentially. Negative controls were run in parallel, and involved omission of one or both pri-mary antibodies and/or inclusion of an irrelevant isotype control antibody. All such controls were devoid of stain-ing. Following incubations with the secondary antibodies, all sections were counterstained with 4′ ,6-Diamidino-2-phenylindole dihydrochloride (DAPI; Sigma), quenched in 0.1% w/vol Sudan black B (VWR International), rinsed in deionised water and coverslipped with Vectashield aque-ous mountant (Vector Labs, Peterborough, UK).
Sections were analysed on a Zeiss Axio Imager 2 under epifluorescence and images captured using a Zeiss AxioCam MRm camera or by confocal laser scanning microscopy with Zeiss LSM-710 and inverted Axio Ob-server microscope with oil-immersion 40X and 63X ob-jectives. All images were analyzed off-line using ImageJ (http://rsb.info.nih.gov/ij/) and prepared in Photoshop CS2 (Adobe Systems, Uxbridge, UK) for publication.
Positive control tissue sections for testing the anti-complement antibodies comprised arrayed fixed tissue sections [16] from renal biopsies taken from glomerulo-nephritis patients and myocardium from a patient with myocarditis due to adenovirus; all antibodies positively labelled these sections using the described protocols (Additional file 2: Figure S1).
Quantitative analysis
All stained sections were digitally scanned at x40 magni-fication of the objective lens (0.037 mm2/field). In each section, areas representative of plaque (P), peri-plaque (PP), WM and GM were identified and five different fields from each area were selected manually for further analysis. For quantification, the selected fields were over-laid with a grid and positively labelled cells within the grid for each of the individual antibodies were manually counted. Values were expressed as the number of posi-tively labelled cells per mm2. In order to verify data, inter-rater agreement was assessed between two inde-pendent trained observers (GI; SL) over 30 scanned fields from different sections, patients and primary anti-bodies; inter-observer correlation coefficient was 0.99. Non-cellular interstitial staining and myelin staining was classified as either negative (−), weakly positive (+), moderately positive (++) or strongly positive (+++) based on criteria established in house [17].
Statistical analysis
Data analysis was performed using Statistical package for Social Sciences version 20 (SPSS, Chicago, USA). Data were not normally distributed and therefore were analysed
using non-parametric tests. MS patients were compared to normal and neurological control groups using the Kruskal-Wallis Test for independent values. Where posi-tive, subgroups were analysed using the Mann–Whitney U test. Differences between MS disease subgroups (P, PP,
WM, GM) were analysed using Freidman’s ANOVA and
where positive, post-hoc procedures were performed using the Wilcoxon Signed Ranks Test. Differences between ac-tive, chronic active and chronic inactive plaques were ana-lysed using the Kruskal-Wallis Test for independent values. Where positive, subgroups were analysed using the Mann–Whitney U test. For most tests a P value of <0.05 was considered significant. For subgroup analysis to com-pensate for the inflation of type I errors due to multiple testing, a p value of <0.025 was taken as significant (0.05 divided by the number of tests).
Results
Characteristics of MS lesions studied
All cases examined were from patients with progressive MS, most with long-standing disease (mean disease dur-ation 26 +/− 12 yrs, mean age at death 59 +/− 15 yrs) (Table 1). Both control groups had higher mean age at death (non-neurological controls 76 +/−13 yrs, p = 0.021; neurological controls 80 +/−19 yrs, p = 0.003). There were no significant differences between the time to tissue pres-ervation (TTP) in each group (MS 24.88 +/− 21.36 hrs; non-neurological controls 37.57 +/−40.48 hrs, p = 0.317; neurological controls 40.22 +/−27.35 hrs, p = 0.190). MS lesions were classified depending on lesion activity. Of the 35 plaques examined, 8 were classified as active and 27 as slowly expanding, 9 of the chronic active and 18 of the chronic inactive type (Figure 1). An additional seven MS sections examined comprised only WM and GM with no plaque. MS sections were almost devoid of lymphocytes or plasma cells with only a few T or B cells identified within the blood vessel wall and perivascular space and an occasional T cell observed within the plaques of active le-sions (Additional file 2: Figure S1). CNPase positive oligo-dendrocytes were universally absent from all plaques examined. In MS WM and GM, astrocyte cell counts were not significantly different from non-neurological or neuro-logical controls (Figures 2 and 3); however microglial cell counts were significantly higher in MS WM than non-neurological control WM, but higher still in the WM and GM of the neurological control group (this being the area of pathology in this group).
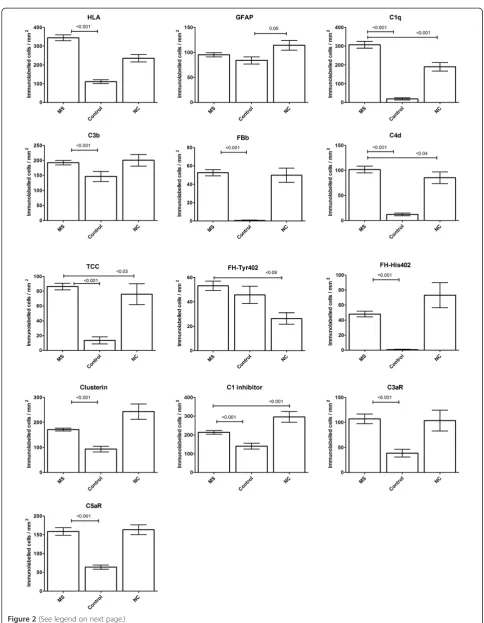
Complement immunolabelling is ubiquitous in MS lesions
Figure 2(See legend on next page.)
Ingramet al. Acta Neuropathologica Communications2014,2:53 Page 6 of 15
restricted to background extracellular immunolabelling, except for antibodies against C3b, clusterin, fH-Tyr402 and C1inhibitor (C1inh) which significantly stained cells in some controls (Figure 2). One of nine neurological con-trols (an Alzheimer’s disease case) showed no complement staining, but for the other neurological controls, staining for most complement proteins was seen in a similar num-ber of cases to that in MS; the exception was C1q staining which was significantly higher in MS tissue (Figure 2). Paraffin wax sections from kidney tissue with glomerulo-nephritis and myocardium with viral myocarditis showed immunolabelling in relevant areas for all antibodies used (Additional file 2: Figure S1). Sections stained with isotope control antibodies (IgG1 or IgG2) were consistently negative in both MS cases and controls (Additional file 2: Figure S1).
Complement immunolabelling in MS is predominantly cell-associated
The majority of observed complement immunolabelling in MS cases was cell-associated, either surface or within the cell (not distinguishable in immunohistochemistry), while cell immunolabelling in non-neurological controls was weaker and predominantly nuclear (Additional file 2: Figure S1). Cell immunolabelling in the neurological con-trol group was marked, especially in areas of inflammation and obvious disease pathology, for example, in and around Alzheimer’s plaques (Additional file 2: Figure S1).
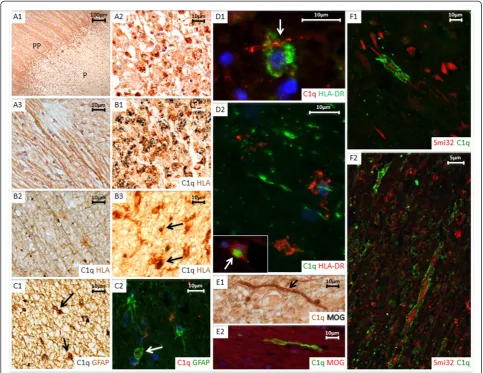
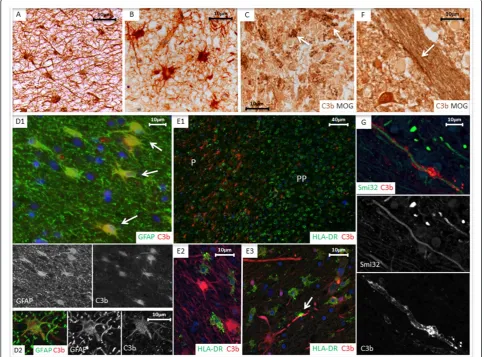
Cell complement immunolabelling within the plaque and peri-plaque areas in MS sections was consistently associated with cells morphologically resembling astro-cytes for all complement proteins tested except the ana-phylatoxin receptors C3aR and C5aR (Figures 4, 5 and Additional file 3: Figure S2). Double immunolabelling confirmed this observation; C1q and C3b co-localized with GFAP + reactive astrocytes within the plaque and peri-plaque (C3b in this manuscript refers to immunola-belling with the C3b/iC3b-specific monoclonal antibody C3/30) (Figures 4 and 5). C1q and C3b stained reactive astrocytes were often in close proximity to clusters of HLA-positive microglia with activated morphology and macrophages containing complement-stained debris, seen especially in active plaque centres (Figures 4 and 5). C1q also co-localized with HLA + activated microglia, contrib-uting to the increased cell-associated C1q immunolabelling in the peri-plaque (Figures 3 and 4); these cells were also positive for anaphylatoxin receptors C3aR and C5aR
(Additional file 3: Figure S2). GFAP positive astrocytes within the GM did not stain for complement; indeed, com-plement immunolabelling of all comcom-plement antibodies within the GM in MS and controls was mainly limited to neurones (Additional file 4: Figure S3).
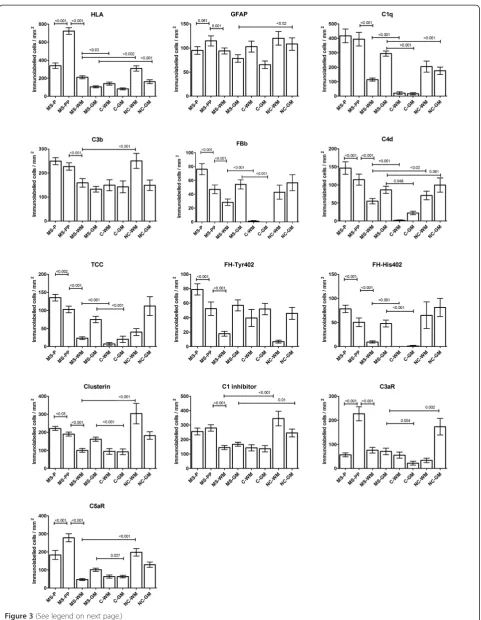
The number of cells immunolabelling for each comple-ment protein was counted in all fields and compared, MS with controls, and within the MS sample, plaque, peri-plaque, WM and GM (Figures 2 and 3). Cellular immuno-labelling of all complement antibodies in the neurological control group was restricted to cells morphologically re-sembling microglia within WM and neurones within GM. No complement component immunolabelling was ob-served on astrocytes in either normal or neurological con-trol groups. This finding was confirmed with double labelling experiments (Additional file 2: Figure S1).
Complement activation markers are characteristic of MS
Cellular and non-cellular immunolabelling for the clas-sical pathway protein C1q was strongly positive in both MS and neurological control groups; 100% of MS sec-tions were stained for C1q compared to 77.8% of neuro-logical control sections, while 10% (p < 0.001) of normal control sections showed weak C1q staining (Additional file 5: Figure S4). There were significantly more posi-tively stained cells in MS sections compared to both non-neurological and neurological controls (p < 0.001; Figure 2). In MS sections, C1q immunolabelling was found on cells morphologically resembling both astro-cytes and microglia, most abundantly in the plaque and peri-plaque areas but also in WM; in GM, C1q immuno-labelling of neurones was seen (Figures 3 and 4).
The majority of MS sections were positive for the clas-sical pathway activation fragment C4d (Additional file 5: Figure S4); despite some cellular immunolabelling of C4d in control sections, cell immunolabelling for C4d in MS sections was markedly higher than in non-neurological controls (p < 0.001, Figure 2), and was most abundant in peri-plaque and plaque and minimal in WM (Figure 3). In GM, some cell-associated (predominantly neuronal) C4d immunolabelling, was present in all groups (Additional file 4: Figure S3).
Alternative pathway activation fragment Bb (Bb) was positive in 59.5% of MS sections compared to 7.1% (p < 0.001) of non-neurological controls and 54.5% of neuro-logical controls (Additional file 5: Figure S4), indicating ongoing activation of the alternative pathway in MS. (See figure on previous page.)
Figure 3(See legend on next page.)
Ingramet al. Acta Neuropathologica Communications2014,2:53 Page 8 of 15
Immunolabelling of cells morphologically resembling as-trocytes, was most abundant within the peri-plaque and plaque (p < 0.001; Figure 3), although Bb-immunostained cells were present at increased levels in MS compared to non-neurological controls in both WM and GM (p < 0.001; Figure 3), suggesting that alternative pathway acti-vation occurred throughout the brain in MS, not just within the plaque core.
Cell immunolabelling for C3b/iC3b was detected in al-most all MS sections, but was also present in neuro-logical controls and weakly in some non-neuroneuro-logical controls (90.5% MS, 50% non-neurological controls (p < 0.001), 81.8% neurological controls; Additional file 5: Figure S4); numbers of positively stained cells/mm2 in MS sections were significantly higher compared to non-neurological controls (p < 0.001; Figure 2); staining was strongest in plaque and peri-plaque (Figure 3). These findings were confirmed in three MS cases (MS 55, MS 61 and MS 64) using another mAb specific for iC3b (A209, data not shown). Quantified cellular immunola-belling of these two C3b/iC3b mAbs (C3/30 and A209) showed an intraclass correlation coefficient of 0.85 (95% CI 0.76-0.91, p < 0.001).
Terminal pathway activation assessed using a TCC-specific mAb was positive in 71.4% of MS sections com-pared with 7.1% of non-neurological controls (p < 0.001) and 54% of neurological controls (Additional file 5: Figure S4), with significantly more positively stained cells in MS cases compared to non-neurological controls (p < 0.001, Figure 2). Immunolabelling for TCC was strongest in the plaque and peri-plaque but was also present in WM and GM where TCC immunolabelled cells (in MS groups morphologically resembling astrocytes in the WM (Additional file 4: Figure S3) and neurones in the GM) were more frequent than in non-neurological con-trols (p < 0.001 for both, Figure 3). Of note, all MS sec-tions that contained TCC immunopositive cells also showed comparable positive immunolabelling for C3b; however, some sections positive for C3b showed weak or absent TCC staining.
Cell expression of complement regulators and receptors is altered in MS
To inform speculation regarding consequences of local complement activation on CNS cells in MS, sections
were stained with mAb specific for the key plasma-derived complement regulators C1inh, factor H (fH) and clusterin, and the anaphylatoxin receptors C3aR and C5aR. This selection was pragmatic and dictated by availability of mAb (in house or commercial) that were suitable for use in formalin fixed tissue. Expression of both classical pathway regulator C1inh and terminal pathway regulator clusterin was found in most MS sec-tions, strongest in astrocytes in the plaque and peri-plaque area (Figure 3 and Additional file 4: Figure S3 and Additional file 5: Figure S4). Although cell expres-sion of both C1inh and clusterin was stronger and more frequent in MS compared to non-neurological controls (Figure 2), there was background WM and GM immu-nolabelling in both MS and control sections (Figure 3).
Expression of the alternative pathway regulator fH was assessed using mAb specific for the Tyr402His poly-morphic variants (described in [18]). Cellular immunola-belling for either or both variants was seen in 13 of 17 MS cases with higher numbers of positively immuno-labelled cells in the plaque and peri-plaque areas com-pared to the WM (p < 0.001; Figure 3); cellular immunolabelling for the two variants was positive in each case. Eight of nine neurological controls showed cell immunolabelling for Tyr402 and seven of these were also His402 positive. Of the seven non-neurological con-trols, five were Tyr402 positive and one was also positive for His402 (Additional file 5: Figure S4). In MS sections, 26 of 42 showed immunolabelling for either or both var-iants with high numbers of positively immunolabelled cells in the plaque and peri-plaque areas compared to the WM (p < 0.001; Figure 3); of the 26 positive sections, 6 stained only for Tyr402, 17 stained for both variants and 3 stained only for His 402. In normal control sec-tions, 9 of 14 sections showed immunolabelling, 8 of these stained for Tyr402 only and one for both variants. In neurological control sections, 6 of 11 sections showed immunolabelling, 3 of these stained for Tyr402 only and 3 for both variants (Additional file 5: Figure S4).
Cellular immunolabelling of the anaphylatoxin recep-tors C3aR and C5aR was restricted to microglia with morphology compatible with activation. Immunolabel-ling for C3aR was observed in 90% of MS sections and
40% of non-neurological controls (p = 0.004, s0al
Figure 4) whereas C5aR was observed in the majority of (See figure on previous page.)
MS and control sections, although the number of immu-nolabelled cells in MS cases and neurological controls was almost 3-fold higher compared to non-neurological controls (p < 0.001 for both C3aR and C5aR; Figure 2). Cell immunolabelling for C3aR and C5aR in MS sec-tions was highest in the peri-plaque compared to plaque and WM (p < 0.001; Figure 3), with predominant
co-localization with HLA positive microglia within the peri-plaque areas (Additional file 3: Figure S2). C3aR immuno-labelling was also observed on the cerebral vessel endothe-lium and smooth muscle cells within the vessel wall in MS tissue. C3aR and C5aR immunolabelling in WM and GM was weak and not different in MS compared to non-neurological control sections; in contrast in non-neurological Figure 4Cell associated C1q complement staining.Paraffin wax sectionsA1,A2andA3(case MS160_S3, active case).A1shows immunolabelling with anti-C1q in plaque (P) and peri-plaque (PP) areas.A2shows C1q immunopositive debris (brown) within foamy macrophages localized in the centre of an active plaque.A3shows C1q immunolabelled on myelin.B1paraffin wax section double immunolabelled with C1q (grey) and anti-HLA-DR (brown) confirms C1q immunopositive debris located within HLA positive foamy macrophages cells; (case MS160_S3, active plaque).B2and B3also show paraffin wax sections with immune double staining of anti-C1q and anti-HLA-DR (case MS230_s2, chronic active plaque).B2shows HLA-DR positive cells (brown) closely associated with C1q positive myelin (grey) within the white matter.B3shows co-localisation of C1q on HLA-DR positive microglia (arrows) in the peri-plaque.C1(case MS372_22, chronic active plaque) andC2(case MS230_S2, chronic active plaque, stained using immunofluorescence (IFC)) show double labelling for C1q and GFAP, with colocalisation of C1q (grey) and GFAP (brown) in some but not all cells (insert inC1and arrow inC2highlighting colocalisation). IFC in figureD1(case MS377_S2, active plaque) andD2(case MS160_S1, active plaque) demonstrate anti-HLA-DR positive macrophages closely associated with C1q positive myelin (arrow). Inset inD2shows C1q immunopositive debris within an HLA-DR immunolabelled macrophage (arrow).E1shows a myelin sheath at edge of an active plaque staining with anti-MOG (grey) and C1q (brown) (case MS160_S3, arrow); in the same areaE2(IFC, case MS160_S3) shows a myelin sheath with positive anti-C1q immunolabelling. FiguresF1 (MS160_S3/1; chronic active plaque) andF2(MS336_1; active plaque), captured with confocal laser scanning microscopy, show disrupted myelin, immuno-positive for C1q associated with anti-SMI-32 immunopositive non-phosphorylated axon profiles in chronic and active areas. Scale bars are shown for each plate.
Ingramet al. Acta Neuropathologica Communications2014,2:53 Page 10 of 15
control WM and, even more markedly, GM, strong microglial staining for C3aR and C5aR was consistently found (Figure 3).
Complement immunolabelling of myelin is characteristic of MS
Immunolabelling for one or more complement protein was present on myelin, intact or with a fragmented or disrupted appearance in 64.3% of MS sections compared to 36.4% of neurological control sections and 28.6% of non-neurological control sections (comparison of myelin immunolabelling in MS versus non-neurological controls; p = 0.035, Additional file 5: Figure S4). Complement
immunolabelling of myelin in MS was predominantly ob-served in peri-plaque areas, with some immunolabelling of fragmented myelin within plaques (Figures 4 and 5 and Additional file 4: Figure S3). Of the MS sections, 14.3% showed positive myelin immunolabelling for C1q, 7.1% for Bb, 19% for C3b, but none were stained for TCC. Of the regulators, 26.2% of MS sections showed positive myelin immunolabelling for C1inh and 9.5% for clusterin; myelin staining for fH variants was remarkable in that staining for the less common fH-His402 variant was almost twice as frequent as for the more common fH-Tyr402 variant (31% versus 16.7% of sections and seven compared to five out of 14 cases).
Myelin staining for regulators was minimal in controls except for low level C1inh staining in non-neurological controls (one case) and staining for clusterin (one case) and fH-His402 (two cases) in neurological controls; however, because of the broad variability between sec-tions for myelin immunolabelling, only fH-His402 was significantly different from controls (Additional file 5: Figure S4). In MS sections, myelin fragments immuno-positive for complement proteins were frequently present at the lesion edge, associated with both HLA-positive microglia and SMI32-HLA-positive stressed/damaged axons (Figures 4 and 5). These features were not ob-served in control sections.
Complement immunolabelling marks active plaques
Significantly more immunolabelling of complement pro-teins, activation products and regulators was observed in the plaque and peri-plaque areas of active and chronic active compared to inactive plaques (Additional file 6: Figure S5). Overall there was little difference in comple-ment immunolabelling observed between the active and chronic active plaques except for two of the regulators (fH-His 402 and clusterin) where immunolabelled cells were observed more frequently in chronic active plaques (Additional file 6: Figure S5).
Immunolabelling of C3aR was minimal in the active plaque centres and peri-plaque areas, but seen much more frequently in the inactive peri-plaque; where al-though few microglia were observed, the majority of these showed C3aR immunolabelling. C5aR immunolabelling was observed equally in all plaque types (Additional file 6: Figure S5).
All of the plaques in spinal cord sections examined were inactive (making up ten of the 18 inactive plaques examined). Immunolabelling for the majority of comple-ment antibodies was similar to but significantly lower in the spinal cord sections compared with brain sections, except for the anaphylatoxin receptors in which immu-nolabelled cells were observed more frequently in cord (data not shown).
Discussion
There is on-going debate surrounding the contribution of inflammation to the relentless axonal degeneration seen in MS patients, clinically most apparent in progres-sive disease; absence of immune cells and lack of efficacy of anti-inflammatories has led some to postulate a com-plex and as yet undefined neurodegenerative process to explain the relentless brain atrophy [19]. We show that complement proteins, activation products, regulators and receptors are markers of CNS innate immune acti-vation, present in active plaques but persisting even in late stage disease when plaques become inactive, indicating that synthesis, activation and regulation of complement
are all on-going in plaque and peri-plaque areas of brain and spinal cord in late-stage MS.
In chronic active and inactive plaques, complement markers occurred in the absence of other inflammation markers, including lymphocytes, plasma cells and foamy macrophages; demonstrating that progression of inflam-mation in MS CNS does not rely on infiltrating cells; once initiated, inflammation can be driven by innate im-mune mechanisms such as complement. These findings support our previous studies showing systemic comple-ment activation and regulation in MS throughout the disease course [20]; in particular, increased serum fH levels were specific to progressive disease and predicted relapse [18], suggesting an active role in late stage disease.
The profile of complement immunolabelled cells was similar in patients with active and chronic active plaques but markedly different in patients with other neuroin-flammatory diseases - encephalitis, Alzheimer’s disease and ischaemic infarction. In MS, complement staining was predominantly associated with GFAP + astrocytes in plaque and peri-plaque areas; in contrast, in neurological controls, cellular complement staining associated with microglia in WM and neurones in GM. In encephalitis and ischaemic infarction cases, the time from patho-logical insult to death was short in comparison to Alzheimer’s disease and MS where complement expres-sion and activation is maintained over years. In ischae-mic infarction there is catastrophic blood brain barrier (BBB) disruption, facilitating entry of complement; in MS, Alzheimer’s disease and encephalitis where the de-gree of BBB disruption is uncertain, local synthesis may be an important contributor and it is known that glial cells can produce all complement components needed for terminal pathway activation [21].
Evidence implicating the classical pathway in MS pathogenesis was described over thirty years ago. Im-mune complexes were demonstrated in MS CSF and brain with associated binding of C1q and classical path-way activation [22]; in parallel, it was shown that oligo-clonal immunoglobulins were present in CSF in most MS patients [23], the result of intrathecal synthesis [24]. Even in the absence of antibody, the classical pathway can be triggered by C1q directly binding damaged mye-lin [25]. Here we confirm that C1q is a powerful disease marker, present in all MS cases and minimal in controls. C1q immunolocalized to reactive astrocytes, microglia and myelin in peri-plaque and plaque areas; immunola-belling does not distinguish between protein on and in cells - it is entirely possible that astrocyte staining for C1q and other complement proteins represents biosyn-thesis, especially in inactive chronic lesions where BBB breakdown is minimal. In contrast, astrocyte- and myelin-associated C3- and C4-derived activation fragments and
Ingramet al. Acta Neuropathologica Communications2014,2:53 Page 12 of 15
TCC in MS brain is strong evidence of ongoing classical pathway activation and implies that at least some of the C1q is on the astrocyte surface and activating. The alter-native pathway marker Bb was positive in the majority of MS cases, suggesting that amplification through this path-way was a significant contributor.
Complement regulators assessed in this study showed increased immunolabelling in plaque and peri-plaque areas indicating the ongoing capacity for local comple-ment inhibition throughout MS disease course. In light of our published finding that the relative plasma levels of the variants of regulator fH alter in progressive MS [18], the Tyr402His polymorphic variants (minor allele frequency 0.3) were separately measured; remarkably, the relative staining of Tyr and His variants was mark-edly different between MS cases and controls, suggesting that there were qualitative differences in fH variant ex-pression and/or deposition between cases and controls with more frequent cell-associated fH, and in particular the His402 variant, in MS. The functional consequences and relevance to disease progression of this remain to be ascertained; however, in age-related macular degener-ation (AMD), differential binding of the fH-Tyr402His variants in retina has been demonstrated and proposed as the mechanism by which fH-His402 is risk for AMD [26]. Of note, we previously demonstrated increased plasma levels of fH and altered Tyr402His ratio in pro-gressive MS with over-representation of His402 in het-erozygous patients [18].
Our data demonstrate considerable heterogeneity of complement immunolabelling in MS cases. Pathological heterogeneity and heterogeneity of complement staining in MS lesions was described by Lucchinetti and col-leagues; they proposed four distinct patterns of MS le-sions with only 50% of patients showing complement immunolabelling, limited in their study to TCC immu-nolabelling using the mAb B7, also used in our work [10,27]. Others have contested this, using a wider range of complement markers and reporting consistent com-plement immunolabelling in all lesions and cases exam-ined [11]. Our data agree in part with the findings of Lucchineti in that 71% of sections were TCC+; however, all were C1q +, most C3b/iC3b + and all TCC + sections were strongly C3b/iC3b+. Together these data indicate that complement staining is a ubiquitous feature of MS lesions but the pattern of staining is variable. We suggest that TCC is a reliable marker for complement activation in MS; its near-complete absence in controls supports its use in isolation as a marker. In our hands, very few lesions were negative for TCC and C3b/iC3b and these were C1q+, which may also be a useful marker despite its presence in control tissues.
The predominant staining of reactive astrocytes for complement activation products including iC3b and
TCC has not previously been described in MS and was disease-specific; complement activation marker staining in neurological controls was extracellular and on micro-glia/macrophages in the tissue. The data suggest that this astrocyte-restricted pattern of complement staining is specific to demyelinating disease. Complement-mediated astrocytic impairment was recently described in neuromyelitis optica [28]; our findings imply that this may also be a feature of progressive MS. Complement-stained astrocytes were often co-localised with clusters of activated microglia, a finding that has previously been reported in MS and linked to complement priming of microglia contributing to CNS inflammation [29]. The notion of astrocytes contributing to pathological process in MS by enhancement of immune response and disrup-tion of myelin has recently been raised in a number of studies [30,31].
Immunolabelling of disrupted myelin in MS lesions, previously cited as evidence of complement-mediated pathology, was limited and variable in this study. Breij et al. [11] described myelin staining for C3d but not TCC in active lesions. Myelin staining for complement proteins has been suggested to be a non-specific feature [12]; however, using double immunolabelling we found complement markers co-localized in areas of degenerat-ing myelin and damaged axons in MS sections (Figures 4 and 5), implicating complement in axonal and myelin in-jury in and around active and chronic plaques. Absence of TCC may reflect efficient regulation of terminal path-way activation at these sites or an inability of TCC/MAC to intercalate into myelin. Clusters of activated microglia were frequently found in close apposition to damaged myelin, likely representing iC3b/CR3-mediated opsonic clearance.
C3aR and C5aR were expressed on microglia in and around the plaque, a finding previously reported in acute plaques [32,33], but not in chronic active and inactive slowly expanding lesions studied here; indeed, numbers of C3aR/C5aR-positive microglia were higher in chronic/ inactive lesions than in the few active plaques observed. The abundance of C3aR/C5aR-positive microglia in the peri-plaque suggests a capacity for locally generated C3a and C5a to recruit and activate microglia even in late lesions.
Conclusions
of measuring and monitoring MS disease activity in vivo. Imaging complement activation using labelled antibodies or ligands to target activation products is a rapidly evolving concept that might find particular relevance in MS and other CNS diseases [34,35]. Our data show that C1q, iC3b and TCC all present viable imaging targets in MS. Identification of complement activation through a combination of imaging and plasma markers might iden-tify those patients most likely to benefit from the grow-ing list of anti-complement therapies.
Additional files
Additional file 1: Table S1.Antibodies used for immunohistochemistry.
Additional file 2: Figure S1.Control sections. Figures showing examples of complement immunolabelling in paraffin wax sections from white matter from cases of acute and chronic neurological inflammation and normal control white matter immunostained with antibodies to C3b, C1q and C1 inhibitor. Alzheimer’s disease (AD), cases A192 and A173 (plates A1-A5), shows minimal immunolabelling of complement except within the amyloid plaque (inset A1). Herpes Simplex Virus encephalitis (HSV), cases B5046-15 and B5125-9 (B1-5) shows more cellular and non-cellular immunolabelling of complement. Cellular immunolabelling of C3b (C1), C1q (C2) and C1inh (C3) is demonstrated in white matter of a case of ischaemic stroke (case 122891-b) with immunolabelling of macrophages and microglia within the infarcted tissue. Non-neurological control white matter, cases C041 and C038 (D1-5) showed minimal complement immunolabelling. Double labelling in both neurological and non-neuro-logical control cases demonstrated colocalisation of C3b with HLA positive microglia (D4) but not GFAP positive astrocytes (D5). E1 demonstrates positive immunolabelling of C3b within the glomeruli of kidney sections with glomerulonephritis. E2 (C1q) and E3 (C1inh) demonstrate C1q deposition on the cardiac myocardial cells and C1 inh located on the sarcolemma in cardiac myocytes in section of myocardium from patients with myocarditis due to an adenovirus infection. Isotype anti-IgG1 (F, case MS64_B) and anti-IgG2 (not shown) were consistently immunonegative. MS tissue containing an active plaque (G) with a small diameter blood vessel demonstrated immunolabelling of T lymphocytes with in the blood vessel wall and occasionally within the perivascular space; minimal positive immunolabelling for anti -CD3 was is seen in the plaque. Scale bar is shown in A1 and is applicable for plate A, B, C and D. Scale bars for plates E, F and G are shown on each plate.
Additional file 3: Figure S2.Complement anaphylatoxin receptors. Paraffin wax sections immunolabelled with C3aR (A1-4) and anti-C5aR (B1-4). Figure A1 (case MS307_20, inactive plaque) and B1 (case MS230_S2, chronic active plaque) shows a low power image of the plaque (P) and peri-plaque (PP) with immunolabelled C3aR (A1) and C5aR (B1) cells. Immunopositive C3aR and C5aR labelled cells are seen predominantly at the lesion edge; C3aR demonstrated in A2 (case MS307_20, inactive plaque) and C5aR in B2 (case MS160_S3/1 chronic active plaque). Both C3aR (A3, case MS312_19, chronic active plaque) and C5aR (B3, case MS307_20, inactive plaque) (grey) were shown to co-localise with HLA-DR + microglia (brown, arrow). No co-localisation was shown with GFAP + astrocytes (brown); C3aR demonstrated in A4 (case MS312_19, chronic active plaque) and C5aR in B4 (case MS307_20, inactive plaque) (grey). Scale bars are shown for each slide.
Additional file 4: Figure S3.Complement antibody staining in MS. Plate A demonstrates paraffin wax sections showing anti-C4d immune-positive cells of astrocyte morphology in an active lesion (case MS179_B). Alternative pathway component Bb is shown in plate B on immunola-belled cells within a chronic active plaque (case MS225_S13; arrow indi-cates an immunolabelled cell of astrocyte morphology). C shows immunolabelling with anti-TCC demonstrating immune-positive cells with astrocyte morphology (arrow). D shows C1q immunopositive neurones in the cortex of case MS55_B. E1 and E2 show immunolabelling with
anti-C1 inhibitor demonstrating immune-positive cells with astrocyte (E1, arrow) and microglial-like (E1, dashed arrow) morphology as well as immunolabelling on individual myelin sheaths (E2, arrow) (both case MS160_S1, active plaque). F1 and F2 (F1: case MS64, inactive plaque. F2: case MS128_B, cortex) show anti-clusterin immune-positive cells of astrocyte morphology (F1, arrow) and neurones (F2). Case MS179 is heterozygote for the factor H (fH) Tyr402His polymorphism. Immunolabelling with fh_His402 (fH-H) and fH-Tyr402 (fH-T) demonstrates immune-positive cells within the plaque (G2, fH-Tyr402, arrow) and peri-plaque (G1, fH-His402, arrow and G3, fh-Tyr402) with fragmented myelin shown in the peri-plaque areas. G4 demonstrated neuronal immunolabelling with fH-Tyr402 within the cortex (case MS64_B). Plate H1-H4 show immunolabelling of C1q, clusterin (clust) and C3b within the spinal cord (case MS55_SC). H1 shows vast immunolabelling of C1q within the peri-plaque. H2 and H3 show immunolabelling of cells morphologically resembling astrocytes within the plaque. H4 demonstrated C3b immunolabelling of neurones within the cortex. Scale bar is shown in G4 and is applicable for all plates.
Additional file 5: Figure S4.Positive cellular and myelin immunolabelling in MS and controls. Percentage of sections with positive immunolabelling for each antibody in both cells and myelin is shown with error bars for multiple sclerosis (MS, 42 sections from 17 cases), non-neurological controls (C, 14 sections from 7 cases) and neurological controls (NC, 11 sections, from 9 cases). Significant results are shown by p value examining differences between the MS group and controls or neurological controls; differences between the control groups were not included for reasons of clarity.
Additional file 6: Figure S5.Quantitative immunolabelling of cells from different plaque types. Quantification of immunolabelled cells is shown for each antibody comparing different plaque types; active (130 areas examined from 8 sections with active plaques), chronic active (180 areas examined from 9 sections with chronic active plaques) and chronic inactive (310 areas examined from 18 sections with inactive plaques). Groups show mean values +/_ standard error and significant results are shown by p values examining differences between active and chronic active groups, and chronic active and chronic inactive groups.
Competing interests
BPM is a Consultant for GSK and CLH is employed part-time for GSK Study. Funding from: Multiple Sclerosis Society (UK) [grant number 884/08] Alzheimer’s Society Project Grant [N104].
Authors’contributions
GI was involved in conceptualising and designing the project, interpreting and analysing the data, statistical analysis and manuscript preparation. SL was involved in performing the IHC, interpreting the data and preparing the manuscript. OWH was involved in performing the IFC and critically appraising the manuscript. SH was involved in preparing reagents and preparing the manuscript. BD was involved in performing the IHC and critically appraising the manuscript. CLH was in involved in preparing reagents and critically appraising the manuscript. NPR was involved in conceptualising the study and critically appraising the manuscript. JWN was involved in interpreting and analysing the data and critically appraising the manuscript. BPM was involved in conceptualising the project, interpreting the data and preparing the manuscript. All authors read and approved the final manuscript.
Acknowledgments
We are grateful for tissue provided by the UK MS Tissue Bank, Imperial College London, the Thomas Willis Brain Bank, Oxford University and Brains for Dementia Research, Brain Bank, IOP, King’s College London.
Author details
1Institute of Psychological Medicine and Clinical Neuroscience, Cardiff, UK. 2
Institute of Infection and Immunity, School of Medicine, Cardiff University, Cardiff, UK.3Department of Neurology and Molecular Neuroscience, Institute of Life Sciences, Swansea University, Swansea, UK.
Received: 28 April 2014 Accepted: 2 May 2014 Published: 9 May 2014
Ingramet al. Acta Neuropathologica Communications2014,2:53 Page 14 of 15
References
1. Lassmann H, Bruck W, Lucchinetti CF:The immunopathology of multiple sclerosis: an overview.Brain Pathol2007,17:210–218.
2. Weiner HL:A shift from adaptive to innate immunity: a potential mechanism of disease progression in multiple sclerosis.J Neurol2008, 255(Suppl 1):3–11.
3. Ingram G, Hakobyan S, Robertson NP, Morgan BP:Complement in multiple sclerosis: its role in disease and potential as a biomarker.Clin Exp
Immunol2009,155:128–139.
4. Compston DA, Morgan BP, Oleesky D, Fifield R, Campbell AK:Cerebrospinal fluid C9 in demyelinating disease.Neurology1986,36:1503–1506. 5. Compston DA, Morgan BP, Campbell AK, Wilkins P, Cole G, Thomas ND,
Jasani B:Immunocytochemical localization of the terminal complement complex in multiple sclerosis.Neuropathol Appl Neurobiol1989, 15:307–316.
6. Lumsden CE:The immunogenesis of the multiple sclerosis plaque.Brain Res1971,28:365–390.
7. Gay D, Esiri M:Blood–brain barrier damage in acute multiple sclerosis plaques: An immunocytological study.Brain1991,114(Pt 1B):557–572. 8. Storch MK, Piddlesden S, Haltia M, Iivanainen M, Morgan P, Lassmann H:
Multiple sclerosis: in situ evidence for antibody- and complement-mediated demyelination.Ann Neurol1998,43:465–471.
9. Prineas JW, Kwon EE, Cho ES, Sharer LR, Barnett MH, Oleszak EL, Hoffman B, Morgan BP:Immunopathology of secondary-progressive multiple sclerosis.Ann Neurol2001,50:646–657.
10. Lucchinetti CF, Bruck W, Rodriguez M, Lassmann H:Distinct patterns of multiple sclerosis pathology indicates heterogeneity on pathogenesis.
Brain Pathol1996,6:259–274.
11. Breij EC, Brink BP, Veerhuis R, van den Berg C, Vloet R, Yan R, Dijkstra CD, van der Valk P, Bo L:Homogeneity of active demyelinating lesions in established multiple sclerosis.Ann Neurol2008,63:16–25.
12. Barnett MH, Parratt JD, Cho ES, Prineas JW:Immunoglobulins and complement in postmortem multiple sclerosis tissue.Ann Neurol2009, 65:32–46.
13. Bitsch A, Schuchardt J, Bunkowski S, Kuhlmann T, Bruck W:Acute axonal injury in multiple sclerosis: correlation with demyelination and inflammation.Brain2000,123(Pt 6):1174–1183.
14. Lassmann H:Review: the architecture of inflammatory demyelinating lesions: implications for studies on pathogenesis.Neuropathol Appl
Neurobiol2011,37:698–710.
15. Howell OW, Palser A, Polito A, Melrose S, Zonta B, Scheiermann C, Vora AJ, Brophy PJ, Reynolds R:Disruption of neurofascin localization reveals early changes preceding demyelination and remyelination in multiple sclerosis.Brain2006,129:3173–3185.
16. Soverchia L, Ubaldi M, Leonardi-Essmann F, Ciccocioppo R, Hardiman G: Microarrays–the challenge of preparing brain tissue samples.Addict Biol 2005,10:5–13.
17. Mead RJ, Singhrao SK, Neal JW, Lassmann H, Morgan BP:The membrane attack complex of complement causes severe demyelination associated with acute axonal injury.J Immunol2002,168:458–465.
18. Ingram G, Hakobyan S, Hirst CL, Harris CL, Pickersgill TP, Cossburn MD, Loveless S, Robertson NP, Morgan BP:Complement regulator factor H as a serum biomarker of multiple sclerosis disease state.Brain2010, 133:1602–1611.
19. Trapp BD, Nave KA:Multiple sclerosis: an immune or neurodegenerative disorder?Annu Rev Neurosci2008,31:247–269.
20. Ingram G, Hakobyan S, Hirst CL, Harris CL, Loveless S, Mitchell JP, Pickersgill TP, Robertson NP, Morgan BP:Systemic complement profiling in multiple sclerosis as a biomarker of disease state.Mult Scler2012,18:1401–1411. 21. Gasque P, Dean YD, McGreal EP, VanBeek J, Morgan BP:Complement
components of the innate immune system in health and disease in the
CNS.Immunopharmacology2000,49:171–186.
22. Woyciechowska JL, Brzosko WJ:Immunofluorescence study of brain plaques from two patients with multiple sclerosis.Neurology1977, 27:620–622.
23. Andersson M, Alvarez-Cermeno J, Bernardi G, Cogato I, Fredman P, Frederiksen J, Fredrikson S, Gallo P, Grimaldi LM, Gronning M, Keir G, Lamers K, Link H, Magalhaes A, Massaro AR, Ohman S, Reiber H, Ronnback L, Schluep M, Schuller E, Sindic CJM, Thompson EJ, Trojano M, Wurster U:Cerebrospinal fluid in the diagnosis of multiple sclerosis: a consensus report.J Neurol Neurosurg
Psychiatry1994,57:897–902.
24. Qin Y, Duquette P, Zhang Y, Talbot P, Poole R, Antel J:Clonal expansion and somatic hypermutation of V(H) genes of B cells from cerebrospinal fluid in multiple sclerosis.J Clin Invest1998,102:1045–1050.
25. Vanguri P, Koski CL, Silverman B, Shin ML:Complement activation by isolated myelin: activation of the classical pathway in the absence of myelin-specific antibodies.Proc Natl Acad Sci U S A1982,79:3290–3294. 26. Clark SJ, Perveen R, Hakobyan S, Morgan BP, Sim RB, Bishop PN, Day AJ:
Impaired binding of the age-related macular degeneration-associated complement factor H 402H allotype to Bruch's membrane in human retina.J Biol Chem2010,285:30192–30202.
27. Lucchinetti C, Bruck W, Parisi J, Scheithauer B, Rodriguez M, Lassmann H: Heterogeneity of multiple sclerosis lesions: implications for the pathogenesis of demyelination.Ann Neurol2000,47:707–717. 28. Kira J:Autoimmunity in neuromyelitis optica and opticospinal multiple
sclerosis: astrocytopathy as a common denominator in demyelinating disorders.J Neurol Sci2011,311:69–77.
29. Ramaglia V, Hughes TR, Donev RM, Ruseva MM, Wu X, Huitinga I, Baas F, Neal JW, Morgan BP:C3-dependent mechanism of microglial priming relevant to multiple sclerosis.Proc Natl Acad Sci U S A2012,109:965–970. 30. Moore CS, Abdullah SL, Brown A, Arulpragasam A, Crocker SJ:How factors
secreted from astrocytes impact myelin repair.J Neurosci Res2011, 89:13–21.
31. Nair A, Frederick TJ, Miller SD:Astrocytes in multiple sclerosis: a product of their environment.Cell Mol Life Sci2008,65:2702–2720.
32. Gasque P, Singhrao SK, Neal JW, Gotze O, Morgan BP:Expression of the receptor for complement C5a (CD88) is up-regulated on reactive astrocytes, microglia, and endothelial cells in the inflamed human central nervous system.Am J Pathol1997,150:31–41.
33. Gasque P, Singhrao SK, Neal JW, Wang P, Sayah S, Fontaine M, Morgan BP: The receptor for complement anaphylatoxin C3a is expressed by myeloid cells and nonmyeloid cells in inflamed human central nervous system: analysis in multiple sclerosis and bacterial meningitis.J Immunol 1998,160:3543–3554.
34. Badar A, DeFreitas S, McDonnell JM, Yahya N, Thakor D, Razavi R, Smith R, Sacks S, Mullen GE:Recombinant complement receptor 2 radiolabeled with [99mTc(CO)3]+: a potential new radiopharmaceutical for imaging activated complement.PLoS One2011,6:e18275.
35. Thurman JM, Kulik L, Orth H, Wong M, Renner B, Sargsyan SA, Mitchell LM, Hourcade DE, Hannan JP, Kovacs JM, Coughlin B, Woodell AS, Pickering MC, Rohrer B, Holers VM:Detection of complement activation using monoclonal antibodies against C3d.J Clin Invest2013,123:2218–2230.
doi:10.1186/2051-5960-2-53
Cite this article as:Ingramet al.:Complement activation in multiple sclerosis plaques: an immunohistochemical analysis.Acta Neuropathologica Communications20142:53.
Submit your next manuscript to BioMed Central and take full advantage of:
• Convenient online submission
• Thorough peer review
• No space constraints or color figure charges
• Immediate publication on acceptance
• Inclusion in PubMed, CAS, Scopus and Google Scholar
• Research which is freely available for redistribution