* Corresponding author. Tel: +91-033-2414-6153 E-mail: [email protected] (S. Chakraborty) © 2013 Growing Science Ltd. All rights reserved. doi: 10.5267/j.ijiec.2013.01.002
International Journal of Industrial Engineering Computations 4 (2013)259–272
Contents lists available at GrowingScience
International Journal of Industrial Engineering Computations
homepage: www.GrowingScience.com/ijiec
Using MACBETH method for supplier selection in manufacturing environment
Prasad Karandea andShankar Chakrabortyb*
aMechanical Engineering Department, Government Polytechnic, Mumbai - 400 051, Maharashtra, India bDepartment of Production Engineering, Jadavpur University, Kolkata - 700 032, West Bengal, India
C H R O N I C L E A B S T R A C T
Article history: Received October202012 Received in revised format December 28 2012
Accepted January2 2012 Available online 3January 2013
Supplier selection is always found to be a complex decision-making problem in manufacturing environment. The presence of several independent and conflicting evaluation criteria, either qualitative or quantitative, makes the supplier selection problem a candidate to be solved by multi-criteria decision-making (MCDM) methods. Even several MCDM methods have already been proposed for solving the supplier selection problems, the need for an efficient method that can deal with qualitative judgments related to supplier selection still persists. In this paper, the applicability and usefulness of measuring attractiveness by a categorical-based evaluation technique (MACBETH) is demonstrated to act as a decision support tool while solving two real time supplier selection problems having qualitative performance measures. The ability of MACBETH method to quantify the qualitative performance measures helps to provide a numerical judgment scale for ranking the alternative suppliers and selecting the best one. The results obtained from MACBETH method exactly corroborate with those derived by the past researchers employing different mathematical approaches.
© 2013 Growing Science Ltd. All rights reserved Keywords:
Supplier selection
Multi-criteria decision analysis MACBETH method
Semantic scale Rank
1. Introduction
suitable supplier from a pool of available choices has now become extremely important and should be dealt with utmost care. The supplier selection process starts with identification of probable suppliers for the required goods or services, and ends with executing supply contracts with the suppliers identified through an evaluation process.
Historically, the evaluation of suppliers was mostly done through a single criterion approach, i.e. based on the lowest invoice cost. Ongoing research in the supplier selection domain has proved that this approach not only ignores other sources of indirect supplier costs associated with late delivery, poor quality etc., but also does not take into account the effects of other important criteria, like service, flexibility, reliability etc. Therefore, the supplier selection problems are now being treated and solved using multiple criteria approaches. Additionally, it is observed that during the past few years, the supplier selection problem has become multi-dimensional and multi-functional, having increased complexity with respect to effective decision-making. Therefore, choosing the right method for supplier selection has become very important to reduce the associated purchase risk (Athawale&Chakraborty, 2011;Chatterjee&Chatterjee, 2012; Dey et al., 2012; Kabir&Hasin, 2012).
Contemporary operations research (OR) offers a range of methods and techniques that can help the purchasing decision makers in dealing with the increased complexity and importance of the related decisions (De Boer et al., 2001). In supply chain management, the performance of potential suppliers is now evaluated with respect to multiple criteria rather than considering a single factor-cost (Ho et al., 2010). Therefore, supplier selection can be treated as a multi-criteria decision-making (MCDM) problem, where evaluation of the suppliers is usually based on several criteria, like process technology, quality, delivery, flexibility, price, service etc. The available MCDM methods help the decision makers to evaluate the performance of alternative suppliers while analyzing the trade-off between several conflicting criteria. Numerous MCDM methods have been successfully applied for evaluating and selecting the most appropriate suppliers for varying manufacturing environments. It is observed that most of those methods are capable to provide results based on cardinal (quantitative) information. In the supplier selection domain, performance of alternative suppliers with respect to some criteria (e.g. quality, reliability, flexibility, service etc.) is generally expressed in terms of ordinal (qualitative) data. Therefore, the requirement of a suitable mathematical approach capable of dealing with the ordinal data is always welcome in this direction.
In this paper, Measuring Attractiveness by a Categorical Based Evaluation TecHnique (MACBETH) is used to solve two real time supplier selection problems, having performance of the alternative suppliers expressed in the form of ordinal (qualitative) data. This MCDM method has the advantage of taking into account the customers’ preferences from qualitative point of view. Because of pair-wise comparison of performance between two alternatives using reference scales, it can provide accurate ranking of the considered alternative suppliers and guide the decision makers to choose the best one.
2. Literature review
alternative suppliers and provide a ranking based on the closeness coefficient values as calculated using technique for order performance by similarity to ideal solution (TOPSIS) method. Amid et al. (2006) developed a fuzzy multi-objective linear model for supplier selection and order allocation while considering different criteria weights. Huang and Keskar (2007) presented an integrated model in which the ranking of the suppliers was based on a set of metrics arranged hierarchically while taking into account product type, supplier type and supplier integration level.
Sanayei et al. (2008) proposed a model for supplier selection and order allocation based on multi-attribute utility theory (MAUT) and linear programming (LP) methods. The selection of the appropriate supplier was done based on the utility values as calculated using MAUT method, while the results of LP would decide the quantities of materials to be purchased from the selected suppliers. Boran et al. (2009) applied intuitionsitic fuzzy TOPSIS method to evaluate and select the most suitable supplier for a given task. Opinions of the decision makers were aggregated using intuitionistic fuzzy averaging operator to find the relative closeness coefficients for supplier selection. Guneri et al. (2009) integrated fuzzy set theory and LP models for supplier selection and order allocation. The ranking of the suppliers was based on the closeness coefficients calculated using fuzzy supplier performance inputs and the order quantities were assigned to the selected suppliers based on the outputs of LP model. Önüt et al. (2009) combined analytic network process (ANP) and TOPSIS methods for supplier evaluation and selection. In that approach, the criteria weights were obtained with fuzzy ANP (FANP) method, while the most appropriate supplier was selected using fuzzy TOPSIS (FTOPSIS) approach.
Sreekumar and Mahapatra (2009) proposed a fuzzy hierarchical approach where the criteria weights were computed using eigen vector method. Selection of the supplier was made based on the closeness coefficient values derived from the fuzzy positive-ideal and negative-ideal solutions. Wang et al. (2009) proposed a fuzzy hierarchical TOPSIS method for evaluation and selection of suppliers. Wu (2009) presented a hybrid model integrating data envelopment analysis (DEA), decision tree and neural network for supplier evaluation and selection. Wu et al. (2009) proposed a model combining ANP and mixed integer programming (MIP) for selection of suitable suppliers. In that model, ANP method would select the most appropriate supplier, while based on the results of MIP model, order quantities would be allocated to the selected suppliers. Ho et al. (2010) observed an increased attention among the researchers for using MCDM methods in the context of supplier selection. It was concluded that DEA was the most prevalent individual approach, whereas, analytic hierarchy process-goal programming (AHP-GP) was the most popular integrated approach for decision-making in the supplier selection domain.
Liao and Kao (2010) presented a comprehensive method integrating Taguchi loss function, AHP and multi-choice goal programming (MCGP) for supplier selection. The Taguchi loss function was applied to evaluate the loss for each supplier selection criterion, whereas, criteria weights were calculated using AHP method. Then, an appropriate MCGM model was formulated and solved to identify the most suitable supplier. Chen and Yang (2011) developed a two-stage supplier selection model where in the first stage, the attractiveness of the alternative suppliers was mapped using fuzzy-AHP (FAHP) method and in the second stage, the ranking of the alternative suppliers was done by FTOPSIS method. Deng and Chan (2011) proposed an MCDM approach for supplier selection based on fuzzy set theory and Dempster Shafer theory of evidence. Kilincci and Onal (2011) applied a fuzzy AHP-based method for supplier selection in a Turkish washing machine manufacturing organization. Shemshadi et al. (2011) applied an extended version of VIKOR (VlseKriterijumskaOptimizacijaKompromisnoResenje) method for supplier selection.
applied it in the context of supply chain system of the Italian railway industry. Büyüközkan and Çifçi (2012) proposed a comprehensive hybrid approach based on fuzzy decision-making trial and evaluation laboratory (DEMATEL), fuzzy ANP and fuzzy TOPSIS methodologies for green supplier evaluation, where the selection of the suppliers was based on interdependency of the considered criteria. Ferreira and Borenstein (2012) solved the problem of evaluating and selecting the best supplier with vague and uncertain information. The proposed model would rank the suppliers based on an integrated concept of influence diagram and fuzzy logic.
Shaw et al. (2012) developed a concept of integrating FAHP and fuzzy multi-objective linear programming for supplier selection in a given supply chain. In that approach, FAHP method was used to find the relevant criteria weights, while fuzzy multi-objective linear programming method was adopted for order allocation to the selected suppliers. Xiao et al. (2012) presented a novel approach for supplier selection, where the criteria weights were calculated using fuzzy cognitive map and the most suitable supplier was selected using fuzzy soft set theory. Although different MCDM methods and other mathematical techniques have already been proposed and successfully applied for solving the supplier selection problems, a need is still felt to augment a simple and suitable MCDM approach for dealing with the supplier selection problems having ordinal (qualitative) evaluation data. MACBETH is such an approach that can efficiently solve complex strategic decision-making problems with both the quantitative and qualitative data.
3. MACBETH method
MACBETH method is developed in the context of multi-criteria decision analysis (MCDA) approach, which can be defined as a set of techniques that are designed to investigate a number of alternatives having multiple criteria and conflicting objectives (Bana e Costa & Oliveira, 2012). It is based on multi-attribute value theory. Basically, this interactive technique is used to judge the performance of alternatives with respect to a range of decision criteria expressed in ordinal (qualitative) measures. In this technique, the decision maker needs to compare two stimuli at a time with qualitative judgments about their difference of attractiveness based on a pre-defined semantic judgment scale. This method not only provides facility to check consistency of the decision maker’s judgments, but also suggests improvements in the judgments, if they are found to be inconsistent. Further, based on linear programming models, these consistent judgments are transformed into a suitable numerical scale, identified as the MACBETH scale. Finally, the weighted global scores representing the overall attractiveness of the considered alternatives are computed using an additive aggregation model to rank the alternatives.This methodis supported by M-MACBETH software developed using algorithm based on linear programming models.
MACBETH scale, the upper reference level is assigned a score of 100, while the lower reference level has a score of 0. Here, it is to be noted that 100 does not necessarily represent the best possible score and 0 does not necessarily denote the worst performance of an alternative for a given criterion.
The next step in MACBETH method is to convert the ordinal performance scales into proportional cardinal scales. Usually, the performances of alternatives with respect to various criteria are expressed using two scales, i.e. cardinal and ordinal scale. The cardinal scales are represented in numbers and can be manipulated with the help of basic mathematical operators, like addition, subtraction etc. On the other hand, ordinal scales represent comparative positions (e.g. first, more, higher etc.), therefore, direct mathematical treatments of these scales are found to be difficult. As in case of MCDM methods, performance of the alternatives with respect to all the decision criteria needs to be compared, mathematical treatments of the data are therefore essential. Thus, the need for a decision-making tool, capable of converting the decision maker’s ordinal opinions into proportionate cardinal scale of values arises which can be effectively taken into consideration by MACBETH method.
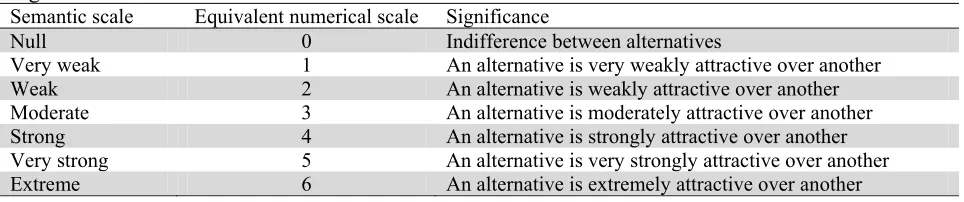
To convert the ordinal performance scales into proportional cardinal scales for a criterion, the performance levels are arranged in a (n×n) matrix, where n is number of performance levels selected for that criterion. The performance levels are arranged in descending order of their importance from left to right and top to bottom. Further, the decision maker is asked to map the difference of attractiveness between ordinal performance measures of two alternatives at a time, because the comparison of alternatives is done based on difference of attractiveness instead of attractiveness itself. MACBETH method provides facility to map the difference of attractiveness using seven semantic scales as ‘null’, ‘very weak’, ‘weak’, ‘moderate’, ‘strong’, ‘very strong’ and ‘extreme’ (Bana e Costa &Chagas, 2004). The significance of these seven semantic scales is represented in Table 1.
Table 1
Significance of MACBETH semantic scales
Semantic scale Equivalent numerical scale Significance
Null 0 Indifference between alternatives
Very weak 1 An alternative is very weakly attractive over another
Weak 2 An alternative is weakly attractive over another
Moderate 3 An alternative is moderately attractive over another
Strong 4 An alternative is strongly attractive over another
Very strong 5 An alternative is very strongly attractive over another
Extreme 6 An alternative is extremely attractive over another
The decision maker also has the freedom to choose more than one consecutive categories, if the comparison using the provided seven semantic scales is observed to be unreasonable. The judgments provided by the decision maker are checked for consistency. If the provided judgments are found to be inconsistent, M-MACBETH software suggests possible alterations to make the judgments consistent (Bana e Costa and Oliveira, 2012). Subsequently, the consistent judgments are transformed into proportional cardinal scales. The actual mathematical procedure for conversion of ordinal scales into cardinal MACBETH scores takes place as follows:
Consider a criteria k for which the cardinal MACBETH score is generated having Li (i = 1,2,…,n)
performance levels. The performance levels for that criterion are arranged in a matrix form according to descending order of their importance from left to right and top to bottom, as shown in Table 2. To understand the procedure, an example with four performance levels, i.e. L1, L2, L3, and L4isconsidered
here such that L3 is the ‘good’ level, while L4is the ‘neutral’ level. Let the preference of importance for
the performance levels is L3 > L1 > L2 > L4. Therefore, if v(L1),v(L2), (L3) and v(L4) are the quantified
MACBETH scores for levels L1, L2, L3 and L4respectively, then v(L3) = 100, v(L4) = 0 and v(L3) >
For n reference levels, maximum n(n - 1)/2 number of comparisons are possible, but (n - 1) number of comparisons, as presented parallel to the diagonal in Table 2, are sufficient for conversion of the scale. Comparison of strengths of performance is done using one of the seven semantic scales, as givenn in Table 1. If the decision maker does not provide any strength of performance, it is noted by positive or P in the corresponding cell of the matrix. If the decision maker prefers performance of L1 over L2with a
strength h∈{0,1,…,6}, i.e. 2 h 1 L
L ;
Then,
v(L1) - v(L2) = hα, (1)
where α is a coefficient necessary to meet the condition that v(L1) and v(L2)∈[0,100]. The quantified
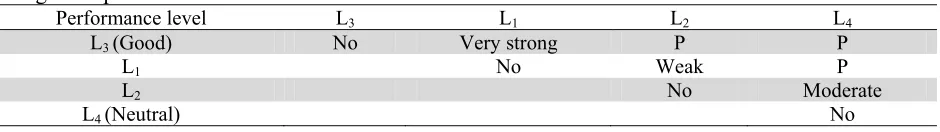
MACBETH scores are obtained by solving the related equations for all the performance levels. Let the decision maker decides the strengths of performance, as expressed in Table 2, and when all the strengths of performance levels are provided, the matrix of judgments is ready for quantification of the data.
Table 2
Strengths of performance levels for kth criterion
Performance level L3 L1 L2 L4
L3 (Good) No Very strong P P
L1 No Weak P
L2 No Moderate
L4 (Neutral) No
From the judgments provided in Table 2, the following system of equations can be extracted:
v(L3) - v(L1) = 5α, (2)
v(L1) - v(L2) = 2α, (3)
v(L2) - v(L4) = 3α, (4)
On solving Eqns. (2)-(4), the obtained solutions are α = 10, v(L1) = 50 and v(L2) = 30. The
quantification of performance levels for all the remaining criteria as well as the corresponding criteria weights can be obtained adopting the same procedure. The next step of MACBETH method is to select the alternatives and their performance with respect to different criteria, and enter the relevant data into M-MACBETH software. Finally, the global attractive scores are obtained to rank the considered alternatives. The additive value model of the following type is used to determine the overall global score of an alternative.
n
i j j
j 1
V(X ) w (v )
=
=
∑
(5)with
n j j 1
w 1
=
=
∑
, wj;0and j j0j j
v (x ) 100 v (x ) 0
+
⎧ =
⎪
⎨ =
⎪⎩
(6)
wherewj is the weight for jth criterion.
The final ranking of the alternatives is done based on V(Xi) values.
4. Illustrative examples
4.1 Example 1
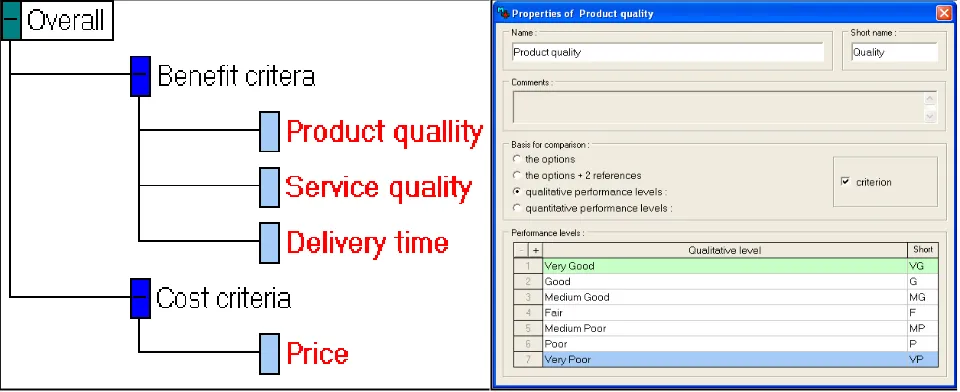
Li et al. (2007) considered a supplier selection problem having six suppliers evaluated based on four criteria, i.e. product quality, service quality, delivery time and price. The performances of all the six alternative suppliers are expressed in the form of ordinal (qualitative) data. Product quality, service quality and delivery time are beneficial attributes where higher values are preferred, whereas, price is a non-beneficial attribute requiring lower value for that criterion. The four evaluation criteria are at first entered into M-MACBETH software to develop the corresponding value tree, as shown by in Figure 1. In this value tree, the ‘Benefit criteria’ node contains all the three beneficial criteria, while the ‘Cost criteria’ node contains the only non-beneficial criterion.
Fig. 1. MACBETH value tree for supplier selection problem 1 Fig. 2. Performance levels for ‘product quality’ criterion
Li et al. (2007) proposed a degree of seven ordinal performance levels to map the performance of the alternatives with respect to four selection criteria. For beneficial criteria, the proposed performance levels are arranged in descending order of their attractiveness as ‘very good’ (VG), ‘good’ (G), ‘medium good’ (MG), ‘fair’ (F), ‘medium poor’ (MP), ‘poor’ (P) and ‘very poor’ (VP). In case of non-beneficial criteria, the preference order is just reversed. For entering the performance levels into M-MACBETH software, the basis of comparison is selected as ‘qualitative performance levels’ because the performance of the alternatives with respect to all the considered criteria is measured based on an ordinal scale. For all the criteria, the above seven performance levels are entered into M-MACBETH software according to descending order of their attractiveness. For beneficial criteria, the most attractive performance level, i.e. VG is selected as upper reference level and the least attractive performance level, i.e. VP is chosen as lower reference level; while for non-beneficial criteria, VP is selected as upper reference level and VG as lower reference level. Fig. 2 shows the selected performance levels for ‘product quality’ criterion for this example.
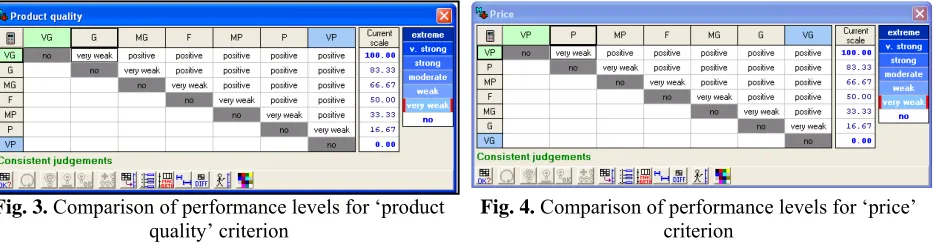
v(VG) - v(G) = α, v(G) - v(MG) = α, v(MG) - v(F) = α, v(F) - v(MP) = α, v(MP) - v(P) = α and v(P) - v(VP) = α.
Here, the performance level VG is selected as upper reference level and therefore, v(VG) = 100. On the other hand, the performance level VP is chosen as lower reference level and hence, v(VP) = 0. On solving this system of equations leads to results of α = 16.67, v(P) = 16.67, v(MP) = 33.33, v(F) = 50, v(MG) = 66.67 and v(G) = 83.33. The quantification of ordinal performance levels for all the remaining criteria is done using the same methodology.
Fig. 3. Comparison of performance levels for ‘product
quality’ criterion Fig. 4.
Comparison of performance levels for ‘price’ criterion
Li et al. (2007) considered six eligible suppliers, i.e. S1,S2,…,S6amongst which the best one needs to be
selected for a given task. A team of four decision makers was formed to evaluate the performance of the alternative suppliers and also to determine the relative criteria weights. It is observed that the mapping of ordinal performance of the suppliers with respect to different criteria is subjective. Therefore, a result based on a consensus reached by a group of decision makers is more credible than the one based on the views of an individual. In this example, the average of mapping scores suggested by the four decision makers is considered as the performance of an alternative supplier with respect to a particular criterion, as shown in Table 3.
Table 3
Performance of alternative suppliers for example 1
Alternative Product quality (Quality)
Service quality (Service)
Delivery time (Time)
Price
S1 G G G G
S2 MG G G G
S3 MG F MG VG
S4 MG MP G G
S5 MG MP MG MG
S6 MG MP F VG
Fig. 5. MACBETH table of performances for supplier selection problem 1
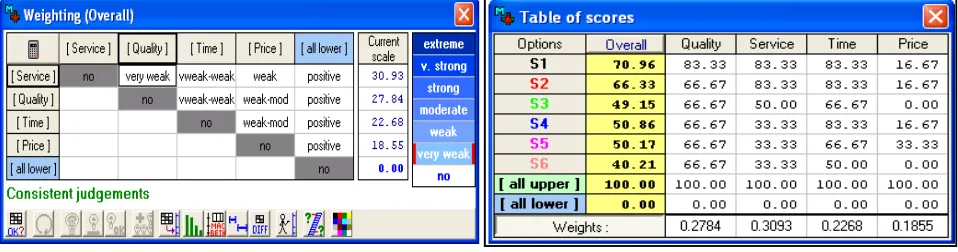
Fig. 6. MACBETH weighing judgments for supplier
selection problem 1
Fig. 7. MACBETH table of scores for supplier
selection problem 1
M-MACBETH software provides the overall attractiveness scores for all the alternative suppliers, as calculated using Eq. (5). Those quantified cardinal scores of performance of the considered suppliers with respect to four criteria and the corresponding overall scores are given in Fig. 7.
Table 4
Overall scores and ranking for supplier selection problem 1
Alternative Product quality Service quality Delivery time Price Overall score Rank
S1 83.33 83.33 83.33 16.67 70.96 1
S2 66.67 83.33 83.33 16.67 66.33 2
S3 66.67 50.00 66.67 00.00 49.15 5
S4 66.67 33.33 83.33 16.67 50.86 3
S5 66.67 33.33 66.67 33.33 50.17 4
S6 66.67 33.33 50.00 00.00 40.21 6
Table 5
Comparison of results for supplier selection problem 1
Alternative Li et al. (2007) MACBETH
S1 1 1
S2 2 2
S3 5 5
S4 3 3
S5 4 4
S6 6 6
The ranking of the alternative suppliers is now done based on the overall scores, as shown in Table 4. Li et al. (2007) adopted a grey-based decision-making approach for solving this supplier selection problem and obtained a ranking of the alternative suppliers as S1-S2-S4-S5-S3-S6, as shown in Table 5.
On the other hand, for this same problem, MACBETH method provides a ranking of the alternative suppliers as S1-S2-S4-S5-S3-S6. It is observed that the rankings obtained using both these methods
perfectly match.
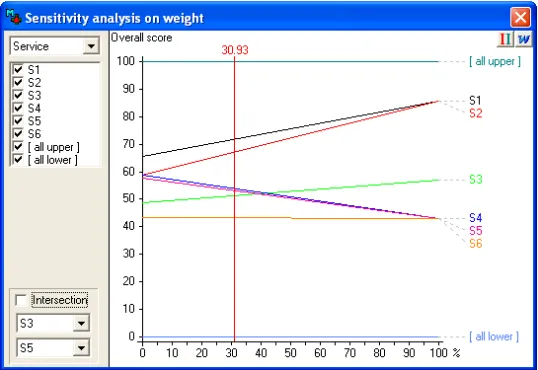
Sensitivity analysis shows the stability of the derived results and in this analysis, the criteria weights or model parameters are changed in a constrained way to check the effects of such changes on the obtained results. Here, the weight of one criterion is consistently varied, adjusting the difference equally over the remaining criteria weights. M-MACBETH software provides the facility to perform sensitivity analysis with respect to all the selection criteria. In this example, as ‘service quality’ has the maximum weight, the effect of variation in weight of ‘service quality’ criterion on rankings of the alternative suppliers are exhibited in Figure 8. It is observed that S1 and S2 remain as the first and
second choices, while S6 is the last choice for any variation in the weight of ‘service quality’ criterion.
rankings of the first, second and last alternative suppliers remain unaffected due to change in its weight. In case of ‘price’ criterion, S1 remains as the first choice up to a weight of 0.638, thereafter, S5 becomes
the first choice pushing S1 to be the second choice. The last choice of supplier (S6) remains unaffected
due to this criterion weight change. It is thus observed that the results obtained using MACBETH method are quite consistent and acceptable, almost unaffected due to change in the values of the considered criteria weights.
Fig. 8. Sensitivity analysis for example 1 with respect to ‘service quality’ criterion
4.2 Example 2
Fig. 9. MACBETH value tree for supplier selection problem
2 Fig. 10.
Performance levels for ‘transportation cost’ criterion
Further, the differences of attractiveness between various performance levels are identified and consistency of the judgments is checked. The identified differences of attractiveness for performance levels using seven semantic scales are respectively shown in Figures 11 and 12 for ‘delivery’ and ‘transportation cost’ criteria.
Fig. 11. Comparison of performance levels for
‘delivery’ criterion
Fig. 12. Comparison of performance levels for
‘transportation cost’ criterion
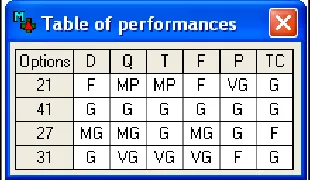
Further, the performances of alternatives with respect to the six evaluation criteria are entered into M-MACBETH software so that they can be converted into proportional cardinal scores. Figure 13 shows the performance of four alternative suppliers with respect to six considered criteria. Golmohammadi and Mellat-Parast(2012) used the criteria weights as calculated by averaging the two decision makers’ opinions. As those same weights are used in this example, the six considered criteria are arranged in descending order of their importance as ‘delivery’-‘quality’-‘price’-‘technology’-‘flexibility’-‘transportation cost’ from left to right and top to bottom. The comparison of attractiveness of one criterion over the other and the subsequent weighing judgments are shown in Figure 14. It is to be noted here that ‘delivery’, ‘quality’ and ‘price’ have the same weights, whereas, ‘technology’, ‘flexibility’ and ‘transportation cost’ also have the same importance.
Fig. 14. MACBETH weighing judgments for supplier selection problem 2
Fig. 15. MACBETH table of scores for supplier selection problem 2
M-MACBETH software provides the weighted overall scores for all the four alternative suppliers, as calculated using Eqn. (5). The MACBETH table of scores, as given in Figure 15, provides the quantified cardinal scores of performance of the alternatives with respect to all the criteria, the corresponding criteria weights and overall scores for the alternative suppliers.
Table 6
Comparison of results for supplier selection problem 2
Alternative Golmohammadi and Mellat-Parast (2012) MACBETH
21 4 4
41 2 2
27 3 3
31 1 1
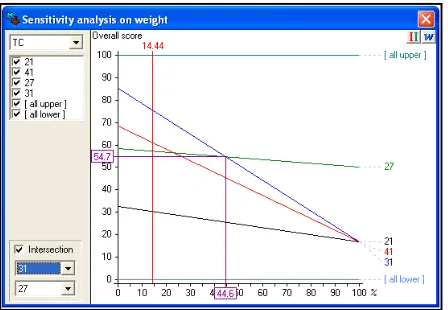
Table 6 shows a comparison of MACBETH rankings with those obtained by the past researchers. It is observed that alternative 31 emerges out as the best supplier, while alternative 21 is the worst choice for supplying the required plastic components to that manufacturing organization. The ranking of the alternative suppliers obtained using MACBETH method is 31-41-27-21 which exactly matches with the results derived by Golmohammadi and Mellat-Parast (2012). While performing the sensitivity analysis for this example, it is observed that changes in weights of ‘delivery’, ‘quality’, ‘technology’, ‘production system flexibility’ and ‘price’ criteria have no effect on the rankings of the alternative suppliers. For ‘transportation cost’ criterion, supplier 31 remains as the first choice up to a weight of 0.446, and then supplier 27 becomes the first choice, replacing supplier 31. It is also observed that up to a weight of 0.234 for this criterion, supplier 41 remains as the second choice, while between 0.234 and 0.446 criterion weight, supplier 27 becomes the second choice. Fig. 16 shows the results of sensitivity analysis for this supplier selection problem with respect to ‘transportation cost’ criterion.
Fig. 16. Sensitivity analysis for supplier selection problem 2 for ‘transportation cost’ criterion
5. Conclusions
results are compared with those derived by the past researchers. It is noted that the pair-wise comparison of performance between the alternatives and two selected reference levels help to produce accurate results in MACBETH method. The support of M-MACBETH software also improves the usefulness of this method in solving complex decision-making problems having performance of the alternatives expressed in ordinal scale. Sensitivity analysis is also performed to visualize the effects of changing criteria weights on the final rankings of the alternative suppliers. The outcome of sensitivity analysis proves that MACBETH method is an almost robust technique for decision analysis. Further, application of this almost unexplored MCDA technique in a wider range of decision-making problems using real time data from diverse manufacturing environments remains as a future scope of research.
References
Amid, A., Ghodsypour, S.H., & O’Brien, C. (2006).Fuzzy multiobjective linear model for supplier selection in a supply chain.International Journal of Production Economics, 104(2), 394-407.
Athawale, V. M., &Chakraborty, S. (2011). A comparative study on the ranking performance of some
multi-criteria decision-making methods for industrial robot selection.International Journal of
Industrial Engineering Computations, 2(4), 831-850.
Bana e Costa, C.A., Corrêa, E.C., De Corte, J-M., &Vansnick, J-C. (2002). Facilitating bid evaluation in public call for tenders: A socio-technical approach. Omega, 30(3), 227-242.
Bana e Costa, C.A., &Chagas, M.P. (2004).A career choice problem: An example of how to use
MACBETH to build a quantitative value model based on qualitative value judgments. European
Journal of Operational Research, 153(2), 323-331.
Bana e Costa, C.A.,& Oliveira, M.D. (2012). A multicriteria decision analysis model for faculty evaluation.Omega, 40(4), 424-436.
Boran, F.E., Genç, S., Kurt, M., &Akay, D. (2009). A multi-criteria intuitionistic fuzzy group decision
making for supplier selection with TOPSIS method. Expert Systems with Applications, 36(8),
11363-11368.
Bruno, G., Esposito, E., Genovese, A., &Passaro, R. (2012). AHP-based approaches for supplier evaluation: Problems and perspectives. Journal of Purchasing & Supply Management,18(3), 159– 172.
Büyüközkan, G., &Çifçi, G. (2012). A novel hybrid MCDM approach based on fuzzy DEMATEL, fuzzy ANP and fuzzy TOPSIS to evaluate green suppliers. Expert Systems with Applications, 39(3), 3000-3011.
Chatterjee, P., &Chatterjee, R. (2012).Supplier evaluation in manufacturing environment using
compromise ranking method with grey interval numbers.International Journal of Industrial
Engineering Computations, 3(3), 393-402.
Chen, C-T., Lin, C-T., & Huang, S-F.(2006). A fuzzy approach for supplier evaluation and selection in supply chain management.International Journal of Production Economics, 102(2), 289-301.
Chen, Z., & Yang, W. (2011). An MAGDM based on constrained FAHP and FTOPSIS and its application to supplier selection. Mathematical and Computer Modelling, 54(11-12), 2802-2815. Dey, B., Bairagi, B., Sarkar, B., &Sanyal, S. (2012). A MOORA based fuzzy multi-criteria decision
making approach for supply chain strategy selection. International Journal of Industrial
Engineering Computations, 3(4), 649-662.
De Boer, L., Labro, E., &Morlacchi, P. (2001).A review of methods supporting supplier selection.European Journal of Purchasing & Supply Management, 7(2), 75-89.
Deng, Y., & Chan, F.T.S. (2011).A new fuzzy dempster MCDM method and its application in supplier selection.Expert Systems with Applications, 38(8), 9854-9861.
Degraeve, Z., &Roofhooft, F. (2001).A smarter way to buy.Harvard Business Review, 79, 22-23.
Fakhfakh, N., Verjus, H., Pourraz, F., &Moreaux, P. (2011). Measuring the satisfaction degree of quality attributes requirements for services orchestrations. Proc. of 4th International Conference on
Ferreira, L., &Borenstein, D. (2012).A fuzzy-Bayesian model for supplier selection.Expert Systems
with Applications, 39(9), 7834-7844.
Golmohammadi, D., &Mellat-Parast, M. (2012).Developing a grey-based decision- making model for supplier selection.International Journal of Production Economics, 137(2), 191-200.
Guneri, A.F., Yucel, A., &Ayyildiz, G. (2009).An integrated fuzzy-lp approach for a supplier selection problem in supply chain management.Expert Systems with Applications, 36(5), 9223-9228.
Ho, W., Xu, X., &Dey, P.K. (2010). Multi-criteria decision making approaches for supplier evaluation and selection: A literature review. European Journal of Operational Research, 202(1), 16-24.
Huang, S.H., &Keskar, H. (2007).Comprehensive and configurable metrics for supplier
selection.International Journal of Production Economics, 105(2), 510-523.
Kabir, G., &Hasin, M. A. A. (2012).Framework for benchmarking online retailing performance using
fuzzy AHP and TOPSIS method.International Journal of Industrial Engineering Computations,
3(4), 561-576.
Kilincci, O., &Onal, S.A. (2011). Fuzzy AHP approach for supplier selection in a washing machine company.Expert Systems with Applications, 38(8), 9656-9664.
Li, G-D., Yamaguchi, D., & Nagai, M. (2007).A grey-based decision-making approach to the supplier selection problem.Mathematical and Computer Modelling, 46(3-4), 573-581.
Liao, C-N., & Kao, H-P.(2010). Supplier selection model using Taguchi loss function, analytical hierarchy process and multi-choice goal programming.Computers & Industrial Engineering, 58(4), 571-577.
Oliveira, R.C., &Lourenço, J.C. (2002).A multicriteria model for assigning new orders to service suppliers.European Journal of Operational Research, 139(2), 390-399.
Önüt, S., Kara, S.S., &Işik, E. (2009).Long term supplier selection using a combined fuzzy MCDM approach: A case study for a telecommunication company. Expert Systems with Applications, 36(2), 3887-3895.
Sanayei, A., Mousavi, S.F., Abdi, M.R., &Mohaghar, A. (2008).An integrated group decision-making process for supplier selection and order allocation using multi-attribute utility theory and linear programming.Journal of the Franklin Institute, 345(7), 731-747.
Shaw, K., Shankar, R., Yadav, S.S., & Thakur, L.S. (2012).Supplier selection using fuzzy AHP and
fuzzy multi-objective linear programming for developing low carbon supply chain.Expert Systems
with Applications, 39(9), 8182-8192.
Shemshadi, A., Shirazi, H., Toreihi, M., &Tarokh, M.J. (2011).A fuzzy VIKOR method for supplier
selection based on entropy measure for objective weighting.Expert Systems with Applications,
38(10), 12160-12167.
Sreekumar, Mahapatra, S.S. (2009). A fuzzy multi-criteria decision making approach for supplier selection in supply chain management. African Journal of Business Management, 3(4), 168-177. Toloo, M., &Nalchigar, S. (2011).A new DEA method for supplier selection in presence of both
cardinal and ordinal data.Expert Systems with Applications, 38(12), 14726-14731.
Wang, J-W., Cheng, C-H., & Huang, K-C.(2009). Fuzzy hierarchical TOPSIS for supplier selection.Applied Soft Computing, 9(1), 377-386.
Wu, D. (2009). Supplier selection: A hybrid model using DEA, decision tree and neural network.
Expert Systems with Applications, 36(5), 9105-9112.
Wu, W-Y., Sukoco, B.M., Li, C-Y., & Chen, S.H. (2009).An integrated multi-objective
decision-making process for supplier selection with bundling problem.Expert Systems with Applications,
36(2), 2327-2337.
Xiao, Z., Chen, W., & Li, L. (2012). An integrated FCM and fuzzy soft set for supplier selection problem based on risk evaluation. Applied Mathematical Modelling, 36(4), 1444-1454.