Bookie, E. and Farag, K.W. 2016. Effects of development on indigenous dietary pattern: A Nigerian case study. Appetite, 107, pp.59-68.
Effects of development on
indigenous dietary pattern: A
Nigerian case study
by Bookie, E. and Farag, K.
Copyright, Publisher and Additional Information: This is the author accepted manuscript. The final published version (version of record) is available online via Elsevier
Please refer to any applicable terms of use of the publisher.
Accepted Manuscript
Effects of development on indigenous dietary pattern: A Nigerian case study
Bookie Ezeomah, Karim Farag
PII: S0195-6663(16)30292-6 DOI: 10.1016/j.appet.2016.07.025 Reference: APPET 3082
To appear in: Appetite
Received Date: 26 February 2016 Revised Date: 18 May 2016 Accepted Date: 18 July 2016
Please cite this article as: Ezeomah B. & Farag K., Effects of development on indigenous dietary pattern: A Nigerian case study, Appetite (2016), doi: 10.1016/j.appet.2016.07.025.
M
AN
US
CR
IP
T
AC
CE
PT
ED
Effects of Development on Indigenous Dietary Pattern: A Nigerian
case study
Bookie Ezeomah1, Karim Farag2
1School of Agriculture, Food and Environment, Royal Agricultural University, United
Kingdom.
2Department of Food Science and Agri-Food Supply Chain Management, Harper Adams
University, United Kingdom
Corresponding Author:
Dr Karim Farag
Senior Lecturer in Food Science and Management Food Science and Agri-Food Supply Chain Management Harper Adams University
Newport Shropshire TF10 8NB UK.
Email: [email protected]
M
AN
US
CR
IP
T
AC
CE
PT
ED
1
Effects of Development on Indigenous Dietary Pattern: A Nigerian case study
1
2
Abstract 3
The traditional foods of indigenous people in Nigeria are known for their cultural symbolism
4
and agricultural biodiversity which contributes to their daily healthy and rich diet. In the early
5
90s, rapid development of the Federal Capital Territory (FCT) was noted and the
6
resettlement of indigenes to other parts of the region was reported. These changes have
7
facilitated the modification of indigenous diets, as indigenous groups rapidly embraced
8
modern foods and also adopted the food culture of migrant ethnic groups. This has led to a
9
gradual erosion of indigenous diets and traditional food systems in the FCT. This study
10
explored the impact of development on traditional food systems and determined indigenes
11
perception of the modification to their food culture as a result of the development of their
12
land within the FCT. Field survey was carried out in four indigenous communities in the FCT
13
(30 indigenes from each of the four areas) using structured questionnaires, Focus Group
14
Discussions (FGDs) and key informant interviews. Person Chi Square analysis of indigenes
15
socio-economic characteristics revealed significant relationships between gender of
16
indigenes and farm size, Age and farm size, Educational level and farm/herd size.
17
Qualitative analysis of FGDs revealed indigenes opinion on the socio-cultural changes in
18
behaviour and food systems as a result of development. The study also identified indigenous
19
youths as being most influenced by development especially through education, white collar
20
jobs and social interactions with migrant ethnic groups in the FCT. The study recommended
21
that indigenes should be provided with more secure land tenure and “back-to-farm” initiatives
22
should be put in place by the Nigerian government to encourage indigenous youth to
23
engaged more in agriculture.
24
25
Keywords: Traditional Food; Diet; Indigenous groups; Culture; Development; Nigeria; FCT
26
M
AN
US
CR
IP
T
AC
CE
PT
ED
2
1 Introduction
1
In most parts of sub-Saharan Africa, the traditional food systems of indigenous people are
2
characterised by rich agricultural biodiversity which contributes immensely to satisfying daily
3
food needs and providing secure livelihoods (Mendez et al., 2005). Hobblink (2004) also
4
added that, in developing countries, the greatest biodiversity is found in rural communities
5
where there is a great dependence on the environment and natural resources for nutritive
6
sustenance. Therefore a sustainable means of promoting food security and nutrition in
7
developing countries is to ensure the viability of their traditional food systems (Smith, 2013).
8
As documented in literature, factors such as, education, food prices, income, political climate
9
and food availability are some of the key drivers of food security and nutrition (Pieters et al.,
10
2013; O'Connor et al., 2016). However, the role of culture and the traditional food systems
11
especially among indigenous people in promoting their food security and nutrition have not
12
been as widely documented as the previously mentioned key drivers.
13
According to Briones (2015), culture shapes food preferences of a group by laying down
14
rules and regulations that determine the acceptance or rejection of certain foods. She added
15
that culture also determines the food production systems, roles and responsibilities in food
16
preparation as well as methods for intra-household food distribution, all of which significantly
17
impacts the food and nutrition security status in the household. Furthermore, indigenous
18
people have been identified as the custodians of traditional knowledge. As such, culture and
19
traditional food systems passed down from previous generations have come to serve as a
20
blueprint for natural resource use and management, which contributes to the sustainability of
21
their food production systems and environment (Kuhnlein et al., 2013).
22
In 1991, the seat of the Nigerian Federal Government moved from Lagos to Abuja resulting
23
in a rapid development of the area and resettlement of indigenes to other parts of the
24
Federal Capital Territory (Adama, 2007). Abuja has also been identified as the fastest
25
growing city in West Africa (LeVan and Olubowole, 2014).
26
This research is based on two indigenous groups within the Federal Capital Territory (FCT)
27
of Nigeria called the Gbagyi (also known as Gwari or Gbari) and Bassa. The research aims
28
to provide an understanding of traditional food systems of indigenous groups in the FCT,
29
determine the extent to which the development of their native land into Federal Capital
30
Territory has influenced their traditional food system and identify indigenes perception of the
31
impact of development on their traditional food system. The research also aims at identifying
32
the key drivers of development that have brought about these changes in food culture and
M
AN
US
CR
IP
T
AC
CE
PT
ED
3
provide recommendations on ways that culture can inform development efforts going
1
forward.
2
2 Research Methodology
3
2.1 Study Area 4
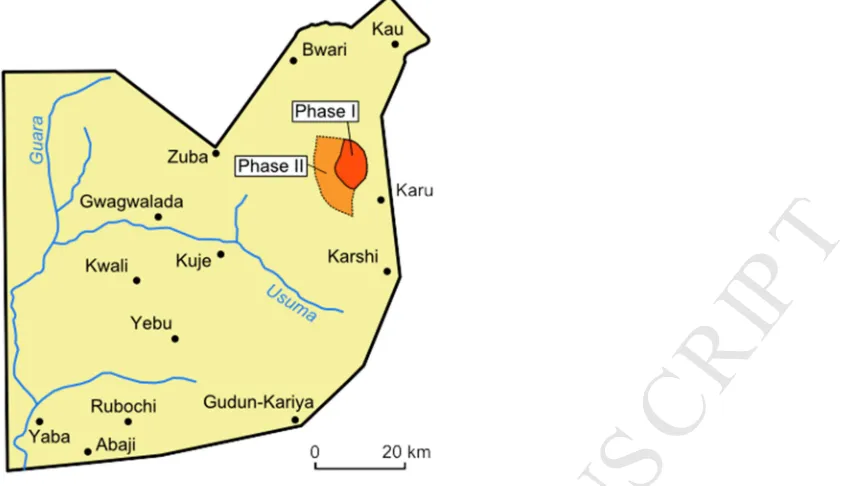
The study area is the Federal Capital Territory (FCT) of Nigeria, located within 9.20; 9.60N
5
and 6.80; 7.20 E in the heart of the Southern Guinea Savannah (Chuwang et al., 2014)
6
(figure 1). The FCT is divided into six area councils namely; Municipal, Abaji, Bwari,
7
Gwagwalada, Kuje and Kwali area councils (figure 2). The Gbagyi and Bassa indigenes
8
within Gwagwalada and Kuje area councils were selected for this research. As the original
9
settlers in the FCT, the Gbagyi’s are considered to be the dominant indigenous group and
10
the Gbagyi language is widely spoken in the region. Other indigenous groups in the FCT are
11
Bassa, Koro, Kadara, Bassankomu, Gade, Ganagana-Nupe, Kurama, Hausa (Maguzawa),
12
Zuru and Kamberi. The major occupations engaged in by these groups are farming, pottery,
13
blacksmith, hunting and woodcutting. These indigenous groups can also be found in other
14
states around the FCT such as Kaduna, Nassarawa and Niger (Filaba, 2008).
15
Placement of Figure 1 16
Gwagwalada has a population of about 157, 770 (NPC, 2006) and occupies a land area of
17
1,043 square kilometres. The indigenes of Gwagwalada are mainly Gbagyi, Bassa,
Housa-18
Fulani, koro and Gede. The two communities selected for this research were Bargada
19
(inhabited by Gbagyi indigenes) and Kaida (inhabited by Bassa indigenes) (Nkechi and Paul,
20
2012). Kuje has a population of approximately 97,367 (NPC, 2006) and occupies a land
21
mass of about 1,800sqkrn. Like Gwagwalada, Kuje is inhabited by several indigenous
22
groups including; Gbagyi, Bassa, Egbirakoto, Gade, Hausa-fulani and others (Jimme et al.,
23
2015). The two communities selected from Kuje were Chukuku (inhabited by Gbagyi
24
indigenes) and Sketuko (inhabited by Bassa Indigenes).
25
Placement of Figure 2 26
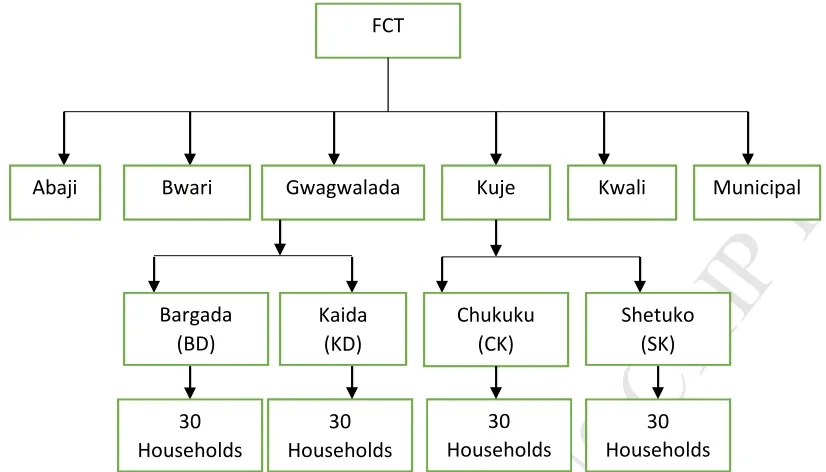
2.2 Sampling Techniques
27
A combination of random and purposive sampling was adopted for this research (see figure
28
3). Using a ballot system, two out of the six area councils in FCT were selected. In each of
29
these area councils, two communities were purposively selected (one Gbagyi and one
30
Bassa) based on the timeliness of response received from village heads. The research was
31
carried out at the peak of their farming season and there was noticeable reluctance to
32
partake in the survey, for this reason, 30 households in each community were selected
33
based on their willingness and availability to fill questionnaires and participate in focus group
M
AN
US
CR
IP
T
AC
CE
PT
ED
4
discussions. The total sample size was 120 respondents from four communities in two area
1
councils.
2
The fieldwork started with a submission of a letter to Gwagwalada and Kuje area councils
3
which was forwarded (and explained) to the village heads. This was followed by an invitation
4
by the village heads. The field work employed a combination of structured questionnaires,
5
focus group discussions, key informant interviews with village heads and elders and
6
photographic documentation with the permission of respondents. To bridge the language
7
gap and ensure accuracy in translating responses from local Gbagyi and Bassa dialects to
8
English, three translators who spoke both English and Gbagyi dialect were used for
9
interviews in Gbagyi communities and another three translators who spoke English and
10
Bassa dialect were used for interviews in the Bassa communities, and one translator who
11
spoke English and Hausa1 was also used though out the field survey. Responses to
12
questions for this research were provided by respondents in Gbayi, Bassa, Hausa or English
13
languages. However, responses to questionnaires which were provided in Gbayi, Bassa and
14
Hausa dialects were written down in English by the translators. Villages selected for this
15
research were Bargada-BD (Gbagyi) and Kaida-KD (Bassa) in Gwagwalada area council
16
and Chukuku-CK (Gbagyi) and Shetuko-SK (Bassa) in Kuje area council.
17
Placement of Figure 3 18
2.3 Data collection
19
Both primary and secondary data were used for this research. Primary data was 20
gathered using structured questionnaires, Focus Group Discussions (FGDs) and key 21
informant interviews (with village heads/elders). Field data collection was carried out 22
over four months (between June and September). The first two weeks of the field study 23
was used to train translators on questionnaire administration and response recording. 24
This period was also used as an opportunity to test the questionnaires and FGD 25
interview guide on 20 respondents (5 respondents in each of the selected communities). 26
The pilot revealed that questionnaire was too long because it took more than 90 minutes 27
to complete each questionnaire. Also because respondents were not able to accurately 28
recall previous meals eaten during the week, quantity and quality of meals (in terms of 29
what extra classes of food included to meals), the food security section of the 30
questionnaire was excluded. Therefore, the piloted questionnaire which contained 35 31
questions was reduced to 20 questions and research questions were also re-evaluated. 32
Educated respondents filled out the questionnaires themselves in English, while the 33
responses of uneducated respondents were recorded by translators in English. 34
1
M
AN
US
CR
IP
T
AC
CE
PT
ED
5
Focus group discussions were also carried out by the researcher and translators using 1
an interview guide made up of 20 questions and a Dictaphone to record responses. One 2
session of FGD was carried out in each community, resulting in a total of 4 sessions 3
FGDs. Each FGD lasted approximately 60 minutes, with 10 respondents in each group. 4
Each group was made up of an uneven mix of men and women based on willingness 5
and availability to participate. Questions were asked by the researcher in English then 6
translated to the local dialect by a translator. Responses were provided in Gbagyi, 7
Bassa or Hausa dialect depending on the community. At the end of each FDG and key 8
informant interview, the researcher and translators listened to recorded sessions and 9
transcribed to English. The research employed more than one translator in both 10
questionnaire administration and FDGs to ensure accuracy in obtaining responses from 11
non-English speaking respondents as well as in recording the correct of spellings of 12
local foods and drinks. Data collected from the field survey were used to derive the 13
socio-economic status of individual households and the socio-cultural profile of the 14
Gbagyi and Bassa indigenous groups especially with regards to their traditional food 15
systems. The secondary data used in this research include the population and land 16
mass of the area councils selected as well as the West Africa food composition tables 17
(FAO, 2012) used to determine the nutritional content of food consumed by 18
respondents. 19
2.4 Data Analysis
20
Data recording and analysis were carried out in English. Various techniques were used to
21
analyse both quantitative and qualitative field data. To analyse quantitative data, descriptive
22
statistics such as percentages, averages, tables and graphs were used. Some qualitative 23
data were also used for cross tabulation to derive relationships between variables (Witte 24
and Witte, 2004). Statistical Package for Social Sciences (SPSS) was used to obtain a
25
Pearson Chi Square value to determine the presence or absence of statistical significant
26
relationships between variables (Arkkelin, 2014). Data obtained from FDGs were analysed
27
and coded qualitatively using NVivo9 software to identify key themes that explained the 28
socio-cultural characteristics of indigenous groups and their perception of developmental 29
impacts on indigenous food culture. 30
3 Results and Discussion
M
AN
US
CR
IP
T
AC
CE
PT
ED
6
3.1 Socio-economic characteristics of respondents
1
3.1.1 Gender and educational level of respondents and dependents2
2
Gender can be a common barrier to equal access to education for boys and girls in
3
indigenous groups (UN 2010). Figure 4 (a) reveals that 41 out of the 120 sampled
4
respondents had no formal education and 10% were male while 24% were female. It should
5
however be noted that there were more female than male respondents. But the study
6
showed that 66% of the entire sampled respondents have had some form of formal
7
education. The reason for the relatively high percentage of sampled respondents that have
8
had some level of education can be attributed to the adult literacy development projects
9
(Odumuh, 2003) which have been instituted in several indigenous communities in FCT
10
including communities in Gwagwalada and Kuje area councils.
11
Placement of Figure 4 12
Figure 4 (b) also shows the rate of school attendance among dependents. Again, there were
13
more female than male dependents in this study from which 27% female dependents had at
14
least primary education compared to 20% male dependents. However, despite the higher
15
number of total female dependents, 22% and 4% of the male dependents had obtained
16
secondary and tertiary education respectively while 16% and only 2% of the female
17
dependents had obtained secondary and tertiary education respectively. These figures
18
reflect the change in the dynamics of education after primary level as more males than
19
females are encouraged to attain a higher level of schooling.
20
The results from figure 4 a and b are in agreement with Alabi and Alabi (2014) who opined
21
that the girl-child is more susceptible to certain geographic, cultural, religious and economic
22
constraints in obtaining education than the male child in Nigeria. However, the results also
23
show that majority both Gbagyi and Bassa Indigenous children have been exposed to some
24
level of formal education. The increased rate of rural children school attendance, especially
25
female children, can be attributed to the Universal Basic Education which was instituted
26
1999 to provide free, universal and compulsory basic education for every Nigerian 27
child between the ages of 6 and 15 years (Amuchie et al, 2015). This has increased
28
opportunities for females to gain primary and junior secondary education at decreased cost
29
to parents and guardians.
30
2
M
AN
US
CR
IP
T
AC
CE
PT
ED
7
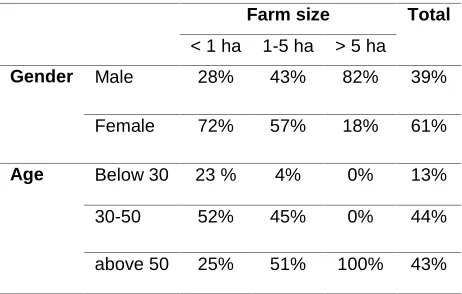
3.1.2 Gender and farm size3
1
The results also show there is a significant relationship between gender and farm size (Chi2
2
p<0.05). Although gender inequality in the use and ownership of production resources has
3
been identified as one of the key problems with agriculture in Nigeria (Olagunju et al., 2012),
4
all 73 female respondents had access4 to land for their farming activities in the study area.
5
This is consistent with the findings of Julius (2014) in his “evaluation of gender assess to
6
farm inputs in Abuja, Nigeria”. He recorded that there was no significant difference between 7
male and female access to farm inputs, including land, among indigenes of the FCT.
8
Placement of Table 1 9
The field survey however revealed that while gender did not influence access to farmland,
10
the size of farmland men and women has access to could be influenced by gender. As
11
shown in table 1, 72% respondents cultivated less than a hectare of farmland were women,
12
yet in contrast, 82% male respondents cultivated over 5 hectares of farmland compared to
13
18% women. The influence of gender on farm size can be attributed to the patriarchal
14
system of most African communities where women have access to farmland from their
15
husband who may have more than one wife. As a result of polygamy, land fragmentation to
16
meet the food production needs of wives may also be the reason for female access to small
17
parcels of land than men (Ngodoo and Idisi, 2014).
18
3.1.3 Age and farm size
19
The results show a significant relationship between age and farm size (Chi2 p<0.05). There
20
were 13% respondents below 30 years of age and 23% of them cultivated less than 1
21
hectare. As shown in table 1, 44% respondents fell between the ages of 30-50 years with
22
52% of them cultivating less than 1 hectare, 45% of them cultivating 1-5 hectares and none
23
of them cultivating above 5 hectares of farmland. The only age group that cultivated above 5
24
hectares were those above 50 years of age. They accounted for 43% of the total sample.
25
The decrease in the area of land cultivated with a decrease in age can be attributed to the
26
fact that younger people who live in indigenous communities tend to have other white and
27
blue collar jobs in urban areas. Also, with the increasing educational level of many young
28
indigenes, as discussed previously in section 3.1.1, farming has become a secondary source
29
of income and is therefore seen as less convenient than white collar jobs. These findings are
30
consistent with Pam (2014) who reported that rural-urban migration among Nigerian youths
31
in search of “better sources of livelihoods” has influenced the level of agricultural activities in
32
3
Farm size here means area of land in cultivation or on which animals are raised, not area of land owned but not yet used for agricultural purposes (land owned may be greater or equal to farm size)
4
M
AN
US
CR
IP
T
AC
CE
PT
ED
8
rural areas, as less land is being cultivated and farming activities are carried out for aged
1
and weaker groups.
2
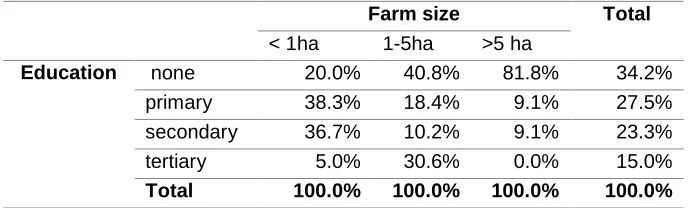
3.1.4 Educational level, farm size and herd size
3
There is also a significant relationship between the level of education attained and the size
4
of farm land cultivated (Chi2 p<0.001). As shown in table 2, 34.2% of the respondents with
5
no formal education cultivated relatively larger farms in the category of >5 hectares and 1-5
6
hectares. On the other hand, none of the respondent with tertiary education which
7
represented 15% of the sample tested cultivated above 5 hectares.
8
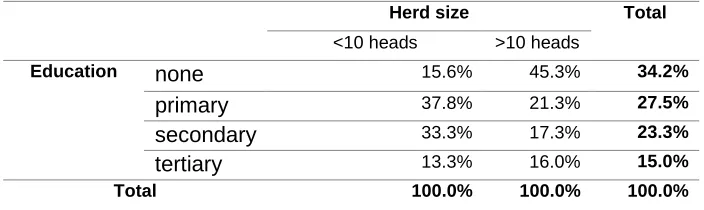
Placement of Table 2 9
There was also a significant relationship between educational level and herd size (p <0.05).
10
This is more evident among respondents with a herd size of 10-50 animals. As seen in table
11
3, the number of respondents with a herd size of 10-50 animals decreases with an increase
12
in educational level. Animals raised by indigenous respondents include cattle, sheep, goats,
13
chickens and pigs.
14
Placement of Table 3 15
Although no extensive research has been conducted to determine the relationship between
16
education, farm size and herd size in Nigeria, it can be deduced from the results that
17
because farming tends to be the primary source of income for uneducated respondents, they
18
tend to cultivate larger parcels of land as well as diversify their incomes by raring more
19
animals than respondents who have increased opportunities of securing non-farming
20
employment because they have attained some level of formal education.
21
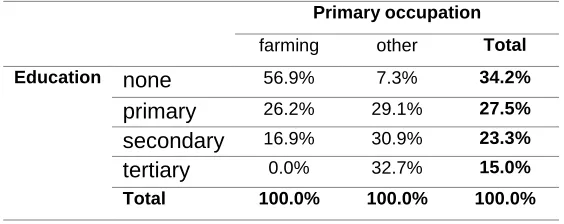
3.1.5 Educational level and primary occupation
22
The indigenous people of FCT are traditionally farmers (Ogundele, 2004). The results reveal
23
a significant relationship between educational level and primary occupation (Chi2 p<0.001).
24
As seen in Table 4 there were 65 respondents with farming as their primary occupation,
25
56.9% of them had no education, 26.2% had primary education, 16.9% had secondary
26
education and none of the respondents with tertiary education had farming as a primary
27
education. This shows that the number of respondents with farming as a primary occupation
28
decreases with an increase in the level of education attained.
29
Placement of Table 4 30
These results are consistent with the findings of Espig (1992) who opined that farmers
31
abandon farming as their educational level increases. Julius (2013) also argued that most
32
farmers with, at least, primary education do not engage in agriculture as a main occupation
33
and farmers without formal education depend mainly on agriculture for their income and
M
AN
US
CR
IP
T
AC
CE
PT
ED
9
livelihood. The research reveal that other primary and secondary occupations which Gbagyi
1
and Bassa respondents engage in include teaching, nursing, catering, security guarding,
2
motorcycle riding, shoe mending, weaving, fire wood trading, pottery, carving and
3
commercial driving.
4
3.2 Socio-cultural characteristics of the indigenous groups in relation to
5
traditional food systems
6
Data extracted from the focus group discussion was coded using the NVivo9 software under
7
a number of different conceptual headings discussed in this section.
8
For the purpose of this analysis, traditional food system is defined as
9
“All food within a particular culture that is available from local natural resources and 10
culturally accepted. It also includes the sociocultural meanings, 11
acquisition/processing techniques, use, compositions and nutritional consequences 12
for the people using the food” (Kuhnlein and Receveur, 1996) 13
Observations and communications with elders of both the Gbagyi and Bassa indigenous
14
groups in the study area revealed that these two groups have very similar traditional food
15
systems. These observations are consistent with Filaba (2007) who found that the Gbagyi
16
and all other indigenous groups in the FCT including the Bassa’s grow and consume the
17
same type of food crops as well as share similar food production system and consumption
18
practices. They added that there was a cordial relationship between all indigenous groups in
19
the FCT because of the similar culture they share.
20
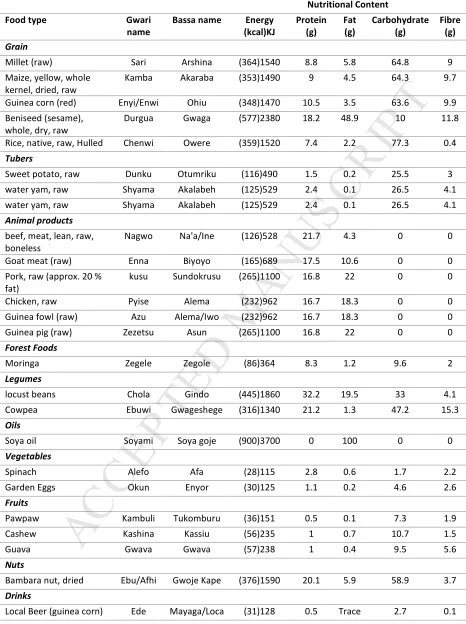
The major food security crop for both indigenous groups is guinea corn (Sorghum bicolor),
21
also known as “ewyi” in the Gbagyi dialect and “ohiu” in the Bassa dialect. According to the
22
FAO West Africa food composition table, guinea corn is an energy crop rich in carbohydrate,
23
protein and fibre. Guinea corn is also rich in various micronutrients as shown in table 5
24
below.
25
Guinea corn was described by the Sarkin Noma (Chief Farmer among the Bassa people) as
26
“the king of all foods” because it is consumed in various forms in the morning, afternoon and
27
night by the indigenous people of FCT. He also added that in times of ill health, guinea corn
28
is made into pap (a semi-solid liquid) or Kunu (a liquid drink) both of which are believed to
29
facilitate recovery. Pap and kunu are also famous weaning foods used among FCT
30
indigenes as well as the whole of West Africa in general (Onofiok and Nnanyelugo, 1998).
31
The belief that guinea corn is the main sustaining food was also affirmed by a Gbagyi
32
indigene named Kuchazi who said that “no matter what we eat, it’s only food made from
33
M
AN
US
CR
IP
T
AC
CE
PT
ED
10
farmers, they eat azhe- a stiff porridge – made from guinea corn early in the morning before
1
engaging in their farming activities. When consumed in the morning, this azhe sustains them
2
till the return home in the evening. Other traditional food crops produced and consumed by
3
indigenes are presented in table 5.
4
Placement of Table 5 5
3.2.1 Food production, processing, preparation and consumption practices
6
a. Food production and processing
7
The food production roles of FCT indigenous men and women have changed over the years.
8
According to Ogundele (2004), in the past, farming was strictly a role for men while food
9
processing, preparation, presentation as well as firewood cutting was done by women.
10
However, the research revealed that women now actively engage in farming. According to
11
the Sarkin noma (Chief farmer) of a Bassa village
12
“Women now farm as much as men do, to the point that some women realise better 13
harvest than men. The yields and income they earn from sales of their produce is 14
theirs to do as the wish”. 15
He also expressed that due to the divide in farming activities, men and women now live
16
relatively separate lives in terms of farm management decisions and income. However, this
17
can be seen as a means of income decentralisation and a means of ensuring continuous
18
food security in the household. Since men and women farm separately, in the case of yield
19
failure on one farm, the household can still be food secure through the food and income
20
obtained from the other farm.
21
Grain processing is mostly done by women and female children. There are several steps
22
involved in grain processing which are both time and energy consuming. After the grain has
23
been harvested and threshed, it is put in a wooden mortal, sprinkled with little water and
24
pounded lightly to separate the grain coat from the grain, it is then air dried, washed and
25
dried again to obtain chaff-free grain. Grain grinding was commonly done on a flat stone to
26
obtain flour. The finer flour is separated to make the stiff porridge (azhe) while the residue
27
(shibia) is used to make a semi-stiff porridge called pete or Kyai in bassa dialect. This
28
residue is also added when making bean porridge. However, recently, grain grinding is done
29
using a grain grinding machine which has become a business enterprise for indigenous
30
women who provide this service.
31
Older female indigenes believe that younger indigenes are more inclined to accepting
32
modern and foods from migrant cultures (see table 6) because of how tedious grain
M
AN
US
CR
IP
T
AC
CE
PT
ED
11
processing tends to be compared to the ease and shorter time it takes to prepare moderns
1
foods like noodles, spaghetti or tea. Tnucheyi a 63 year old Gbagyi woman said that;
2
“In the past, because grain processing was something we had to do in order to feed 3
our families, we found ways to make it interesting such as singing, but today because 4
there are other types of foods, our children do not find as much joy when processing 5
grain, they feel it is hard work” 6
Placement of Table 6 7
b. Food preparation and consumption
8
Food preparation is also mostly done by women and female children. Word frequency
9
queries in the NVIVO analysis revealed that the favourite food among older indigenes is
10
Tuwo, Zhepwo and Jehun, all made from guinea corn, and pounded yam. Other foods which 11
they enjoy include amala (made from yam peels) and garri (made from cassava) both eaten
12
with local soups. The Gbagyi and Bassa indigenes have evolved a means of preserving their
13
food especially the stiff porridge made from guinea corn- tuwo. During the preparation of
14
tuwo, ash from the firewood being used cook is added into the boiling water before the 15
guinea corn, millet or corn flour is added. This ash preserves leftover tuwo for up to two
16
weeks with it going bad.
17
Two food consumption patterns were observed among Gbagyi and Bassa indigenes. Larger
18
polygamous families practiced the household-communal eating pattern especially during
19
their evening meal. This however largely depends on the relationship among members of
20
households explained Lanisha – 50 year old Bassa woman. Most households are
21
polygamous and it is common for children of each wife to come together and share a meal or
22
for all children to eat together - sometimes from the same bowl, depending on the agreement
23
among wives. It was also noticed that men within a compound5 would gather to eat together,
24
while women did the same. When asked the reason for their household- communal eating
25
culture, Awyetalumilo - a 34 year old Gbagyi indigene said
26
“Eating together keeps us close as a family, it gives us a chance to talk to each other
27
and share experiences every day. It is part of our culture” 28
It is also very common for outsiders who arrive during a meal to be offered a plate of food
29
and asked to join the family meal. Therefore food is always prepared in large quantities to
30
make allowances for visitors.
31
5
M
AN
US
CR
IP
T
AC
CE
PT
ED
12
The second eating practice observed was the individual eating pattern mostly practiced in
1
families where the household was not part of a “compound”. Individuals within this
2
household had their meals at various times during the day depending on their individual
3
schedules. These families were also observed to live in houses built with modern building
4
materials like concrete blocks, unlike most traditional houses which are built with mud bricks.
5
This observation is consistent with the findings of Mai and Shamsuddin (2012) who also
6
observed a change in the social order and eating practices of Gbagyi households as their
7
building patterns changed to emulate modern housing.
8
3.2.2 Rituals, customs and ceremonies
9
Among all traditional foods consumed by Gbagyi and Bassa indigenes, guinea corn not only
10
has nutritional importance but also has cultural significance. In the past, marriage was strictly
11
by betrothal and a young man seeking a girls hand in marriage was required to work on the
12
girl’s father’s farm for seven years and also provide grains – especially guinea corn for her to
13
be fed and fattened before the wedding day. When there is more than one suitor, a farming
14
competition is organised to select the stronger of the two. In recent times however, this
15
tradition has been replaced with the payment of a dowry including boxes of clothing,
16
assorted food items and modern drinks.
17
The Agbamaya festival is a celebrated by the Gbagyi at the beginning of the raining season
18
to welcome the rain, while Zhibaje is a festival celebrate to mark the harvest of guinea corn
19
and also celebrated to mark the first rains (Filaba, 2007). During these festivals, a locally
20
brewed beer called brukutu made from fermented guinea corn is commonly drunk.
21
3.3 Development and indigenous food culture (NVIVO)
22
3.3.1 Forms of development directly influencing indigenous food culture
23
Using the query function to identify word frequencies in the NVivo9 analysis, the research
24
was able to identify the forms of development which the indigenous groups believe have
25
directly influenced their food culture. The highest word frequencies include education,
26
immigration, new forms of employment, roads, land tenure, trade, roads and religion.
27
As seen from the results in section 3.1.1 majority of both Gbagyi and Bassa indigenes have
28
attained at least primary education. Education is accompanied with an exposure to other
29
cultures and behaviour patterns (Pam, 2014).Tthis could encourage the modification and in
30
some cases the erosion of indigenous culture. Expressing his concern, a 68 year old Gbagyi
31
indigene- Shekwoduza- said that;
32
“Our children now go to school but do not learn about their culture there, we
33
M
AN
US
CR
IP
T
AC
CE
PT
ED
13
foods. Children should be taught in school that their traditional foods are good 1
and not something to they should be ashamed of”. 2
Furthermore, the relocation of the Federal Capital Territory from Lagos to Abuja resulted
3
in the immigration of many people with different cultural backgrounds into the area
4
(Filaba, 2007). This has also significantly influenced the types of foods eaten by the
5
indigenes as well as some of their food preparation techniques. Mwaboyi, a Gbagyi
6
indigene said that;
7
“Now that we have many people from different places living among us, I have 8
learnt to eat okpa from the Igbos, amala from the Yoruba’s and masa from the 9
Hausa’s. I now use palm oil in making my soup like the Igbo’s and Yoruba’s 10
do” 11
The relocation of the FCT to Abuja also facilitated the creation of new forms of white and
12
blue collar jobs especially with Federal ministries, local government offices, hospitals,
13
schools and private businesses. These jobs have attracted many indigenes especially
14
the youth who more educated than older indigenes. This has facilitated the interaction
15
between indigenous youth and youths from migrant cultures (Mai and Shamsuddin,
16
2012). As a result, their eating habits, mode of dressing and mannerism have also been
17
significantly influenced. Tozabeyi, 78 year old Bassa indigene who explained that;
18
“Before Abuja became the FCT, we did not see the need for schools, we taught 19
our children our culture, but development now makes our traditional methods of 20
education look like it is not good enough. If we want our children to become “big 21
people” they have to go to school. They now mix with other people, behave 22
differently and eat different foods” 23
As mentioned in section 3.1.6, there was a significant relationship between education
24
and primary occupation. The higher the educational level the less likely the indigene was
25
to engage in farming as a primary occupation and the lower the educational level the
26
more likely the indigene was to engage in farming as a primary occupation.
27
Religion is another factor that has contributed to the modification of the food culture
28
among the Gbagyi and Bassa indigenes. Muslim respondents accounted for 44.2% of the
29
total sample size, and all indicated that they do not eat pork because of religious laws.
30
However, non-Muslim indigenes who accounted for 53.3% of the total sample size
31
indicated that raise pigs and eat pork as part of their source of livelihood and nutrition.
32
Also Christianity forbids the use of traditional healing rituals and foods prepared for the
33
purposes of restoring health by native doctors (Falola, 2001). Traditionalists, who are
M
AN
US
CR
IP
T
AC
CE
PT
ED
14
neither Muslim nor Christian, accounted for 2.5% of the total sample and indicated that
1
they only constrained by traditional taboos, most of which forbid the consumption of
2
snakes, monkeys and bats. However, Christian and Muslim respondents also indicated
3
that they do not eat foods which are also traditionally forbidden such as snakes, monkeys
4
and bats.
5
Furthermore, the creation of new roads has improved access to market and expanded
6
trade opportunities. Common hot spots for trade include the Gwagwalada and Kuje
7
markets which hold their “market days” every four days. These markets attract traders
8
from different cultures selling indigenous, non-indigenous and modern food products,
9
thereby availing indigenes the opportunity to experiment with new foods.
10
3.3.2 Indigenes perception of the impact of development on their traditional
11
food systems
12
Development from its inception should be human-oriented and take cognisance of the
felt-13
needs of those groups that would be impacted by developmental processes (Nkechi and
14
Paul, 2012). Without taking into account certain socio-cultural factors that tend to influence
15
the ability of recipient’s to fully take advantage and benefit from development activities, such
16
development efforts may not be rightly described as “development” to those groups.
17
The field survey revealed that there was general agreement that development had
18
influenced the traditional food systems of indigenous people in FCT. Indigenes perception of
19
the impact of development on their traditional food systems fell into four categories. These
20
are: indigenes not owning the land they cultivate, youth decreasing engagement in farming;
21
changing roles of indigenous women and lack of government funding to support the
22
promotion of traditional festivals.
23
The land tenure system in Nigeria vests the ownership of all urban land to the state
24
government and ownership of rural land to the local government. However, all lands within
25
the study area- Federal Capital Territory are vested exclusively in the Federal Government
26
of Nigeria. This means that the indigenes do own the land they cultivate and live on but just
27
have access to the land (Alarima, et al 2012).
28
“Our culture, our food and our traditions are tied to our land. Development has taken
29
a lot of our land and given to other people, we have been made tenants on our own 30
land. Without our land we have no culture”. (Malaga-72, Bassa) 31
According to UN (2007), Indigenous peoples’ connection to their traditional lands and
32
territory is deeply rooted in their culture and history and also forms a core part of their
33
spirituality and identity. Therefore, when they do not have complete ownership of their land,
34
it rids them of an important aspect of their identity and culture.
M
AN
US
CR
IP
T
AC
CE
PT
ED
15
Focus Group discussions and key informant interviews revealed that young indigenes
1
increasingly prefer white collar jobs over farming. This seems to threaten the long term
2
sustainability of traditional food systems in the study area. As many young indigenes get
3
educated, they become exposed to the relatively easy way of life these white collar jobs and
4
non-farming enterprises could provide. This makes them less inclined to engage in farming
5
as a source of income because they want to be like the other young people they meet in
6
cities.
7
I am worried that development has made our children more eager to live modern 8
lives and eat modern foods. They are not as strong as we were when we were 9
younger because of these new foods they eat, that is why they cannot farm as much 10
as we did” (Pambolo – 68, Gbagyi) 11
12
Odia and Odia (2013) opined that the reduction in employment opportunities for Nigerian
13
graduates is a call for youths to develop entrepreneurial skills as this will reduce their
14
dependence on salaried employment. Therefore, indigenous youth who already have access
15
to land are in a better position to earn a living from agriculture than migrant youths who face
16
challenges in acquiring land for farming purposes in the FCT. Encouraging indigenous youth
17
to engage in farming as a source of income will contribute to the sustainability of their
18
traditional food system.
19
20
In terms of income diversification and off farming season employment, most indigenous
21
women viewed development as a form of financial empowerment. Women now own
22
businesses and engage in other less tedious jobs asides the usual farming, grain
23
processing, weaving and carving. Although this empowerment has led to many women
24
becoming key providers for their families, they see this as an opportunity to contribute
25
meaningfully to the household.
26
“The change is good because I can do other things to support my family while I wait
27
for my harvest. I own a shop and also do some cleaning jobs in the city. I have learnt 28
to prepare other foods which do not take as much time to process like our traditional 29
foods. This gives me the time I need to do other types of work and provide for my 30
family” (Kukuta – 38, Bassa) 31
Filaba (2007) also explained that the empowerment of FCT indigenous women through
32
income diversification avenues was borne out of earning low incomes from their faming
33
activities as well as the negative health effect of farm labour. This made them keen to
M
AN
US
CR
IP
T
AC
CE
PT
ED
16
embrace the new forms of employment created by development so as to supplement their
1
farm incomes.
2
3
Lastly, in terms of the sustainability of their traditional food system and culture, Focus group
4
Discussions also revealed that indigenes are of the opinion that if they are encouraged to
5
display their rich culture through festivals and cultural events, their children will have a better
6
identity among migrant cultures and migrants will also have a better appreciation of the
7
cultural heritage of FCT indigenous groups.
8
9
“I do not think development can completely take over our traditional foods or our
10
land. Our culture has been around for many years and cannot die, but the 11
government should encourage us by sponsoring our traditional festivals so we can 12
show people our rich culture”. (Donamu- 45 year old Gbagyi indigene) 13
It is not uncommon for the government to show support for indigenous culture. For instance, in
14
Cross River state, Nigeria, the government sponsors the annual Calabar festival. This festival is
15
an opportunity for indigenes to showcase their traditional dance, foods, attires and creativity.
16
The festival is not done only among the indigenous groups in Cross River state, but is openly
17
displayed on the streets for all to participate and appreciate. This festival has received
18
international recognition and is believed to contribute to the sustainability of the Akwa Ibom
19
tradition and culture (Agba, 2013).
20
21
4 Conclusion
22
This research has been an expose on the impact of development on the traditional food
23
systems of indigenous groups in FCT. The research found that the relocation of the Nigerian
24
Federal Capital from Lagos to Abuja brought development in the form of education, roads,
25
jobs and immigrants. These forms of development have modified the FCT indigenous food
26
culture, resulting in some sort of hybrid traditional food system which now includes modern
27
foods and non-indigenous traditional foods, both of which are contributing to the erosion of
28
the indigenous food culture in FCT.
29
The study also highlight younger indigenous people are most influenced by development
30
and are more likely to adopt new food cultures as they mix with people from other cultures
31
and ethnic groups in schools, white collar jobs and through trade. As a result, it can be
32
argued that the introduction of a new social order in the FCT has borne some sort of identity
33
crisis among indigenous youth. This is also because they live in close proximity to a
34
cosmopolitan city but are still a part of their indigenous society. As such they are mentally
M
AN
US
CR
IP
T
AC
CE
PT
ED
17
and physically exposed to a culture completely different from what they are born into and
1
strive to fit into the modern culture without losing their cultural identity.
2
The research identified that young female indigenes embrace other food ways because of
3
the difficulty in processing and preparing indigenous foods like guinea corn as opposed to
4
modern foods such as noodles that takes less than 10 minutes to prepare. This research
5
therefore recommends the incorporation of food and nutrition courses in adult education
6
classes to train women on easier grain processing techniques.
7
While over 60% of respondents were averse to change as they felt it was a threat to their
8
culture, others had positive views about development especially with regards to income
9
diversification, ease of food preparation, varieties of foods they now consumed and trade
10
expansion. The traditional food system of both ethnic groups relegated women to food
11
production, processing and preparation. But with development, women have diversified into
12
other roles and embraced other food systems that do not require as much labour and time to
13
prepare.
14
The research recommends that the Nigerian government should take advantage of the 2016
15
United Nations international year of pulses to initiate agricultural development projects to
16
encourage indigenes to grow and consume more of their indigenous pulses especially the
17
black eyed beans. This will not only supplement their high carbohydrate intake from guinea
18
corn but will also promote nitrogen fixation and improved soil fertility on farmers’ fields.
19
However, it is important that implementing these development projects is informed by
20
indigenous knowledge, respect traditional culture and focuses on the real needs of
21
indigenous people. This will ensure that development efforts do not to change indigenous
22
food ways by introducing new knowledge or techniques that do not agree with traditional
23
systems.
24
The research also recommends that FCT indigenes should have more secure tittles to their
25
land. Security of tenure is fundamental to Indigenous Peoples’ cultural identity and security,
26
and can be improved through acknowledgment of customary tenure and practices”. The
27
2007 UN Declaration on the Rights of Indigenous Peoples and the 1989 ILO Convention No.
28
169 gives indigenous people the right to control their natural resources and also demands
29
that states respect indigenous lands and territories (Woodley et al., 2009).
30
Finally, more research is required to explore the impact of the increasing market-demand for
31
indigenous crops on the food and nutrition security of indigenes and also ascertain whether
32
FCT indigenous groups are more susceptible to hidden hunger than migrant ethnic groups
33
within the FCT.
M
AN
US
CR
IP
T
AC
CE
PT
ED
18 Acknowledgements
1
The Authors are thankful to the village heads of Baragda, Kaida, Shetugo and Chukuku for
2
granting her the permission to conduct this research in their communities. The translation
3
and extension support from Yohanna Masara, Simon Bulus, Billy Audu, Wambai Abubakar,
4
Dauda Salisu, Uche Iroha and Sam gwani are also duly acknowledged. The Authors are also
5
thankful to the African Fellowship Trust and the Royal Agricultural University, United
6
Kingdom for their funding and research support.
7
8
9
M
AN
US
CR
IP
T
AC
CE
PT
ED
19 References 11. Adama, O., (2007). Governing from above: solid waste management in Nigeria’s new
2
capital city of Abuja. Ph.D. thesis, Stockholm University, Sweden
3
4
2. Agba, J. U (2013) The performing Arts and the carnival, Calabar: The implications for
5
human rights protection in Nigeria. Journal of Humanities and Social Science. 11(4):
4-6
12
7 8
3. Ajah Julius (2013) Impacts of gender and farmers’ level of education on access to
9
agricultural extension services in Abuja, Nigeria. International Journal of Agricultural
10
Economics and Extension. 1 (7): 55-60. 11
12
4. Alabi, T. and Alabi, O.S. (2014) Female education: A sociological analysis of girl-child
13
education in Nigeria A. International Journal of Educational Policy Research and Review.
14
1 (1): 6-13
15
5. Alarima, C. I., Fabusor, E., Kolawole, A., Uzoma, K. C., Aromolarin, A. K., Masunaga, T.,
16
Wakatsuk, T., (2012) Land rights and rental systems: Implications for management of
17
conflicts related to land in sawah-based rice production systems in Nigeria. African Study
18
Monographs. 33(3): 189-208 19
20
6. Amuchie, A. A., Asotibe, N., and Audu, C. T (2015) An Appraisal of the Universal Basic
21
Education in Nigeria. Journal of Poverty Investment and Development. 8:107-112
22 23
7. Arkkelin, D (2014) Using SPSS to Understand Research and Data Analysis. Psychology
24
Curricular Materials. Book 1 25
26
8. Briones, A. E (2015) The impact of culture, religion and traditional knowledge on food
27
and nutrition security in developing countries. FoodSecure Working Paper Series.
30:1-28
81
29 30
9. Chuwang, P.Z., Oyerinde, A.A and Emmanuel, H. (2014) Assessment of Cowpea (Vigna
31
unguiculata:(L) Warp ) Production in Abuja Central Nigeria. Landmark research journal of
32
Agriculture and Soil Sciences. 1(3): 32-36 33
34
10. Espig, A. F. (1992) Economics of Yam Production in Haryan. Indian Journal of
35
Agricultural Economics. 92 (7): 28-34 36
37
11. Falola, T. (2001) Cultures and Customs of Nigeria. Greenwood Publishing Group
38 39
12. Filaba, M. A (2007) the empowerment of indigenous women in the Federal Capital
40
Territory, Abuja Nigeria. Ethiopian Journal of Education and Science. 2 (2): 103-112
41 42 43
13. Food and Agriculture Organisation (2012) West Africa Food Composition Table. FAO,
44
Rome
45 46
14. Hobblink, H. (2004) ‘Biodiversity. What’s at Stake? Currents. (35/36): 8-21
M
AN
US
CR
IP
T
AC
CE
PT
ED
2015. Jimme, M.A; Gwamna, A.I. and Ikusemoran, M. (2015) Landuse and Landcover Change
1
Detection in Kuje Area Council of the Federal Capital Territory (FCT), Abuja, Nigeria.
2
IOSR Journal of Environmental Science, Toxicology and Food Technology. 9(10): 1-11 3
4
16. Julius, A. (2014) Perceptional evaluation of gender access to farm inputs in Abuja,
5
Nigeria. Journal of Sustainable Development in Africa. 16:2
6 7
17. Kuhnlein, H.V.; Erasmus, B.; Spigelski, D.; Burlingame, B. (2013) Indigenous Peoples’
8
Food Systems and Well-Being: Interventions and Policies for Healthy Communities;
9
FAO: Rome, Italy; p. ix
10 11
18. Kuhnlein, H. V and Receveur, O. (1996) Dietary Change and Traditional Food Systems
12
of Indigenous Peoples. Annual Review on Nutrition. 16:417-442
13 14
19. LeVan, C. A. and Olubowala, J (2014) I am here until development comes:
15
Displacement, demolitions, and property rights in urbanizing Nigeria. African Affairs.
16
113(452): 387-408
17 18
20. Mai, M. M., and Shamsuddin, S (2012). Urbanisation and Globalisation of Gbagyi
19
Housing Transformation. Putra: Universiti Teknologi Malaysia.
20 21
21. Mendez, M.A., Monteiro, C.A., Popkin, B.M. (2005) ‘Overweight exceeds underweight
22
among women in most developing countries’. American Journal of Clinical Nutrition. (81):
23
714–721.
24 25
22. Ministry of the Federal Capital Territory. (1998). Abuja Handbook. Lagos: Ministry of
26
Federal Capital Territory
27 28
23. Ngodoo, A.C. and Idisi, P. O. (2014) inequality gaps: issues for smallholder farming in
29
Nigeria International Journal of Humanities and Social Science. 4(11): 274-286
30 31
24. Nkechi, I.E and Paul, C. (2012) Social Services Administration in Gwagwalada Area
32
Council: Militating Factors. Journal of Public Administration and Governance. 2(3):
159-33
170
34 35
25. NPC (2006) Population and hosing census: Enumerators manual. Federal Republic of
36
Nigeria, National Population Commission, Nigeria, pp:1-16
37 38
26. O'Connor, N., Farag, K. and Baines, R. (2016) What is food poverty? A conceptual
39
framework. British Food Journa.l 118 (2) pp.429 - 449
40
41
27. Odia, J. O and Odia, A. A (2013) Developing entrepreneurial skills and transforming 42
challenges into opportunities in Nigeria. Journal of Education and Social Research. 3(3):
43
289-298 44
45
28. Odumuh, T. O (2003) Adult Literacy as an Agent of Development among Rural
46
Communities in Gwagwalada Area Council of F.C.T. Ilorin Journal of Education. 22:
126-47
132
M
AN
US
CR
IP
T
AC
CE
PT
ED
21
29. Ogundele, S. O., (2004) some indigenous knowledge systems in parts of central Nigeria.
1
International Journal of Traditional Knowledge. 5(1): 108-113 2
3
30. Olagunju, F.I., Fakayode, S. B., Babatunde, R. O. and Ogunwole-Olapade, F. (2012).
4
Gender Analysis of Sweet Potato Production in Osun State, Nigeria. Asian Journal of
5
Agricultural Extension, Economics and Sociology. 2(1): 1 – 13. 6
7
31. Onofiok, N. O and Nnanyelugo, D. O (1998) Weaning foods in West Africa: nutritional
8
problems and possible solutions. Food and Nutrition Bulletin. 19: 17–20
9
32. Pam, T. D. (2014) Rural-urban migration among youths in Nigeria: the impacts on
10
agriculture and rural development. IOSR Journal of Humanities and Social Science.
11
19(3): 120-123
12 13
33. Pieters, H., Andrea G. and Anneleen V. (2013) Conceptual Framework for the Analysis
14
of the Determinants of Food and Nutrition Security. FoodSecure Working Paper 13.
15
16
34. Smith, I.F. (2013) Sustained and integrated promotion of local, traditional food systems
17
for nutrition security. In Diversifying Food and Diets: Using Agricultural Biodiversity to
18
Improve Nutrition and Health; Fanzo, J., Hunter, D., Borelli, T., Mattei, F., Eds.; 19
Earthscan: London, UK, 2013; pp. 122–139
20 21
35. United Nations (2007) Indigenous people’s Land, Territories and Natural Resources.
22
United Nations Permanent Forum on Indigenous Issues.
23
http://www.un.org/en/events/indigenousday/pdf/Backgrounder_LTNR_FINAL.pdf
24 25
36. United Nations (2010) United Nations Office of the Special Adviser on Gender Issues 26
and Advancement of Women and the Secretariat of the United Nations Permanent
27
Forum on Indigenous Issues. Briefing note No. 3 http://bit.ly/1Raqv2i
28 29
37. Witte, R.S. and Witte, J.S. (2004). Statistics. 7th ed. USA: Jhon Wiley and Sons, Inc
30
31
38. Woodley, E. C., Pryck, E., and Carmen, A. (2009) Cultural indicators of Indigenous 32
Peoples' food and agro-ecological systems. Sustainable Agriclture and rural
33
development project. E/C.19/2009/CRP. 3 34
M
AN
US
CR
IP
T
AC
CE
PT
ED
Table 1: The relation of gender / age groups and Farm size
Farm size Total
< 1 ha 1-5 ha > 5 ha
Gender Male 28% 43% 82% 39%
Female 72% 57% 18% 61%
Age Below 30 23 % 4% 0% 13%
30-50 52% 45% 0% 44%
M
AN
US
CR
IP
T
AC
CE
PT
ED
Table 2: Relation between educational level and farm size
Farm size Total
< 1ha 1-5ha >5 ha
Education none 20.0% 40.8% 81.8% 34.2%
primary 38.3% 18.4% 9.1% 27.5%
secondary 36.7% 10.2% 9.1% 23.3%
tertiary 5.0% 30.6% 0.0% 15.0%
M
AN
US
CR
IP
T
AC
CE
PT
ED
Table 3: Relation between education level and herd size
Herd size Total
<10 heads >10 heads
Education none 15.6% 45.3% 34.2%
primary 37.8% 21.3% 27.5%
secondary 33.3% 17.3% 23.3%
tertiary 13.3% 16.0% 15.0%
M
AN
US
CR
IP
T
AC
CE
PT
ED
Table 4: Relation between educational level and primary occupation
Primary occupation
farming other Total
Education none 56.9% 7.3% 34.2%
primary 26.2% 29.1% 27.5%
secondary 16.9% 30.9% 23.3%